. 2017 Sep 29;18(1):98.
doi: 10.1186/s10194-017-0803-5.

Brain networking analysis in migraine with and without aura

Affiliations

Brain networking analysis in migraine with and without aura

Marina de Tommaso et al. J Headache Pain. .

Abstract

Background: To apply effective connectivity by means of nonlinear Granger Causality (GC) and brain networking analysis to basal EEG and under visual stimulation by checkerboard gratings with 0.5 and 2.0 cpd as spatial frequency in migraine with aura (MA) and without aura (MO), and to compare these findings with Blood Oxygen Level Dependent (BOLD) signal changes.

Methods: Nineteen asymptomatic MA and MO patients and 11 age and sex matched controls (C) were recorded by 65 EEG channels. The same visual stimulation was employed to evaluate BOLD signal changes in a subgroup of MA and MO. The GC and brain networking were applied to EEG signals.

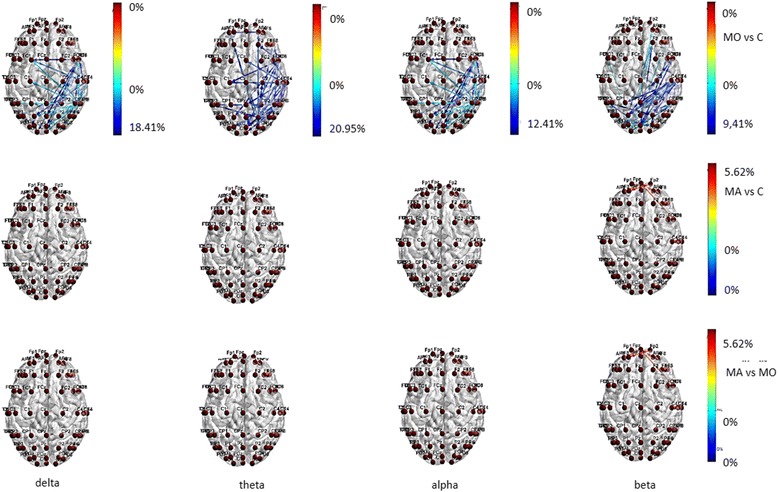
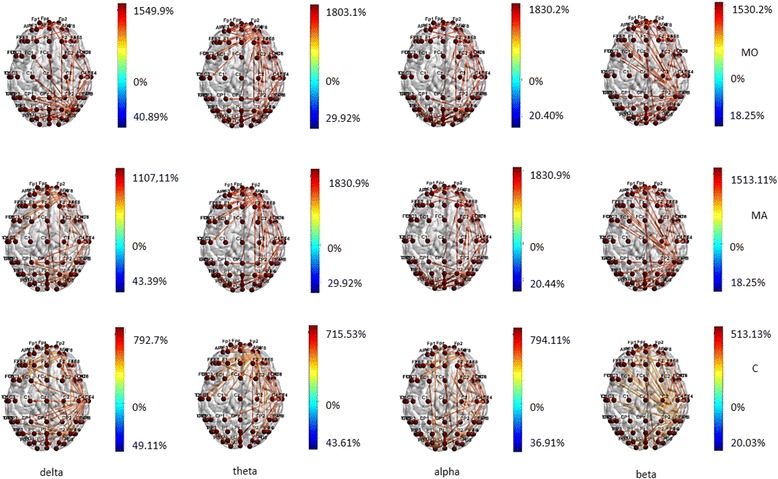
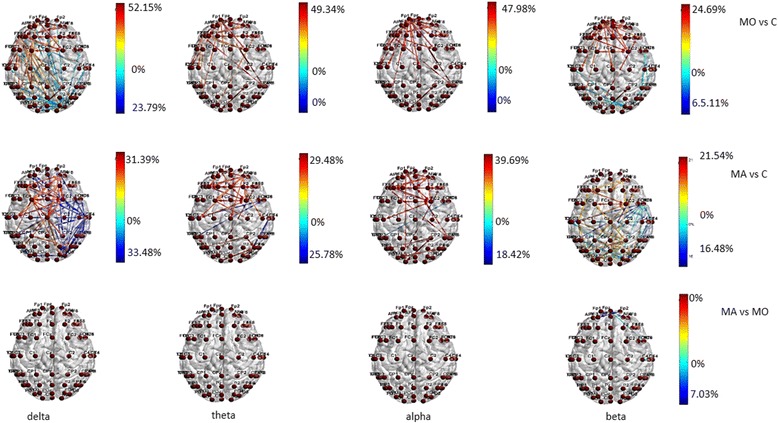
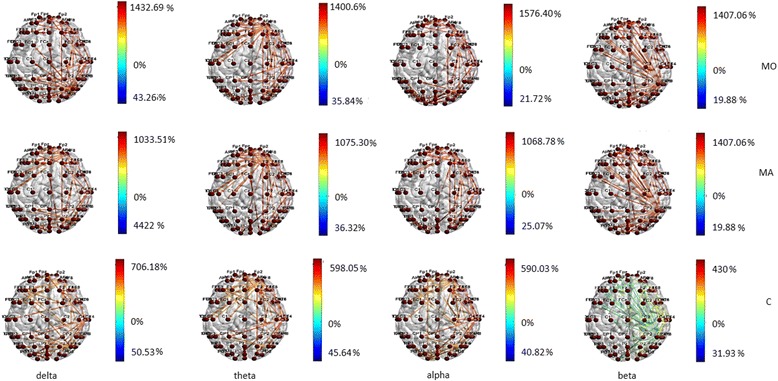
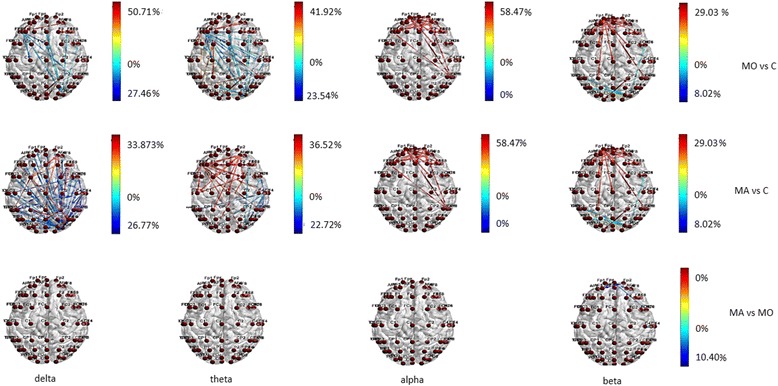
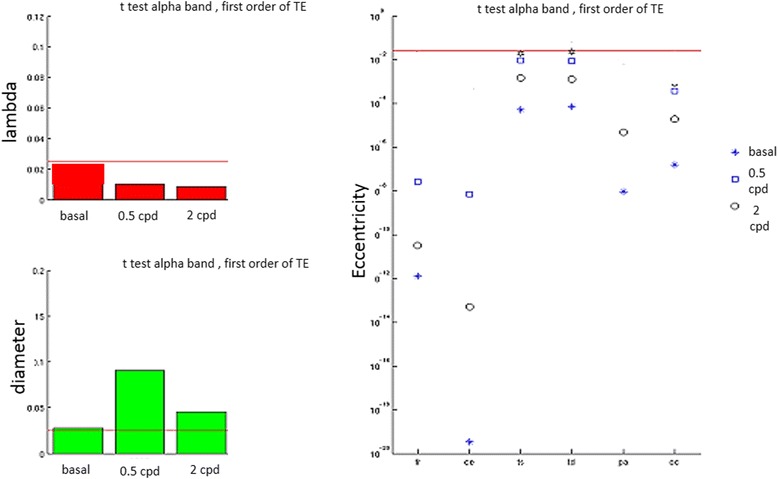
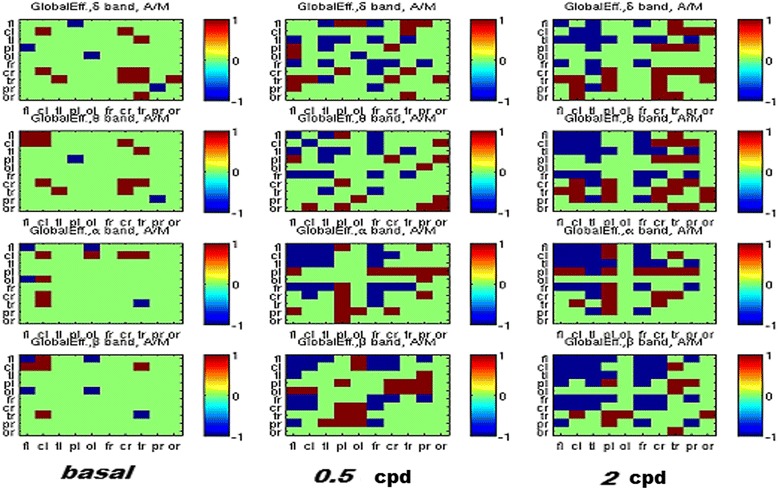
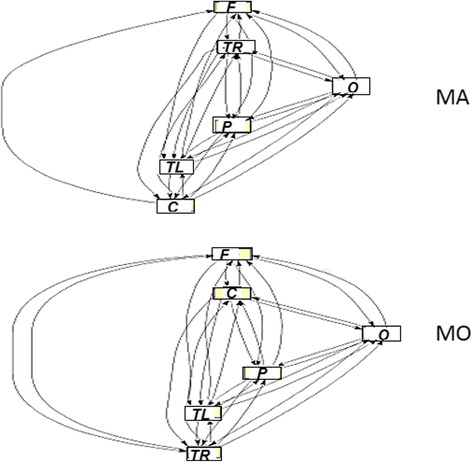
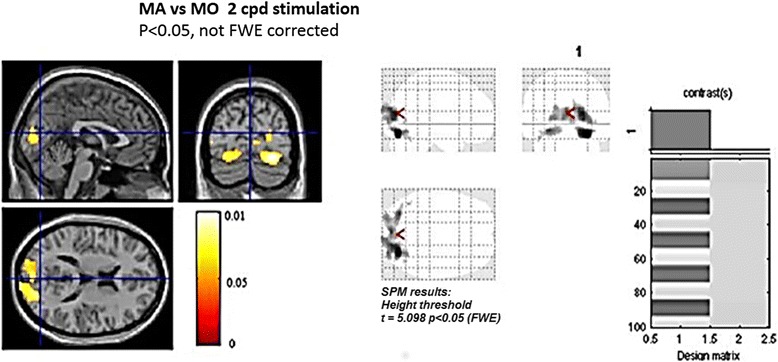
Results: A different pattern of reduced vs increased GC respectively in MO and MA patients, emerged in resting state. During visual stimulation, both MA and MO showed increased information transfer toward the fronto-central regions, while MA patients showed a segregated cluster of connections in the posterior regions, and an increased bold signal in the visual cortex, more evident at 2 cpd spatial frequency.

Conclusions: The wealth of information exchange in the parietal-occipital regions indicates a peculiar excitability of the visual cortex, a pivotal condition for the manifestation of typical aura symptoms.

Keywords: EEG; Granger causality; Migraine with Aura.


Conflict of interest statement

Competing interests

The authors declare that they have no competing interest.

Publisher’s Note

Springer Nature remains neutral with regard to jurisdictional claims in published maps and institutional affiliations.

Figures

Fig. 1
Fig. 1
Statistical differences in information transfer and their relative directions among nodes in resting state EEG bands are depicted in the Migraine with aura (MA), Migraine without aura (MO) and Controls (C) groups . Hot colors refer to a statistical prevalence of information transfer in the first element of the comparison, and cold colors for the vice-versa. The color intensity is graduated on the relative percent difference
Fig. 2
Fig. 2
Statistical differences in information transfer and their relative directions among nodes are depicted for the comparison of EEG bands under 0.5 cpd spatial frequency visual stimulation vs resting state condition in the Migraine with aura (MA), Migraine without aura (MO) and Controls (C) groups . Hot colors refer to a statistical prevalence of information transfer in the 0.5 cpd spatial frequency visual stimulation condition, cold colors for a prevalence in resting state. The color intensity is graduated on the relative percent difference. (further data on statistical analysis are available in the Additional file 1: section, chapter 5.6.1)
Fig. 3
Fig. 3
Statistical differences in information transfer and their relative directions among nodes during 0.5 cpd spetial frequency are depicted in the Migraine with aura (MA), Migraine without aura (MO) and Controls (C) groups . Hot colors refer to a statistical prevalence of information transfer in the first element of the comparison, and cold colors for the vice-versa. The color intensity is graduated on the relative percent difference. (further data on statistical analysis are available in the Additional file 1: section, chapter 5.6.1)
Fig. 4
Fig. 4
Statistical differences in information transfer and their relative directions among nodes are depicted for the comparison of EEG bands under 2 cpd spatial frequency visual stimulation vs resting state condition in the Migraine with aura (MA), Migraine without aura (MO) and Controls (C) groups . Hot colors refer to a statistical prevalence of information transfer in the 0.5 cpd spatial frequency visual stimulation condition, cold colors for a prevalence in resting state. The color intensity is graduated on the relative percent difference. (further data on statistical analysis are available in the Additional file 1: section, chapter 5.6.1)
Fig. 5
Fig. 5
Statistical differences in information transfer and their relative directions among nodes during 2 cpd spetial frequency are depicted in the Migraine with aura (MA), Migraine without aura (MO) and Controls (C) groups . Hot colors refer to a statistical prevalence of information transfer in the first element of the comparison, and cold colors for the vice-versa. The color intensity is graduated on the relative percent difference. (further data on statistical analysis are available in the Additional file 1: section, chapter 5.6.1)
Fig. 6
Fig. 6
ANOVA tests on Characteristic Path Length features of Migraine with Aura versus Migraine Without Aura. The first column shows the Student t-test on the “lambda” and “diameter” factors (which stem for the medium path length and its distribution) in basal condition and during 0.5 cpd and 2 cpd spatial frequency visual stimulation. The lambda is clearly smaller for MA, as one can argue observing the “eccentricity” (distribution of the minima, right column) at all the stimulations and for all cortical bands (alpha band is here represented). The red horizontal line stems for the t-test confidence level (Bonferroni corrected) under which the probability of having distinct population is relevant
Fig. 7
Fig. 7
Comparison of global efficiency in Migraine with aura (MA) and Migraine Without Aura populations: the matrix elements in red (+1) account for larger values in MWA, while those in blue (−1) account for larger values od MWoA. Green cells mean no distinction. (further data on analysis are available in the Additional file 1: section, chapter 5.6.2) The EEG electrodes were merged into 4 main scalp zones: fl, frontal, cl, central, tl, temporal, pl, parietal, ol, occipital
Fig. 8
Fig. 8
Network diagrams for Migraine with aura (MA) and without aura (MO) for alpha band at 2 cpd stimulation. The by-pass role of the occipital area (O) in the MA in the anterior / posterior connection emerges. (further data on analysis are available in the Supplementary section, chapter 5.6.2) F: Frontal; C: Central; P: Parietal; RT: Right Temporal; LT: Left Temporal
Fig. 9
Fig. 9
Statistical probability maps reporting the comparison of bold signal changes in migraine with aura vs migraine without aura sub groups during 2 cps spatial frequency visual stimulation

References

    1. Ayata C. Cortical spreading depression triggers migraine attack. Pro Headache. 2010;4:725–730. doi: 10.1111/j.1526-4610.2010.01647.x. - DOI - PubMed
    1. Hadjikhani N, Sanchez Del Rio M, Wu O, Schwartz D, Bakker D, Fischl B, et al. Mechanisms of migraine aura revealed by functional MRI in human visual cortex. Proc Natl Acad Sci U S A. 2001;98:4687–4692. doi: 10.1073/pnas.071582498. - DOI - PMC - PubMed
    1. Schoenen J. Neurophysiological features of the migrainous brain. Neurol Sci. 2006;27:S77–S81. doi: 10.1007/s10072-006-0575-1. - DOI - PubMed
    1. Genco D, de Tommaso N, Prudenzano AM, Savarese M, Puca FM. EEG features in juvenile migraine: topographic analysis of spontaneous and visual evoked brain electrical activity: a comparison with adult migraine. Cephalalgia. 1994;14:41–46. doi: 10.1046/j.1468-2982.1994.1401041.x. - DOI - PubMed
    1. Simon RH, Zimmerman AW, Tasman A, Hale MS. Spectral analysis of photic stimulation in migraine. Electroencephalogr Clin Neurophysiol. 1982;53:270–276. doi: 10.1016/0013-4694(82)90084-0. - DOI - PubMed

LinkOut - more resources