. 2017 Sep;88(9):094303.
doi: 10.1063/1.5001024.

Improved scatter correction with factor analysis for planar and SPECT imaging

Affiliations

Improved scatter correction with factor analysis for planar and SPECT imaging

Peter Knoll et al. Rev Sci Instrum. 2017 Sep.

Abstract

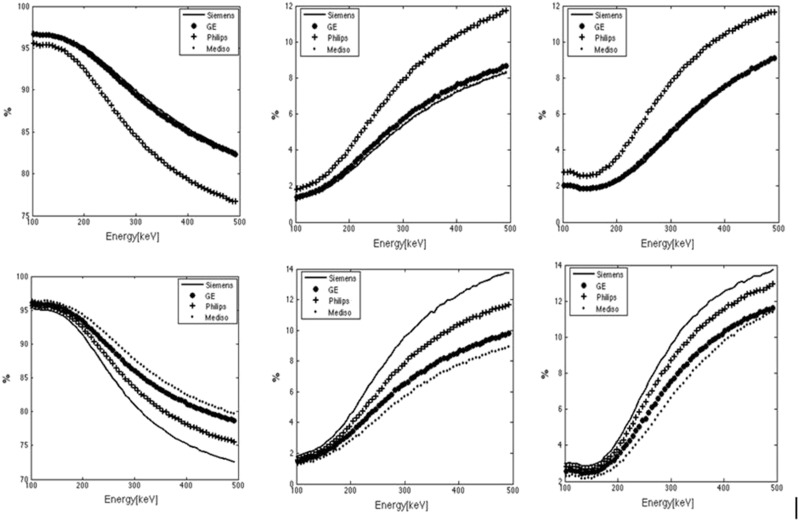
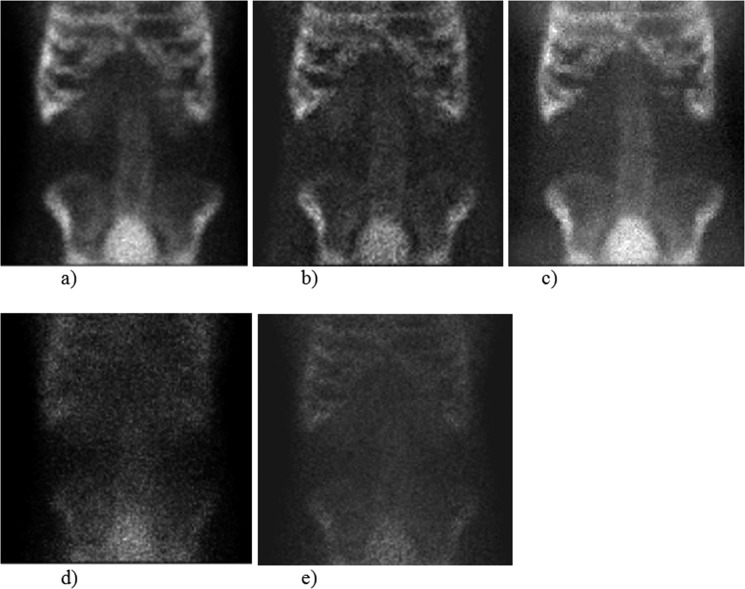
Quantitative nuclear medicine imaging is an increasingly important frontier. In order to achieve quantitative imaging, various interactions of photons with matter have to be modeled and compensated. Although correction for photon attenuation has been addressed by including x-ray CT scans (accurate), correction for Compton scatter remains an open issue. The inclusion of scattered photons within the energy window used for planar or SPECT data acquisition decreases the contrast of the image. While a number of methods for scatter correction have been proposed in the past, in this work, we propose and assess a novel, user-independent framework applying factor analysis (FA). Extensive Monte Carlo simulations for planar and tomographic imaging were performed using the SIMIND software. Furthermore, planar acquisition of two Petri dishes filled with 99mTc solutions and a Jaszczak phantom study (Data Spectrum Corporation, Durham, NC, USA) using a dual head gamma camera were performed. In order to use FA for scatter correction, we subdivided the applied energy window into a number of sub-windows, serving as input data. FA results in two factor images (photo-peak, scatter) and two corresponding factor curves (energy spectra). Planar and tomographic Jaszczak phantom gamma camera measurements were recorded. The tomographic data (simulations and measurements) were processed for each angular position resulting in a photo-peak and a scatter data set. The reconstructed transaxial slices of the Jaszczak phantom were quantified using an ImageJ plugin. The data obtained by FA showed good agreement with the energy spectra, photo-peak, and scatter images obtained in all Monte Carlo simulated data sets. For comparison, the standard dual-energy window (DEW) approach was additionally applied for scatter correction. FA in comparison with the DEW method results in significant improvements in image accuracy for both planar and tomographic data sets. FA can be used as a user-independent approach for scatter correction in nuclear medicine.


Figures

FIG. 1.
FIG. 1.
Schematic representation of the sub-energy windows used for scatter correction with FA.
FIG. 2.
FIG. 2.
MC simulations of a point source with different photon energies and a low-energy high-resolution collimator: (a) 100 keV, (b) 200 keV, (c) 300 keV, (d) 400 keV, (e) 500 keV.
FIG. 3.
FIG. 3.
Fractional contribution (%) of geometric (left), septal penetration (center), and scatter events for different collimator types: (top) low-energy general-purpose (LEGP) and (bottom) low-energy-high-resolution (LEHR), of different vendors (GE, Mediso, Philips, Siemens), varying the photon energy of a point source (100-500 keV).
FIG. 4.
FIG. 4.
MC simulation of a 10 × 10 × 10 mm 99mTc source applying 10% energy resolution: Comparison of MC simulated photo-peak and Compton data sets with the resulting factor images. (a) MC simulation: photo-peak, (b) FA: photo-peak, (c) MC simulation: Compton, (d) FA: Compton.
FIG. 5.
FIG. 5.
MC simulation of a 10 × 10 × 10 mm 99mTc source applying 10% energy resolution: Comparison of MC simulated spectral data with the factor curves.
FIG. 6.
FIG. 6.
MC simulation of a 99mTc MDP bone study using the voxel phantom: Comparison of MC simulated photo-peak and Compton region data sets with the resulting factor images. (a) MC simulation: photo-peak region, (b) FA: photo-peak region, (c) DEW method (d) MC simulation: Compton region, (e) FA: Compton region.
FIG. 7.
FIG. 7.
Comparison of the primary and scatter spectra from MC simulation and FA of the 99mTc MDP bone study.
FIG. 8.
FIG. 8.
SPECT reconstruction of a mathematical phantom. (a) MC simulation: photo-peak, (b) FA: photo-peak, (c) MC simulation: Compton, (d) FA: Compton.
FIG. 9.
FIG. 9.
Two Petri dishes filled with 99mTc. The true left to right ratio of activity of the Petri dish was 1.96. (a) Non-scatter correction, (b) FA method, (c) DEW method.
FIG. 10.
FIG. 10.
Representative transaxial slices of the Jaszczak phantom (a) Non-scatter correction, (b) FA method, (c) DEW method.

References

    1. Ritt P., Vija H., Hornegger J. et al., “Absolute quantification in SPECT,” Eur. J. Nucl. Med. Mol. Imaging 38, 69 (2011).10.1007/s00259-011-1770-8 - DOI - PubMed
    1. Bailey D. L. and Willowson K. P., “Quantitative SPECT/CT: SPECT joins PET as quantitative imaging modality,” Eur. J. Nucl. Med. Mol. Imaging 41, 17 (2014).10.1007/s00259-013-2542-4 - DOI - PubMed
    1. Patton J. A. and Turkington T. G., “SPECT/CT physical principles and attenuation correction,” J. Nucl. Med. Technol. 36, 1 (2008).10.2967/jnmt.107.046839 - DOI - PubMed
    1. Rahmim A. and Zaidi H., “PET versus SPECT: Strengths, limitations and challenges,” Nucl. Med. Commun. 29(3), 193 (2008).10.1097/mnm.0b013e3282f3a515 - DOI - PubMed
    1. Zaidi H. and Koral K. F., “Scatter correction strategies in emission tomography,” in Quantitative Analysis in Nuclear Medicine Imaging (Springer Verlag, New York, 2006).