. 2017 Sep 30;16(1):392.
doi: 10.1186/s12936-017-2034-2.

Measuring ex vivo drug susceptibility in Plasmodium vivax isolates from Cambodia

Affiliations

Measuring ex vivo drug susceptibility in Plasmodium vivax isolates from Cambodia

Suwanna Chaorattanakawee et al. Malar J. .

Abstract

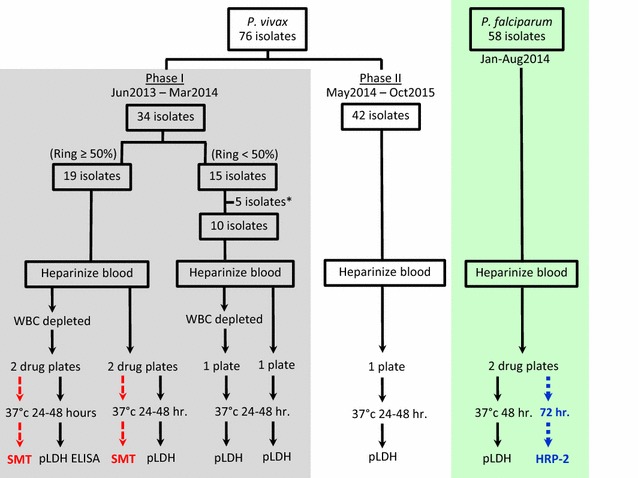
Background: While intensive Plasmodium falciparum multidrug resistance surveillance continues in Cambodia, relatively little is known about Plasmodium vivax drug resistance in Cambodia or elsewhere. To investigate P. vivax anti-malarial susceptibility in Cambodia, 76 fresh P. vivax isolates collected from Oddar Meanchey (northern Cambodia) in 2013-2015 were assessed for ex vivo drug susceptibility using the microscopy-based schizont maturation test (SMT) and a Plasmodium pan-species lactate dehydrogenase (pLDH) ELISA. P. vivax multidrug resistance gene 1 (pvmdr1) mutations, and copy number were analysed in a subset of isolates.

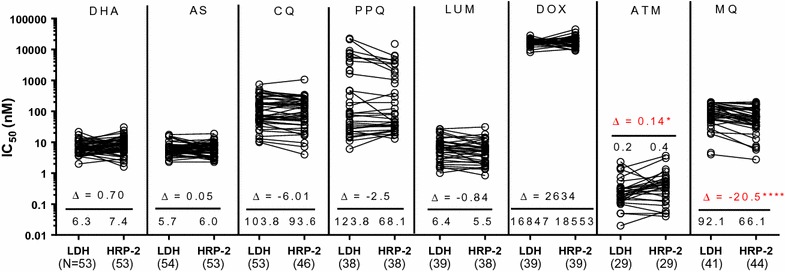
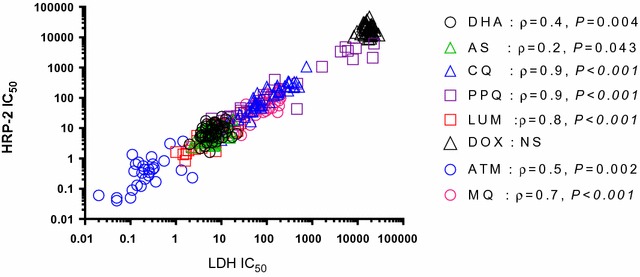
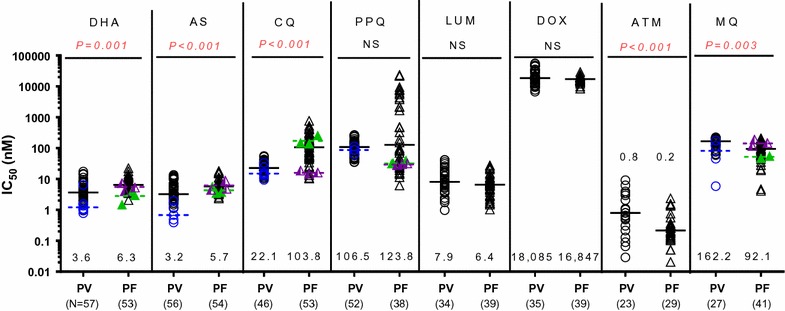
Results: Ex vivo testing was interpretable in 80% of isolates using the pLDH-ELISA, but only 25% with the SMT. Plasmodium vivax drug susceptibility by pLDH-ELISA was directly compared with 58 P. falciparum isolates collected from the same locations in 2013-4, tested by histidine-rich protein-2 ELISA. Median pLDH-ELISA IC50 of P. vivax isolates was significantly lower for dihydroartemisinin (3.4 vs 6.3 nM), artesunate (3.2 vs 5.7 nM), and chloroquine (22.1 vs 103.8 nM) than P. falciparum but higher for mefloquine (92 vs 66 nM). There were not significant differences for lumefantrine or doxycycline. Both P. vivax and P. falciparum had comparable median piperaquine IC50 (106.5 vs 123.8 nM), but some P. falciparum isolates were able to grow in much higher concentrations above the normal standard range used, attaining up to 100-fold greater IC50s than P. vivax. A high percentage of P. vivax isolates had pvmdr1 Y976F (78%) and F1076L (83%) mutations but none had pvmdr1 amplification.

Conclusion: The findings of high P. vivax IC50 to mefloquine and piperaquine, but not chloroquine, suggest significant drug pressure from drugs used to treat multidrug resistant P. falciparum in Cambodia. Plasmodium vivax isolates are frequently exposed to mefloquine and piperaquine due to mixed infections and the long elimination half-life of these drugs. Difficulty distinguishing infection due to relapsing hypnozoites versus blood-stage recrudescence complicates clinical detection of P. vivax resistance, while well-validated molecular markers of chloroquine resistance remain elusive. The pLDH assay may be a useful adjunctive tool for monitoring for emerging drug resistance, though more thorough validation is needed. Given high grade clinical chloroquine resistance observed recently in neighbouring countries, low chloroquine IC50 values seen here should not be interpreted as susceptibility in the absence of clinical data. Incorporating pLDH monitoring with therapeutic efficacy studies for individuals with P. vivax will help to further validate this field-expedient method.

Keywords: Cambodia; Drug resistance; Ex vivo assay; Plasmodium vivax; pvmdr1.


Figures

Fig. 1
Fig. 1
Schematic for ex vivo experiments. Plasmodium vivax ex vivo experiments were divided into 2 phases. In Phase I, the schizont maturation test (SMT) was performed concurrently with the pLDH ELISA. Blood samples were processed to deplete white blood cells, and incubated with drugs of interest in parallel with whole blood samples. The SMT was conducted only in samples with ≥ 50% ring stages. *5 isolates with ring stage < 50% in initial samples were not tested for drug susceptibility, but 3 of them had Percoll treatment applied to separate late stage parasites and enrich for early stages for the SMT. In phase II, only pLDH ELISA was performed on whole blood samples. For P. falciparum testing, pLDH ELISA was performed concurrently with the HRP-2 ELISA with 48 h incubation times used in the pLDH ELISA to ensure meaningful comparison of P. vivax susceptibility, while the previously established 72 h incubation was followed for the HRP-2 method
Fig. 2
Fig. 2
Comparison of P. falciparum IC50 values attained from pLDH and HRP-2 ELISA. Fresh P. falciparum isolates were tested for drug susceptibility using pLDH and HRP-2 ELISA, side by side. Median differences (Δ) are indicated below each pairwise comparison with values from the respective assays for each isolate joined by black lines. Unconnected dots are those where a corresponding value could not be obtained in either the pLDH or HRP-2 ELISA. Median IC50 and numbers of evaluable isolates from the respective assays appear above the X-axis, Significant P-values from the Wilcoxon pair test are indicated as *(P < 0.05), **(P < 0.01), ***(P < 0.001), ****(P < 0.0001)
Fig. 3
Fig. 3
Correlation between P. falciparum IC50 values attained from pLDH and HRP-2 ELISA. There were moderate to strong correlations between results obtained for P. falciparum isolates in the pLDH and HRP-2 ELISAs for all drug tested, with the exception of doxycyline. Significant P-values and correlation coefficients (ρ) from Spearman correlation test were indicated. NS indicates not significant based on a P-value ≥ 0.05
Fig. 4
Fig. 4
Ex vivo drug susceptibility of P. vivax and P. falciparum isolates collected from Oddar Meanchey Province (northern Cambodia) during 2013–2015. pLDH-ELISA IC50s of fresh P. vivax (PV) and P. falciparum (PF) isolates against commonly used anti-malarials are presented as black dot plots with black median bars, while SMT results for the only six evaluable PV isolates are indicated in blue. Circle represent PV isolates, while triangles represent PF. Median pLDH-ELISA IC50 and numbers of evaluable isolates appear above the X-axis, and the P-values for the Mann–Whitney test comparing IC50s of P. vivax and P. falciparum appear at the top of the graph. NS indicates not significant based on a P-value ≥ 0.05. pLDH-ELISA IC50 of W2 (green) and 3D7 (purple) reference clones obtained from three independent assays are presented in scatter dot plot with bars representing averages

References

    1. Wongsrichanalai C, Pickard AL, Wernsdorfer WH, Meshnick SR. Epidemiology of drug-resistant malaria. Lancet Infect Dis. 2002;2:209–218. doi: 10.1016/S1473-3099(02)00239-6. - DOI - PubMed
    1. Wongsrichanalai C, Sirichaisinthop J, Karwacki JJ, Congpuong K, Miller RS, Pang L, et al. Drug resistant malaria on the Thai-Myanmar and Thai-Cambodian borders. Southeast Asian J Trop Med Public Health. 2001;32:41–49. - PubMed
    1. Wernsdorfer WH, Payne D. The dynamics of drug resistance in Plasmodium falciparum. Pharmacol Ther. 1991;50:95–121. doi: 10.1016/0163-7258(91)90074-V. - DOI - PubMed
    1. Bjorkman A, Phillips-Howard PA. The epidemiology of drug-resistant malaria. Trans R Soc Trop Med Hyg. 1990;84:177–180. doi: 10.1016/0035-9203(90)90246-B. - DOI - PubMed
    1. Dondorp AM, Nosten F, Yi P, Das D, Phyo AP, Tarning J, et al. Artemisinin resistance in Plasmodium falciparum malaria. N Engl J Med. 2009;361:455–467. doi: 10.1056/NEJMoa0808859. - DOI - PMC - PubMed

Publication types

MeSH terms

Substances

LinkOut - more resources