. 2018 Feb;125(2):255-266.
doi: 10.1016/j.ophtha.2017.08.030. Epub 2017 Sep 28.

Natural History of Subclinical Neovascularization in Nonexudative Age-Related Macular Degeneration Using Swept-Source OCT Angiography

Affiliations

Natural History of Subclinical Neovascularization in Nonexudative Age-Related Macular Degeneration Using Swept-Source OCT Angiography

João R de Oliveira Dias et al. Ophthalmology. 2018 Feb.

Abstract

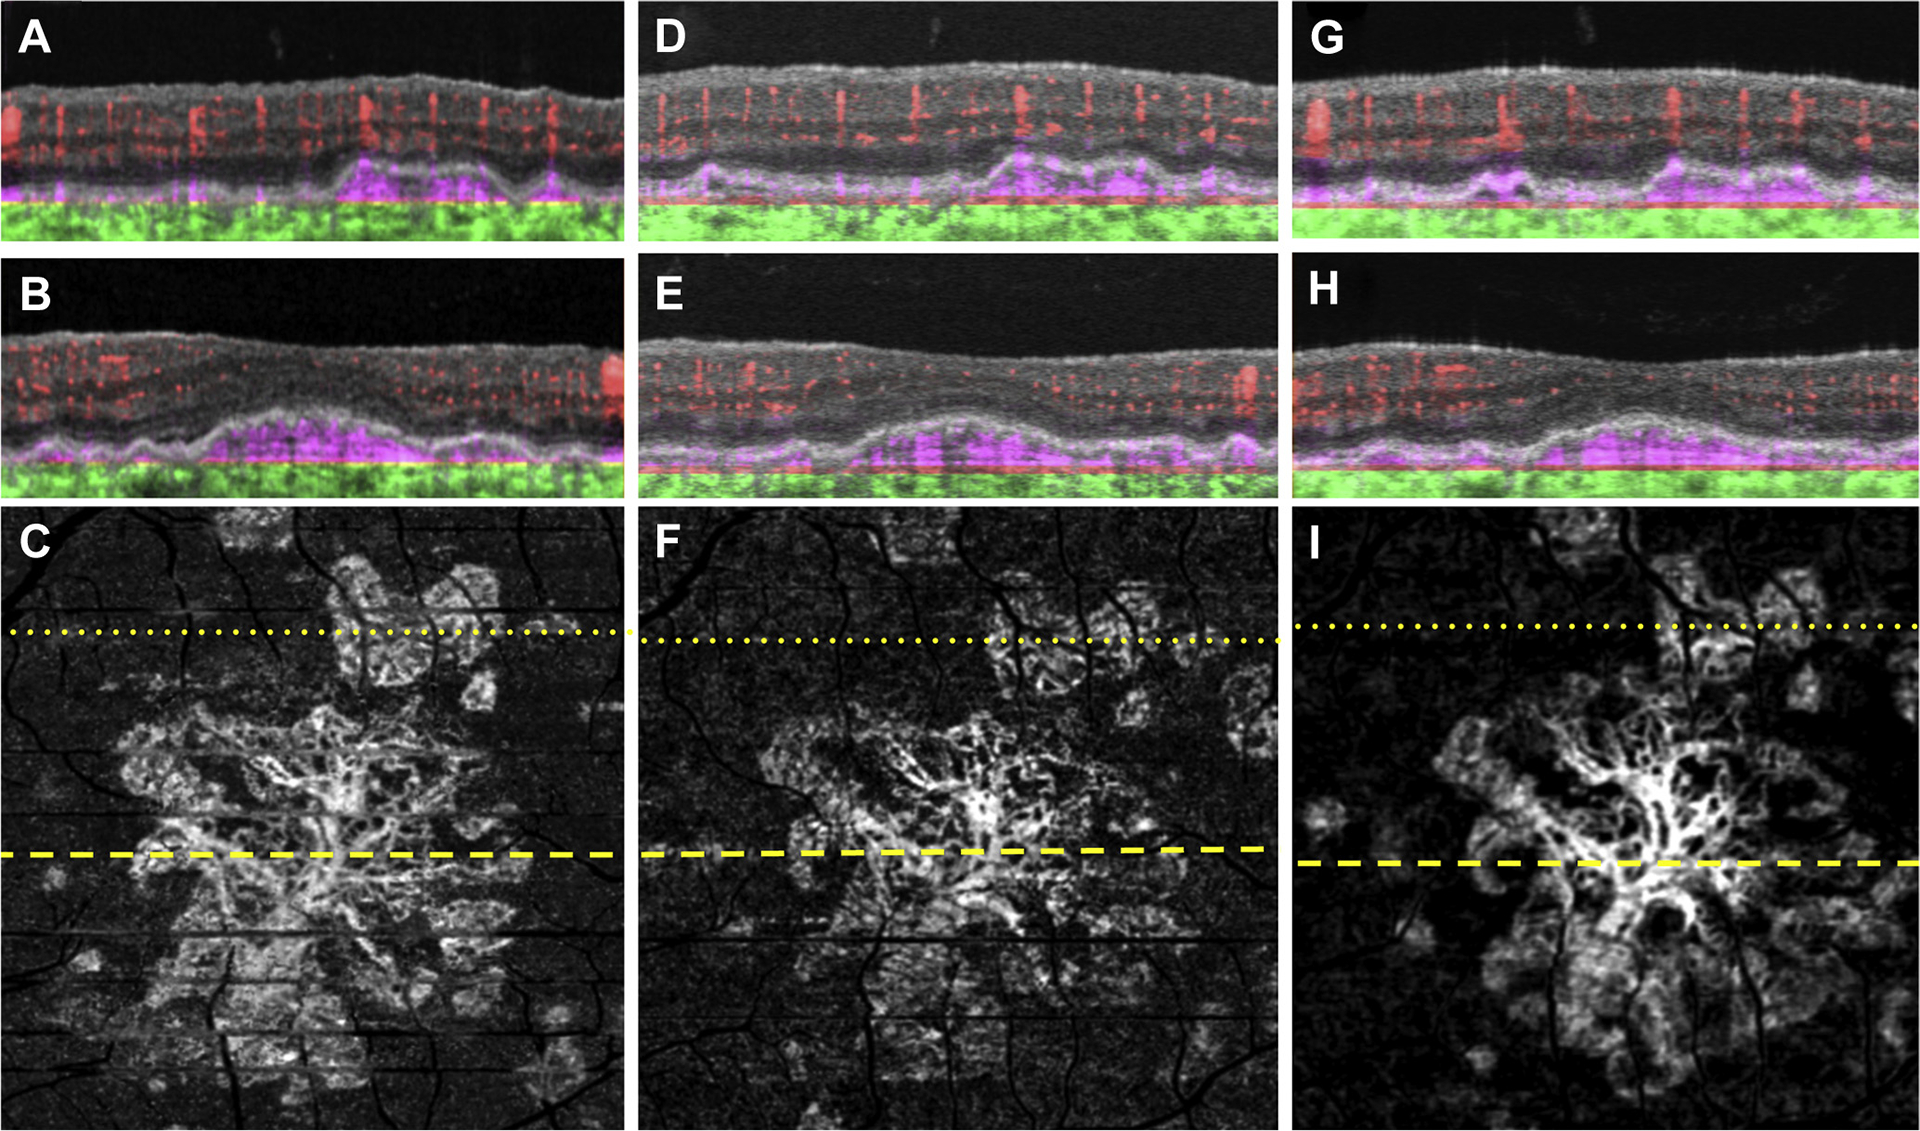
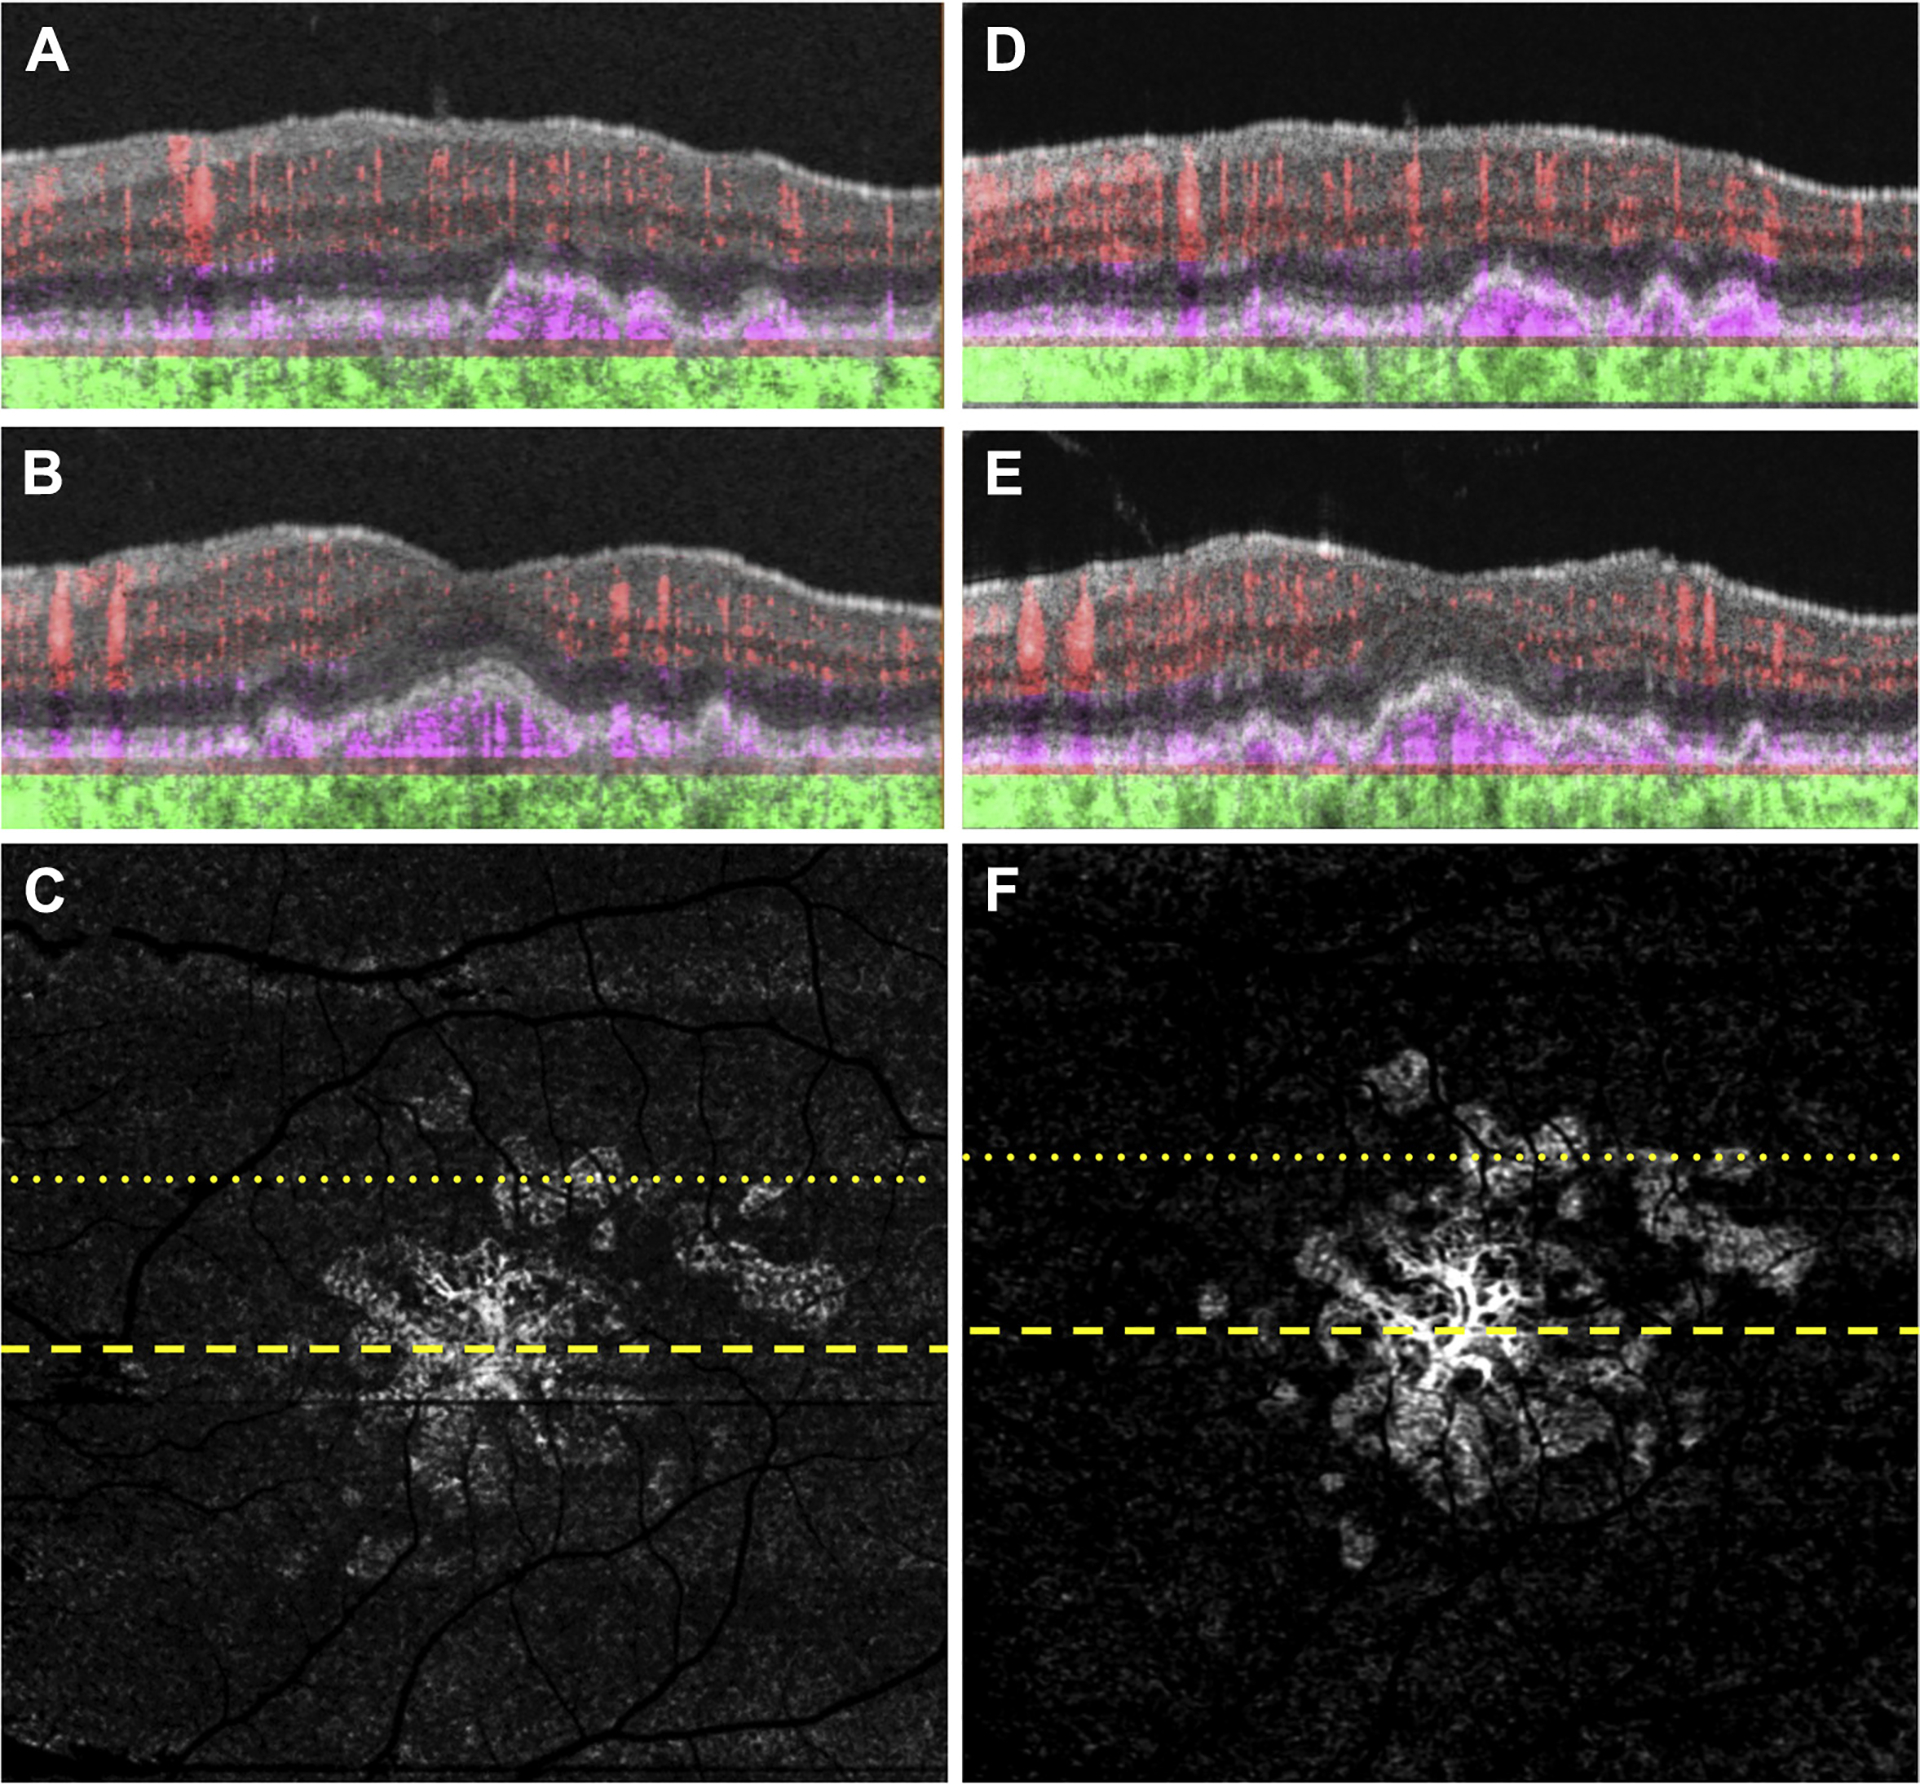
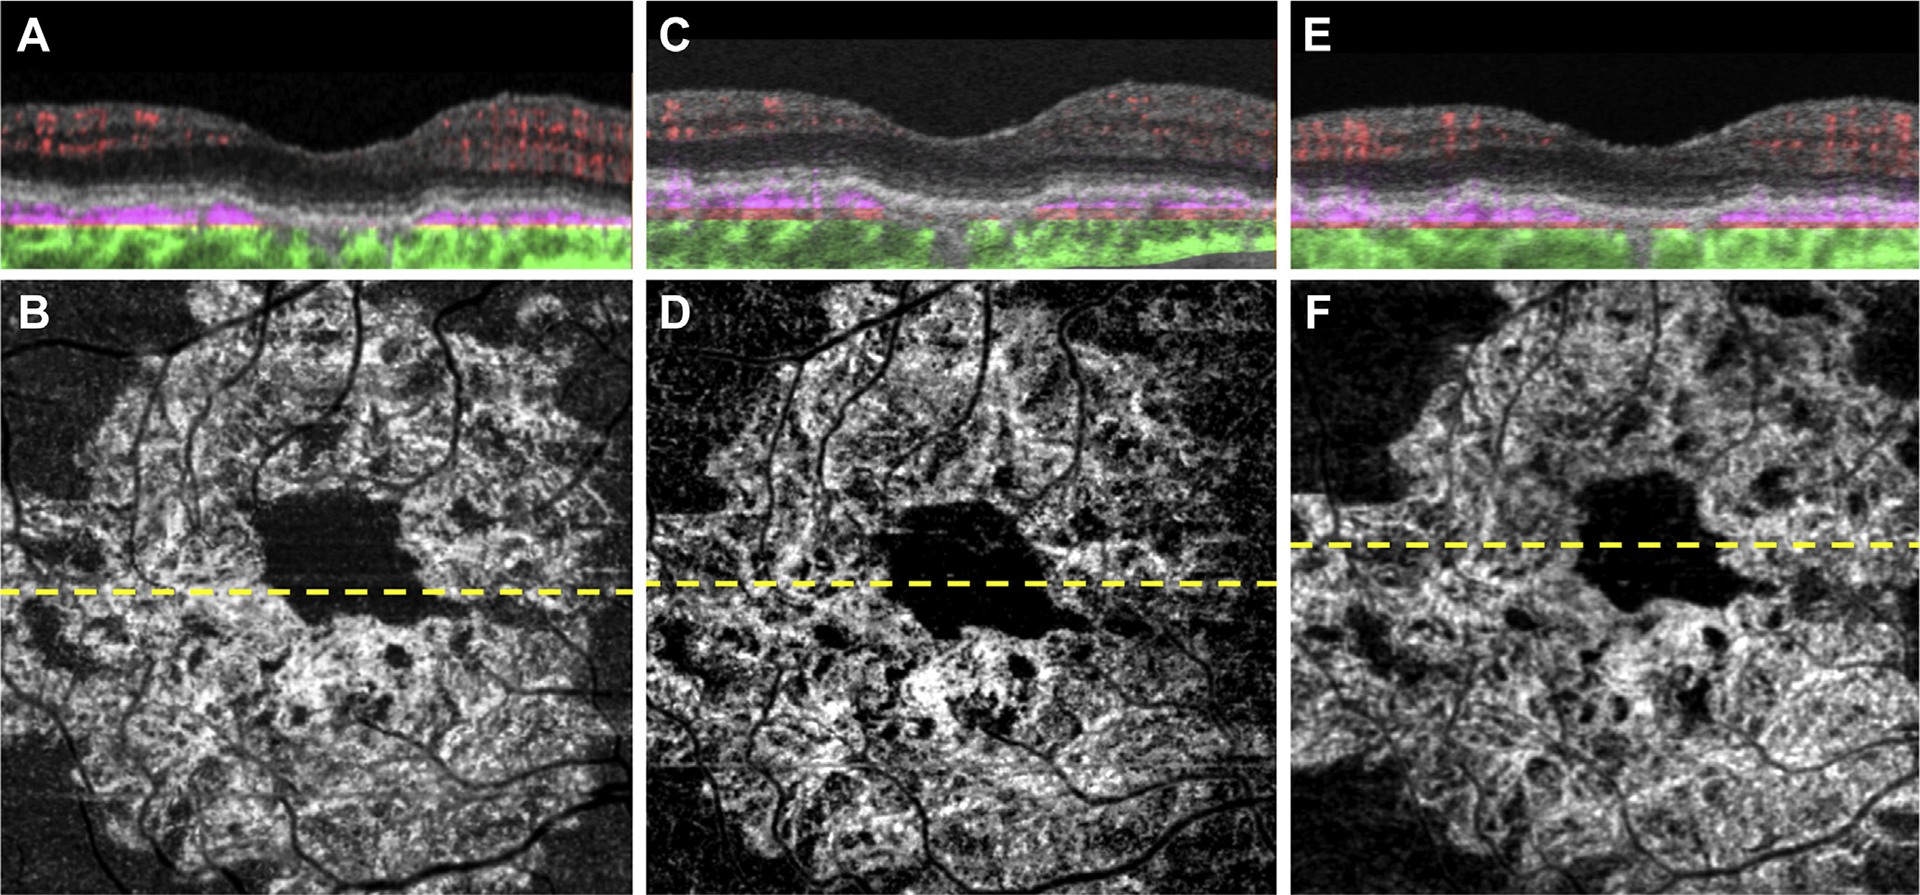
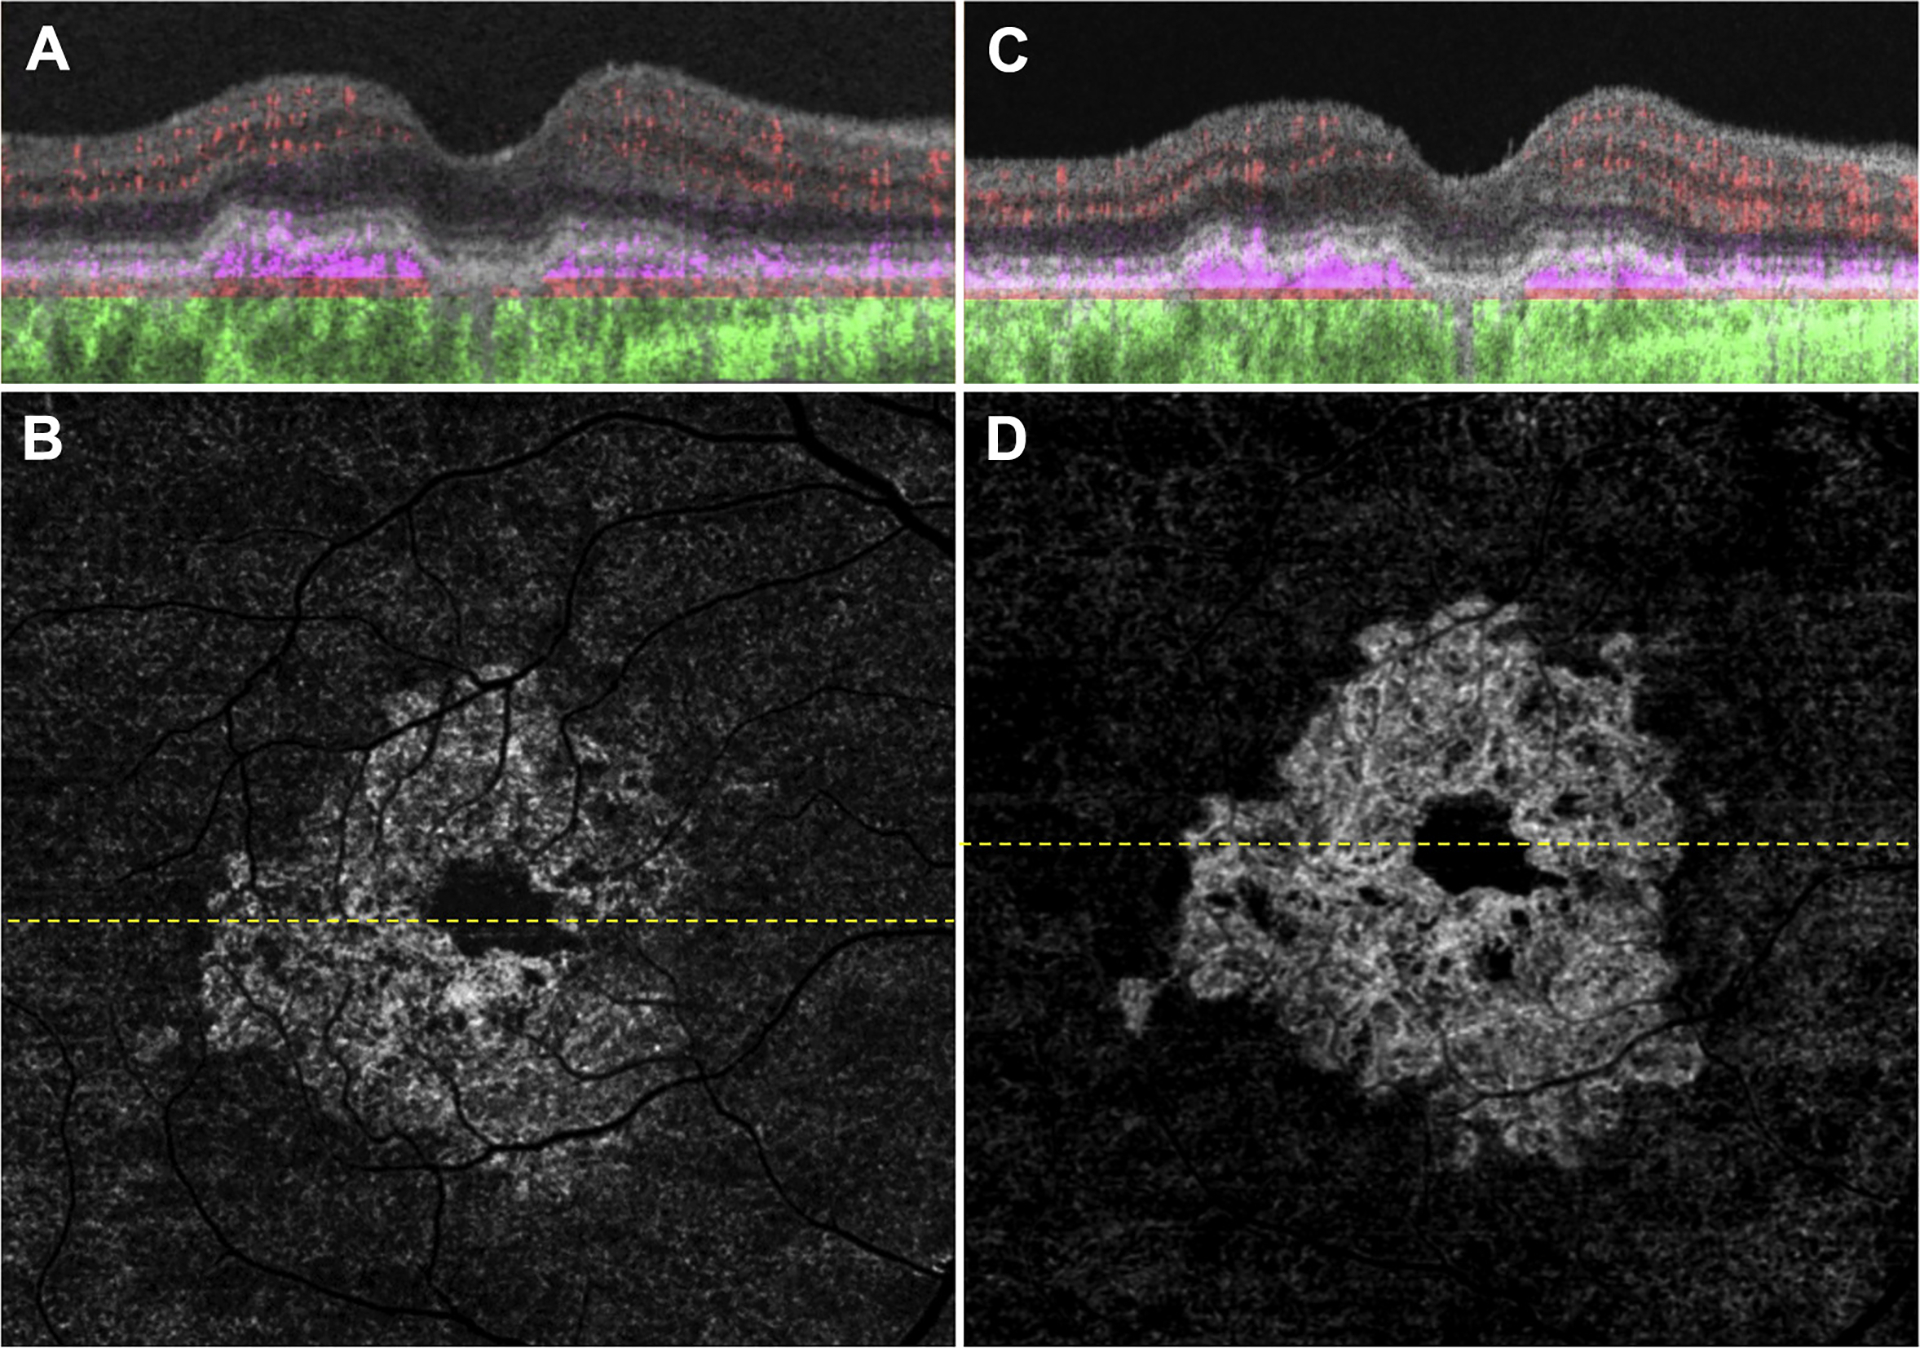
Purpose: Swept-source (SS) OCT angiography (OCTA) was used to determine the prevalence, incidence, and natural history of subclinical macular neovascularization (MNV) in eyes with nonexudative age-related macular degeneration (AMD).

Design: Prospective, observational, consecutive case series.

Participants: Patients with intermediate AMD (iAMD) or geographic atrophy (GA) secondary to nonexudative AMD in 1 eye and exudative AMD in the fellow eye.

Methods: All patients were imaged using both the 3×3 mm and 6×6 mm SS OCTA fields of view (PLEX Elite 9000; Carl Zeiss Meditec, Inc, Dublin, CA). The en face slab used to detect the MNV extended from the outer retina to the choriocapillaris, and projection artifacts were removed using a proprietary algorithm.

Main outcome measures: Prevalence of subclinical MNV and time to exudation with Kaplan-Meier cumulative estimates of exudation at 1 year.

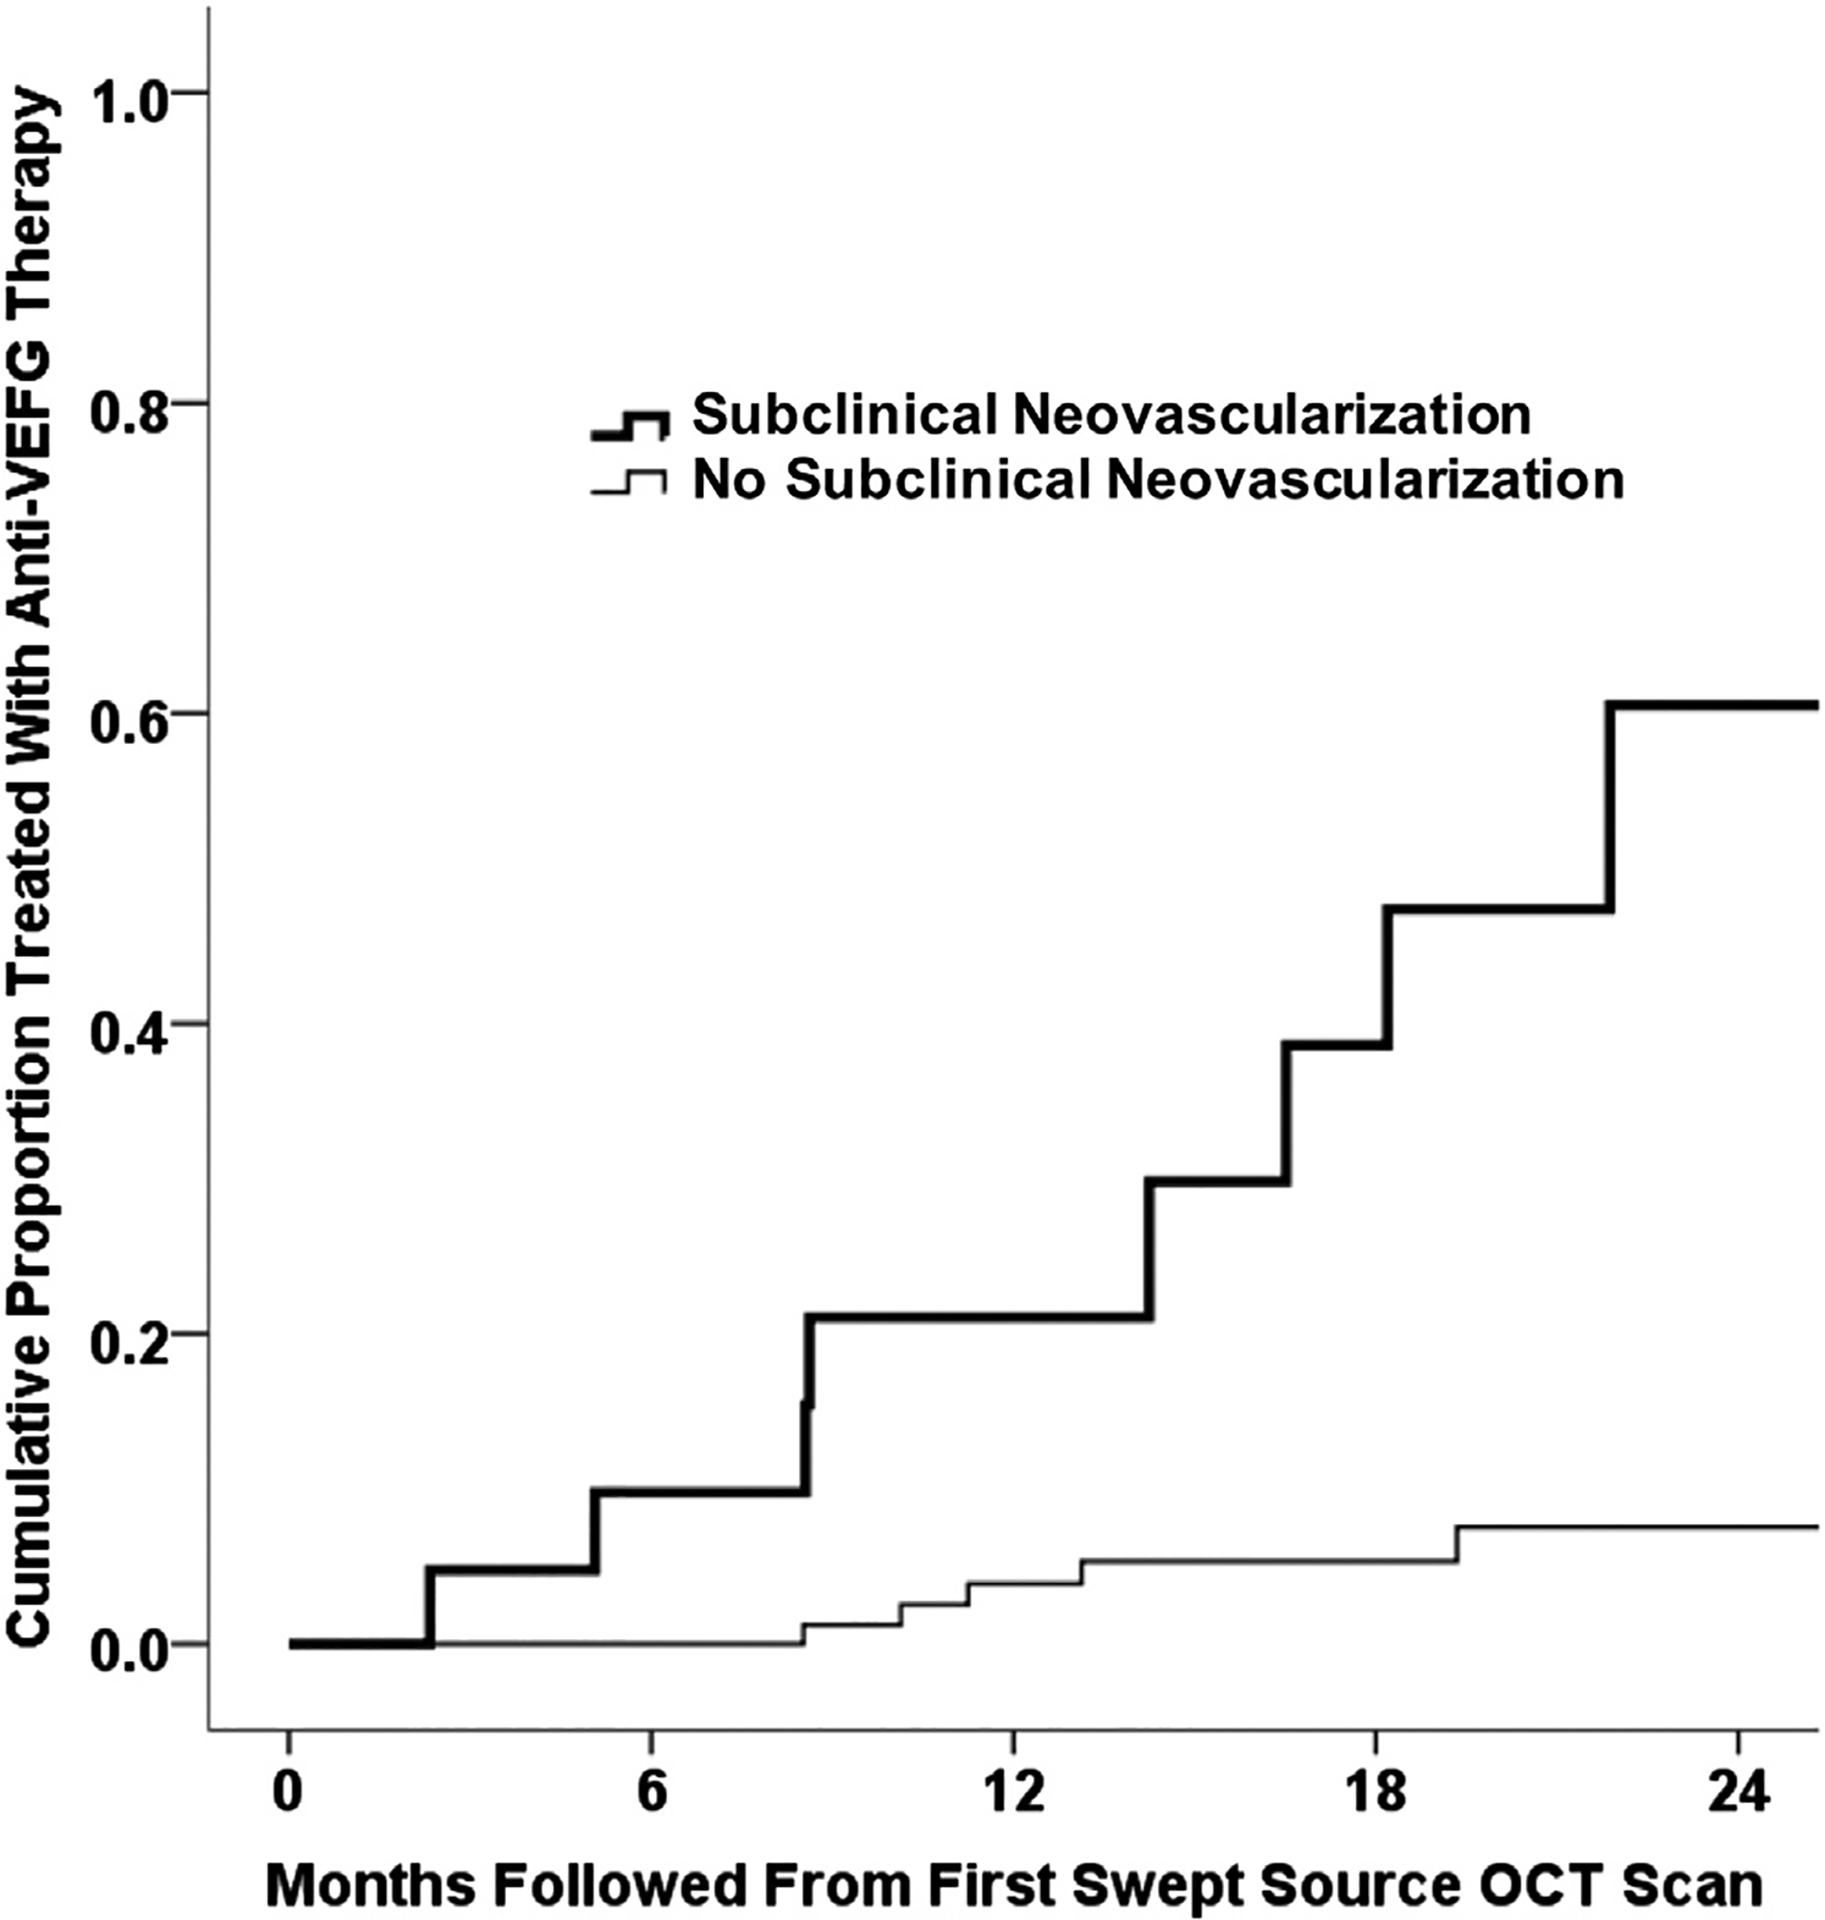
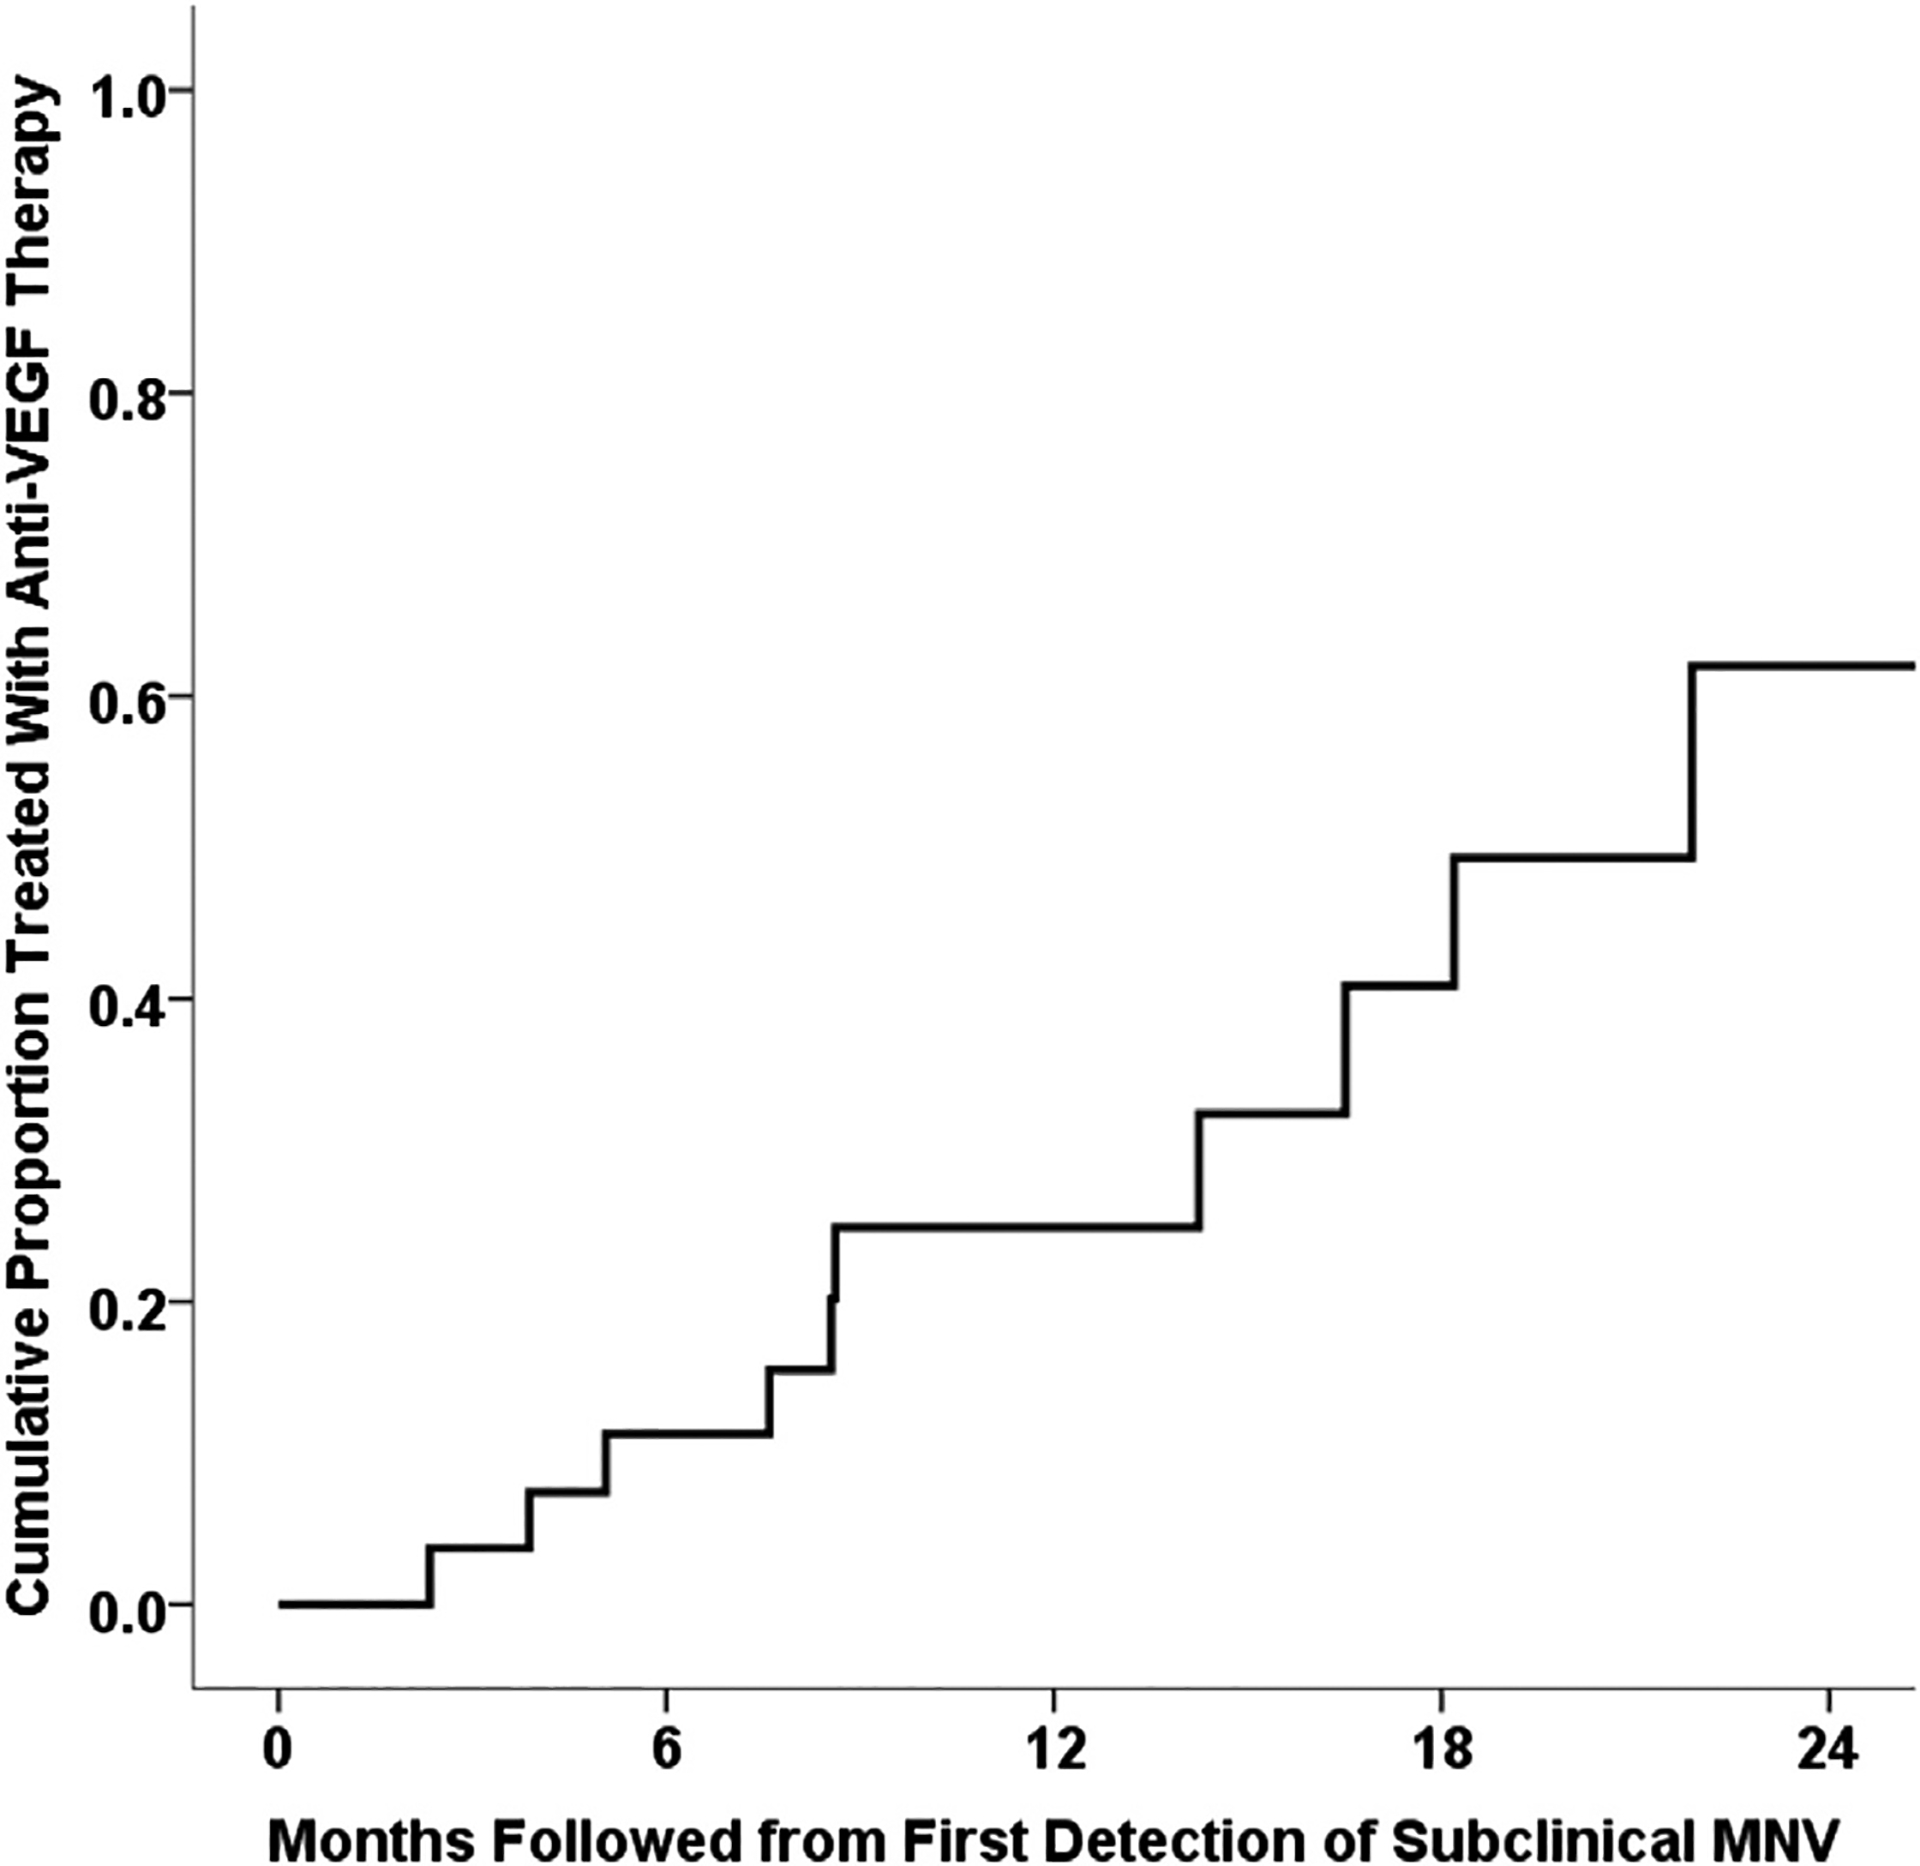
Results: From August 2014 through March 2017, 160 patients underwent SS OCTA (110 eyes with iAMD and 50 eyes with GA). Swept-source OCTA identified subclinical MNV at the time of first imaging in 23 of 160 eyes, for a prevalence of 14.4%. Six eyes demonstrated subclinical MNV during the follow-up. Of 134 eyes with follow-up visits, a total of 13 eyes demonstrated exudation, and of these 13 eyes, 10 eyes were found to have pre-existing subclinical MNV. By 12 months, the Kaplan-Meier cumulative incidence of exudation for all 134 eyes was 6.8%. For eyes with subclinical MNV at the time of first SS OCTA imaging, the incidence was 21.1%, and for eyes without subclinical MNV, the incidence was 3.6%. There was no difference in the cumulative incidence of exudation from pre-existing MNV in eyes with iAMD or GA (P = 0.847, log-rank test). After the detection of subclinical MNV, the risk of exudation was 15.2 times (95% confidence interval, 4.2-55.4) greater compared with eyes without subclinical MNV.

Conclusions: By 12 months, the risk of exudation was greater for eyes with documented subclinical MNV compared with eyes without detectable MNV. For eyes with subclinical MNV, recommendations include more frequent follow-up and home monitoring. Intravitreal therapy is not recommended until prospective studies are performed.


Figures

Figure 1.
Figure 1.
Swept-source OCT angiography (OCTA; 3×3 mm) of an asymptomatic eye from a patient with nonexudative age-related macular degeneration followed up for 18 months without exudation. A, B, Optical coherence tomography B-scan (A) superior to the fovea and (B) through the fovea with colorcoded flow represented as red for the retinal microvasculature, pink for the outer retina-to-choriocapillaris (ORCC) slab, and green for the remainder of the choroid. Note the pink coloration under the retinal pigment epithelium and above Bruch’s membrane, which represents the type 1 macular neovascularization. C, Swept-source OCTA en face ORCC slab image with removal of retinal vessel projection artifacts showing a multilobular and multifocal neovascular complex that extends to the boundaries of scan area. The dotted and dashed lines represent the B-scans contained in (A) and (B), respectively. D, E, Images obtained 4 months after those in (AC): OCT B-scans with color-coded flow (D) superior to the fovea and (E) through the fovea. F, Swept-source OCTA en face ORCC slab image with removal of retinal vessel projection artifacts. The dotted and dashed lines represent the B-scans contained in (D) and (E), respectively. G, H, Images obtained 14 months after those in (DF): OCT B-scans with color-coded flow (G) superior to the fovea and (H) through the fovea. I, Swept-source OCTA en face ORCC slab image with removal of retinal vessel projection artifacts. The dotted and dashed lines represent the B-scans contained in (G) and (H), respectively.
Figure 2.
Figure 2.
Swept-source (SS) OCT angiography (OCTA) of the same eye as in Figure 1 imaged using a 6×6 mm scan. A, B, Optical coherence tomography B-scan (A) superior to the fovea and (B) through the fovea with color-coded flow represented as red for the retinal microvasculature, pink for the outer retina-to-choriocapillaris (ORCC) slab, and green for the remainder of the choroid. Note the pink coloration under the retinal pigment epithelium and above Bruch’s membrane, which represents the type 1 macular neovascularization. C, Swept-source OCTA en face ORCC slab image with removal of retinal vessel projection artifacts showing macular neovascularization that is multilobular and multifocal with a total area of 4.70 mm2 as determined by using an automated quantification algorithm that was described previously. The dotted and dashed lines represent the B-scans contained in (A) and (B), respectively. The 6×6 mm scans could not be performed by the prototype SS OCTA instrument before this visit. D, E, Images obtained 14 months after those in (AC): OCT B-scans with color-coded flow (D) superior to the fovea and (E) through the fovea. F, Swept-source OCTA en face ORCC slab image with removal of retinal vessel projection artifacts showing a neovascular lesion with an area of 5.11 mm2. The dotted and dashed lines represent the B-scans contained in (D) and (E), respectively.
Figure 3.
Figure 3.
Swept-source OCT angiography (OCTA; 3×3 mm) of an asymptomatic eye from a patient with nonexudative age-related macular degeneration followed up for 17 months without exudation. A, Optical coherence tomography B-scan through the fovea with color-coded flow represented as red for the retinal microvasculature, pink for the outer retina-to-choriocapillaris (ORCC) slab, and green for the remainder of the choroid. Note the pink coloration under the retinal pigment epithelium and above Bruch’s membrane, which represents the type 1 macular neovascularization. B, Swept-source OCTA en face ORCC slab image with removal of retinal vessel projection artifacts showing a wreath-shaped neovascular complex that extends to the boundaries of scan area. The dashed line represents the B-scan contained in (A). C, D: Images obtained 3 months after those in (A, B). C, OCT B-scan with color-coded flow through the fovea. D, Swept-source OCTA en face ORCC slab image with removal of retinal vessel projection artifacts. The dashed line represents the B-scan contained in (C). E, F: Images obtained 14 months after those in (C, D). E, OCT B-scan with color-coded flow through the fovea. F, Swept-source OCTA en face ORCC slab image with removal of retinal vessel projection artifacts. The dashed line represents the B-scan contained in (E).
Figure 4.
Figure 4.
Swept-source OCT angiography (OCTA) of the same eye as in Figure 3 imaged using a 6×6 mm scan. A, Optical coherence tomography B-scan through the fovea with color-coded flow represented as red for the retinal microvasculature, pink for the outer retina-to-choriocapillaris (ORCC) slab, and green for the remainder of the choroid. Note the pink coloration under the retinal pigment epithelium and above Bruch’s membrane, which represents the type 1 macular neovascularization. B, Swept-source OCTA en face ORCC slab image with removal of retinal vessel projection artifacts showing a wreath-shaped neovascular complex with a total area of 7.10 mm2. The dashed line represents the B-scan contained in (A). The 6×6 mm scans could not be performed by the prototype SS OCTA instrument before this visit. C, D: Images obtained 14 months after those in (A, B). C, OCT B-scan with color-coded flow through the fovea. D, Swept-source OCTA en face ORCC slab image with removal of retinal vessel projection artifacts showing a neovascular lesion with an area of 7.39 mm2. The dashed line represents the B-scan contained in (C).
Figure 5.
Figure 5.
Swept-source (SS) OCT angiography (OCTA; 3×3 mm) of an asymptomatic eye from a patient with nonexudative age-related macular degeneration in whom exudation developed requiring aflibercept therapy after 24 months of observation. A, Optical coherence tomography B-scan through the fovea with color-coded flow represented as red for the retinal microvasculature, pink for the outer retina-to-choriocapillaris (ORCC) slab, and green for the remainder of the choroid. Note the pink coloration under the retinal pigment epithelium and above Bruch’s membrane, which represents the type 1 macular neovascularization. B, Swept source OCTA en face ORCC slab image with removal of retinal vessel projection artifacts showing a multilobular neovascular complex with a total area of 1.21 mm2. The dashed line represents the B-scan contained in (A). C, D: Images obtained 21 months after those in (A, B). C, OCT B-scan with color-coded flow through the fovea. D, Swept-source OCTA en face ORCC slab image with removal of retinal vessel projection artifacts showing a neovascular lesion with an area of 2.44 mm2. The dashed line represents the B-scan contained in (C). E, F: Images obtained 2 months after those in (C, D). E, OCT B-scan with color-coded flow through the fovea showing new onset subretinal fluid (arrow). F, Swept-source OCTA en face ORCC slab image with removal of retinal vessel projection artifacts showing a neovascular lesion with an area of 2.53 mm2. The dashed line represents the B-scan contained in (E). G, H: Images obtained 1 month after those in (E, F). G, OCT B-scan with color-coded flow through the fovea showing an increase in the amount of subretinal fluid (arrow). H, Swept-source OCTA en face ORCC slab image with removal of retinal vessel projection artifacts showing a neovascular lesion with an increase in the neovascular lesion area to 2.75 mm2. The dashed line represents the B-scan contained in (G). The patient was symptomatic at this visit and intravitreal aflibercept was injected.
Figure 6.
Figure 6.
Swept-source OCT angiography (OCTA; 3×3 mm) of an asymptomatic eye from a patient with nonexudative age-related macular degeneration that demonstrated exudation from type 3 macular neovascularization (MNV). A, Optical coherence tomography B-scan through the fovea with color-coded flow represented as red for the retinal microvasculature, pink for the outer retina-to-choriocapillaris (ORCC) slab, and green for the remainder of the choroid. Note the enlarging areas of pink coloration within the retina, which correspond to the enlarging type 3 MNV. B, Swept-source OCTA en face ORCC slab image showing the retinal vessel projection artifacts and a focal area of flow (circle) that resides within the retina. C, The same en face flow image shown in (B) after removal of the retinal vessel projection artifacts. The circle identifies the type 3 MNV. DF, Images obtained 3 months after those in (AC). D: OCT B-scan with color-coded flow through the fovea. Note the enlarging area of pink corresponding to the type 3 MNV. E, Swept-source OCTA en face ORCC slab image showing the retinal vessel projection artifacts and a brighter area of flow (circle) that resides within the retina. F, The same en face image shown in (E) after removal of retinal vessel projection artifacts. The circle identifies the enlarging type 3 MNV. GI, Images obtained 1 month after the images shown in (DF). G, OCT B-scan with color-coded flow through the fovea showing the type 3 MNV and intraretinal fluid. H, Swept-source OCTA en face ORCC slab image showing the retinal vessel projection artifacts and an area of flow (circle) that resides within the retina. I, The same image shown in (H) after removal of the retinal vessel projection artifacts. The circle identifies the type 3 MNV. JL, Images obtained 7 months after the images shown in (GI). J, OCT B-scan with color-coded flow through the fovea showing the type 3 MNV with an increase in the amount of intraretinal fluid. K, Swept-source OCTA en face ORCC slab image showing the retinal vessel projection artifacts and an area of flow (circle) that resides within the retina. L, The same image shown in (K) after removal of the retinal vessel projection artifacts. The circle identifies the type 3 MNV. MO, Images obtained 10 weeks after the images shown in (JL) after 2 intravitreal injections of anti-vascular endothelial growth factor therapy. M, OCT B-scan with color-coded flow through the fovea no longer shows flow associated with the type 3 MNV. N, Swept-source OCTA en face ORCC slab image showing the retinal vessel projection artifacts. The area of flow previously associated with the type 3 MNV is no longer detectable. O, The same image shown in (N) after removal of the retinal vessel projection artifacts. The area of flow previous associated with the type 3 MNV is no longer detectable.
Figure 7.
Figure 7.
Swept-source OCT angiography (OCTA; 3×3 mm) of an asymptomatic eye from a patient with nonexudative age-related macular degeneration in which exudation from 1 of 3 neovascular foci developed after 18 months of observation. (AC) Optical coherence tomography B-scans (A) superior to the fovea and (B, C) through the parafoveal region with color-coded flow represented as red for the retinal microvasculature, pink for the outer retina to choriocapillaris (ORCC) slab, and green for the remainder of the choroid. Note the pink coloration under the retinal pigment epithelium and above Bruch’s membrane, which represents type 1 macular neovascularization (MNV). D, Swept-source OCTA en face ORCC slab image with removal of retinal vessel projection artifacts showing MNV with a total area of 0.08 mm2 (arrow). The dotted line represents the B-scan contained (A), and the dashed line represents the B-scan contained in (C). EH, Images obtained 13 months after those in (AD). OCT B-scans with color-coded flow (E) superior to the fovea and (F, G) through the parafoveal region. H, Swept-source OCTA en face ORCC slab image with removal of retinal vessel projection artifacts showing the MNV with a total area of 0.30 mm2. The dotted line represents the B-scan contained in (E), and the first and second dashed lines represent the B-scans contained in (F, G), respectively. IL, Images obtained 5 months after those in (EH). OCT B-scans with color-coded flow (I) superior to the fovea and (J, K) through the parafoveal region. Only 1 of the neovascular foci appears to be associated with new onset exudation (K, arrow). L, Swept-source OCTA en face ORCC slab image with removal of retinal vessel projection artifacts showing the MNV with a total area of 1.24 mm2. The dotted line represents the B-scan contained in (I), and the first and second dashed lines represent the B-scans contained in (J, K), respectively. MP, Images obtained 2 months after those in (IL) after 2 intravitreal injections of anti-vascular endothelial growth factor (VEGF) therapy. OCT B-scans with color-coded flow (M) superior to the fovea and (N, O) through the parafoveal region. The exudation seen previously has resolved. P, Swept-source OCTA en face ORCC slab image with removal of retinal vessel projection artifacts showing the MNV with a total area of 1.21 mm2. The dotted line represents the B-scan contained in (M), and the first and second dashed lines represent the B-scans contained in (N, O), respectively. After anti-VEGF therapy, no significant change in the configuration of the MNV can be appreciated.
Figure 8.
Figure 8.
Swept-source OCT angiography (OCTA; 3×3 mm) of an asymptomatic eye from a patient with nonexudative age-related macular degeneration without evidence of subclinical macular neovascularization (MNV) in which exudation developed associated with subretinal hyperreflective material (SHRM). A, Optical coherence tomography B-scan superior to the fovea with color-coded flow represented as red for the retinal microvasculature, pink for the outer retina to choriocapillaris (ORCC) slab, and green for the remainder of the choroid. The arrow corresponds to a druse that was not associated with a flow signal. B, Swept-source OCTA en face ORCC slab image with removal of retinal vessel projection artifacts. No obvious flow signal can be identified. The dashed line represents the B-scan contained in (A). C, D: Images obtained 2 months after those in (A, B). C, OCT B-scan with color-coded flow superior to the fovea shows a neovascular lesion that is associated with subretinal fluid and SHRM (arrow). D, Swept-source OCTA en face ORCC slab image with removal of retinal vessel projection artifacts showing evidence of the MNV. The dashed line represents the B-scan contained in (C). E, F: Images obtained 3 months after those in (C, D) after 3 intravitreal injections of anti-vascular endothelial growth factor (VEGF) therapy. E, OCT B-scan with color-coded flow superior to the fovea. The neovascular lesion resides under the retinal pigment epithelium and persists as a type 1 neovascular lesion. F, Swept-source OCTA en face ORCC slab image with removal of retinal vessel projection artifacts showing the MNV that appears smaller after anti-VEGF therapy. The dashed line represents the B-scan contained in (E).
Figure 9.
Figure 9.
Kaplan-Meier analysis showing the cumulative proportion of eyes treated with anti–vascular endothelial growth factor (VEGF) therapy from the time of the first swept-source (SS) OCT angiography (OCTA) scan. For eyes with subclinical macular neovascularization (MNV) at the time of first SS OCTA imaging, the incidence of exudation after 12 months was 21.1%. For eyes without subclinical MNV at the time of first SS OCTA imaging, the incidence of exudation after 12 months was 3.6%.
Figure 10.
Figure 10.
Kaplan-Meier analysis of the cumulative proportion of eyes treated with anti–vascular endothelial growth factor (VEGF) therapy from the time of first detection of subclinical macular neovascularization (MNV). The overall incidence of exudation from detection of any subclinical MNV was 24% at 1 year of follow-up.

References

    1. Gess AJ, Fung AE, Rodriguez JG. Imaging in neovascular age-related macular degeneration. Semin Ophthalmol. 2011;26(3):225–233. - PubMed
    1. Rosenfeld PJ. Optical coherence tomography and the development of antiangiogenic therapies in neovascular age-related macular degeneration. Invest Ophthalmol Vis Sci. 2016;57(9): OCT14–OCT26. - PMC - PubMed
    1. Guyer DR, Yannuzzi LA, Slakter JS, et al. Classification of choroidal neovascularization by digital indocyanine green videoangiography. Ophthalmology. 1996;103(12):2054–2060. - PubMed
    1. Schneider U, Gelisken F, Inhoffen W, Kreissig I. Indocyanine green angiographic findings in fellow eyes of patients with unilateral occult neovascular age-related macular degeneration. Int Ophthalmol. 1997;21(2):79–85. - PubMed
    1. Hanutsaha P, Guyer DR, Yannuzzi LA, et al. Indocyanine-green videoangiography of drusen as a possible predictive indicator of exudative maculopathy. Ophthalmology. 1998;105(9):1632–1636. - PubMed

Publication types