

Global, regional, and subregional classification of abortions by safety, 2010-14: estimates from a Bayesian hierarchical model
- PMID: 28964589
- PMCID: PMC5711001
- DOI: 10.1016/S0140-6736(17)31794-4
Global, regional, and subregional classification of abortions by safety, 2010-14: estimates from a Bayesian hierarchical model
Erratum in
-
Department of Error.Lancet. 2017 Nov 25;390(10110):2346. doi: 10.1016/S0140-6736(17)32608-9. Epub 2017 Oct 9. Lancet. 2017. PMID: 29032857 Free PMC article. No abstract available.
Abstract
Background: Global estimates of unsafe abortions have been produced for 1995, 2003, and 2008. However, reconceptualisation of the framework and methods for estimating abortion safety is needed owing to the increased availability of simple methods for safe abortion (eg, medical abortion), the increasingly widespread use of misoprostol outside formal health systems in contexts where abortion is legally restricted, and the need to account for the multiple factors that affect abortion safety.
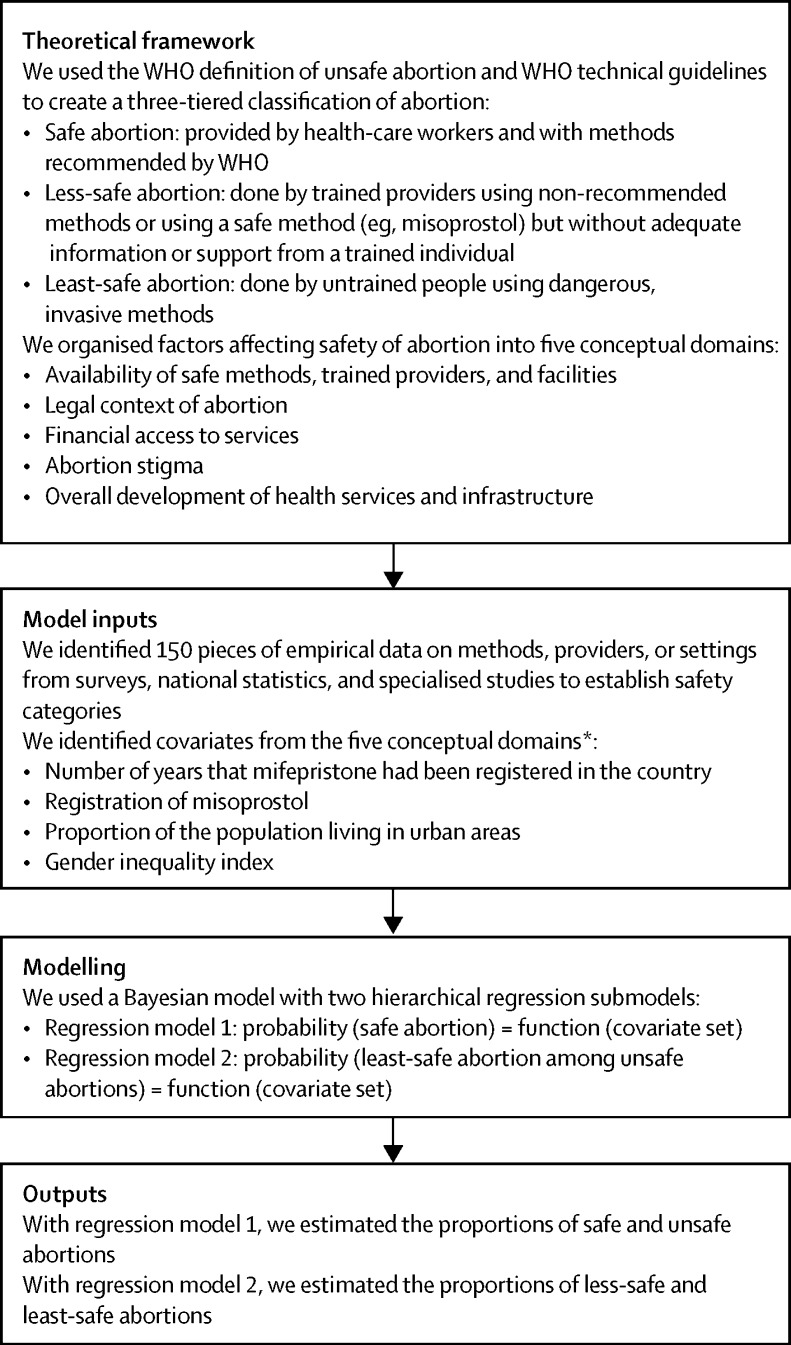
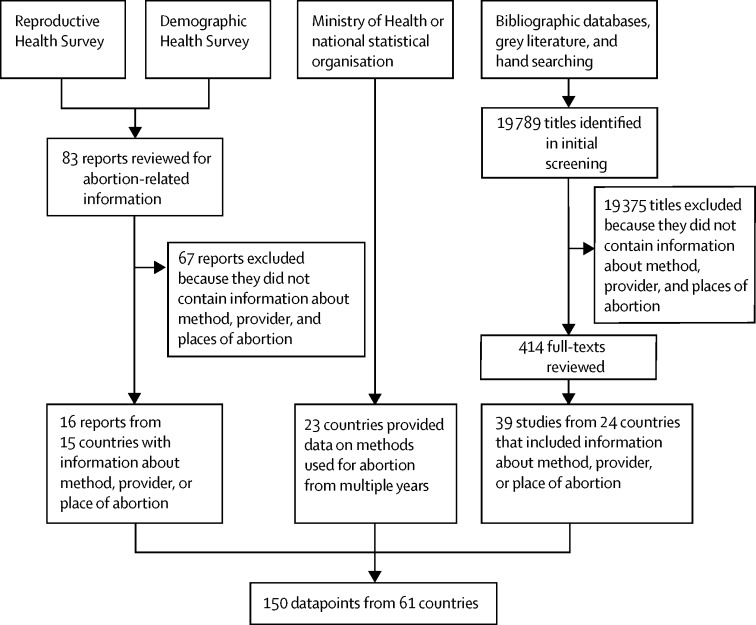
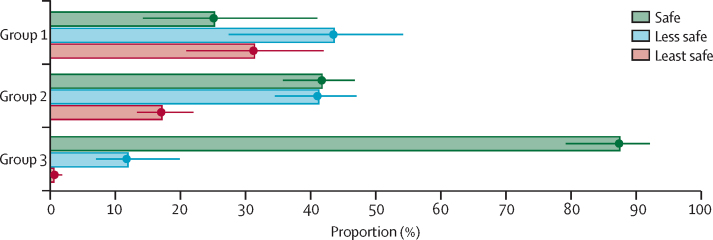
Methods: We used all available empirical data on abortion methods, providers, and settings, and factors affecting safety as covariates within a Bayesian hierarchical model to estimate the global, regional, and subregional distributions of abortion by safety categories. We used a three-tiered categorisation based on the WHO definition of unsafe abortion and WHO guidelines on safe abortion to categorise abortions as safe or unsafe and to further divide unsafe abortions into two categories of less safe and least safe.
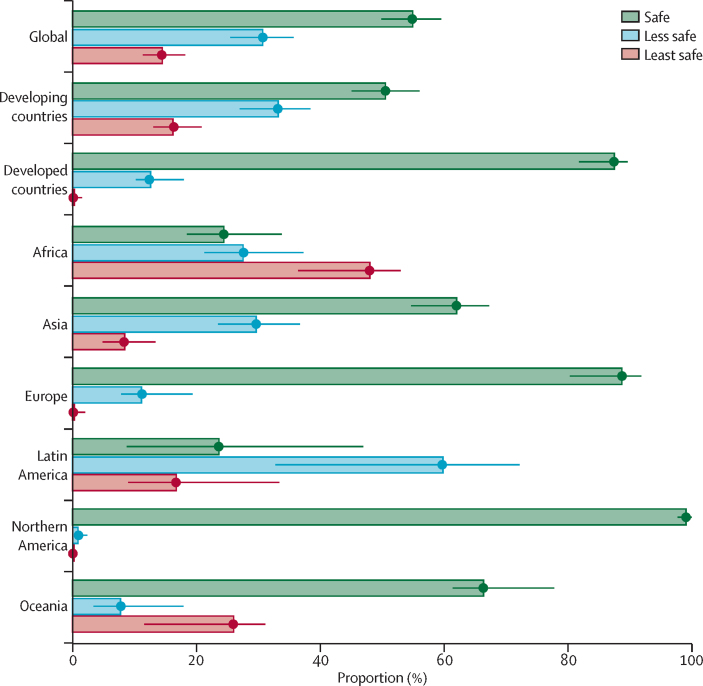
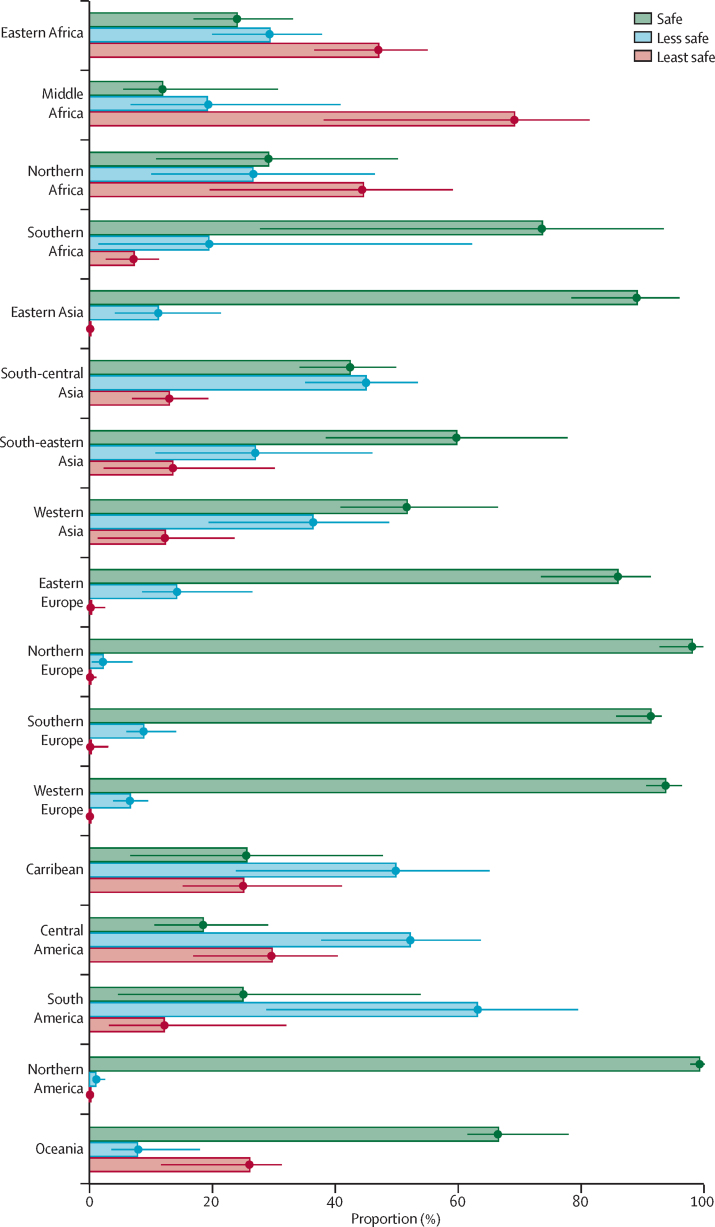
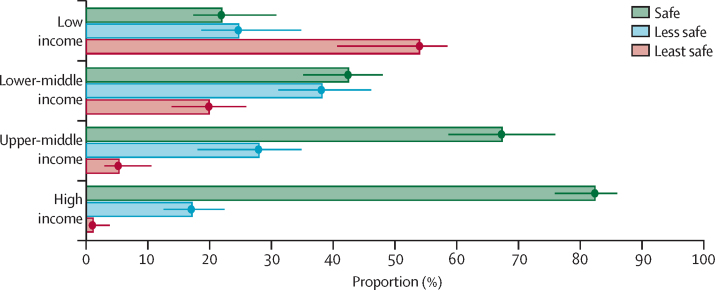
Findings: Of the 55· 7 million abortions that occurred worldwide each year between 2010-14, we estimated that 30·6 million (54·9%, 90% uncertainty interval 49·9-59·4) were safe, 17·1 million (30·7%, 25·5-35·6) were less safe, and 8·0 million (14·4%, 11·5-18·1) were least safe. Thus, 25·1 million (45·1%, 40·6-50·1) abortions each year between 2010 and 2014 were unsafe, with 24·3 million (97%) of these in developing countries. The proportion of unsafe abortions was significantly higher in developing countries than developed countries (49·5% vs 12·5%). When grouped by the legal status of abortion, the proportion of unsafe abortions was significantly higher in countries with highly restrictive abortion laws than in those with less restrictive laws.
Interpretation: Increased efforts are needed, especially in developing countries, to ensure access to safe abortion. The paucity of empirical data is a limitation of these findings. Improved in-country data for health services and innovative research to address these gaps are needed to improve future estimates.
Funding: UNDP/UNFPA/UNICEF/WHO/World Bank Special Programme of Research, Development and Research Training in Human Reproduction; David and Lucile Packard Foundation; UK Aid from the UK Government; Dutch Ministry of Foreign Affairs; Norwegian Agency for Development Cooperation.
Copyright © 2017 World Health Organization; licensee Elsevier. This is an Open Access article published under the CC BY-NC-ND 3.0 IGO license which permits users to download and share the article for non-commercial purposes, so long as the article is reproduced in the whole without changes, and provided the original source is properly cited. This article shall not be used or reproduced in association with the promotion of commercial products, services or any entity. There should be no suggestion that WHO endorses any specific organisation, products or services. The use of the WHO logo is not permitted. This notice should be preserved along with the article's original URL.
Figures
Comment in
-
Estimating abortion safety: advancements and challenges.Lancet. 2017 Nov 25;390(10110):2333-2334. doi: 10.1016/S0140-6736(17)32135-9. Epub 2017 Sep 27. Lancet. 2017. PMID: 28964590 No abstract available.
References
-
- Say L, Chou D, Gemmill A. Global causes of maternal death: a WHO systematic analysis. Lancet Glob Health. 2014;2:e323–e333. - PubMed
-
- Singh S, Darroch JE, Ashford LS. Adding it up: the costs and benefits of investing in sexual and reproductive health. 2014. https://www.guttmacher.org/sites/default/files/report_pdf/addingitup2014... (accessed Sept 19, 2017).
-
- WHO . Safe abortion: technical and policy guidance for health systems. 2nd edn. World Health Organization; Geneva: 2012. http://www.who.int/reproductivehealth/publications/unsafe_abortion/97892... (accessed Jan 4, 2017). - PubMed
Publication types
MeSH terms
Grants and funding
LinkOut - more resources
Full Text Sources
Other Literature Sources
Medical
