Review
. 2017 Jan:34:E007.
doi: 10.1017/S0952523817000049.

Thalamocortical processing in vision

Affiliations
Review

Thalamocortical processing in vision

Reece Mazade et al. Vis Neurosci. 2017 Jan.

Abstract

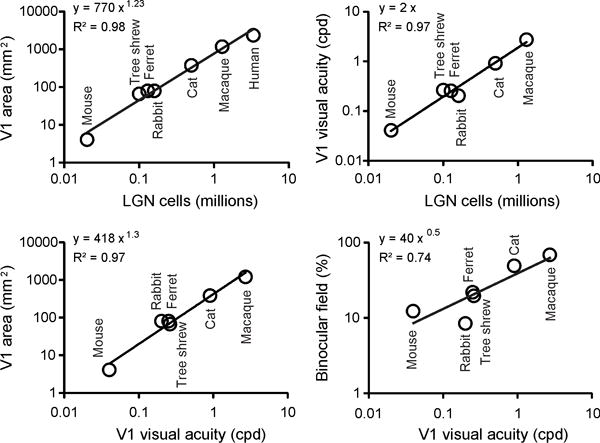
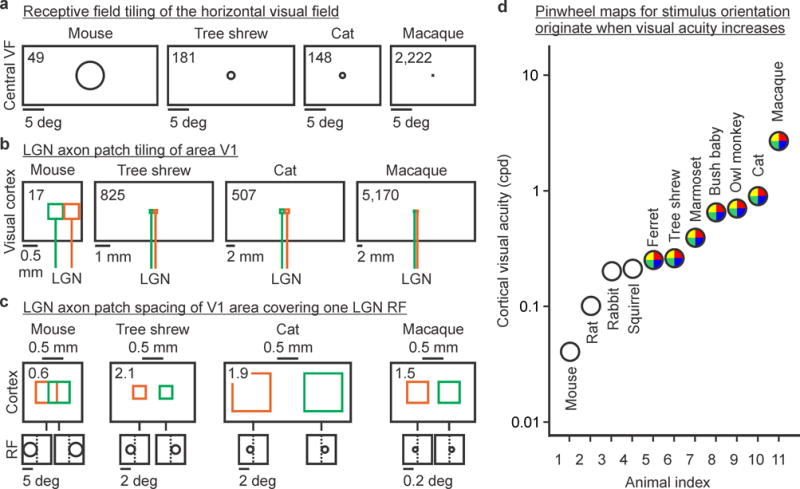
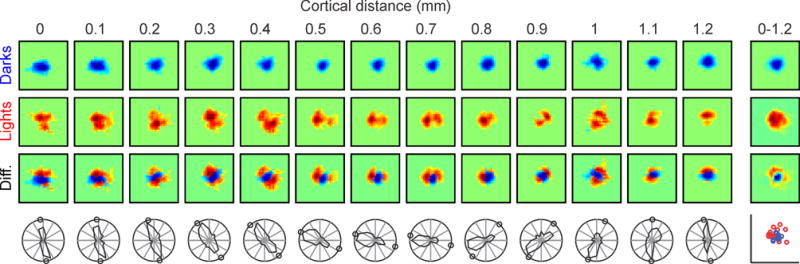
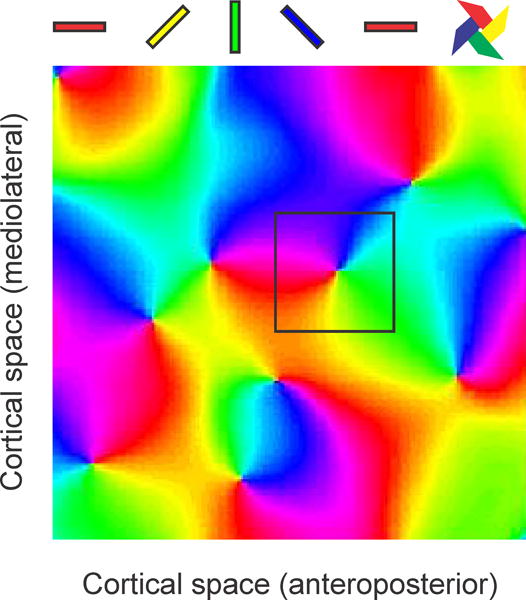
Visual information reaches the cerebral cortex through a major thalamocortical pathway that connects the lateral geniculate nucleus (LGN) of the thalamus with the primary visual area of the cortex (area V1). In humans, ∼3.4 million afferents from the LGN are distributed within a V1 surface of ∼2400 mm2, an afferent number that is reduced by half in the macaque and by more than two orders of magnitude in the mouse. Thalamocortical afferents are sorted in visual cortex based on the spatial position of their receptive fields to form a map of visual space. The visual resolution within this map is strongly correlated with total number of thalamic afferents that V1 receives and the area available to sort them. The ∼20,000 afferents of the mouse are only sorted by spatial position because they have to cover a large visual field (∼300 deg) within just 4 mm2 of V1 area. By contrast, the ∼500,000 afferents of the cat are also sorted by eye input and light/dark polarity because they cover a smaller visual field (∼200 deg) within a much larger V1 area (∼400 mm2), a sorting principle that is likely to apply also to macaques and humans. The increased precision of thalamic sorting allows building multiple copies of the V1 visual map for left/right eyes and light/dark polarities, which become interlaced to keep neurons representing the same visual point close together. In turn, this interlaced arrangement makes cortical neurons with different preferences for stimulus orientation to rotate around single cortical points forming a pinwheel pattern that allows more efficient processing of objects and visual textures.

Keywords: Cortex; Lateral geniculate nucleus; Primary visual cortex; Thalamus.


Figures

Figure 1
Figure 1
Thalamocortical visual function in different animals: primates, carnivores, scandentia, lagomorphs, and rodents. Top. The number of LGN cells is correlated to the size of area V1 (left) and cortical visual acuity (right). Bottom. Cortical visual acuity is also correlated to the size of area V1 (left, expected from correlations shown at the top), and the horizontal extent of the binocular field (shown as a percentage of the total horizontal extent of the visual field). Size of area V1 refers to only one hemisphere. See Table 1 for references.
Figure 2
Figure 2
Thalamocortical networks underlying the organization of visual cortical maps. a, Number of non-overlapping LGN receptive fields needed to tile a horizontal line across the visual field (shown on top left corner of each rectangle, taken from column 7 in Table 2). Only 1/10 of the horizontal visual field is represented for illustration purposes. b, Number of non-overlapping LGN-axon-patches needed to tile a horizontal line through area V1 (shown on top left corner of each rectangle, taken from column 3 in Table 3). Green and orange colors represent two different afferents. c, The largest spacing between two LGN-axon-patches covering one LGN receptive field in visual cortex (shown on top left corner of each rectangle, taken from column 5 in Table 3). For simplicity, axon patches are represented as squares. d, Cortical optimal visual acuity across 11 different species (values obtained from the references cited below). Colored circles indicate pinwheel orientation maps in visual cortex. Mouse: (Niell and Stryker 2008). Rat,Gray squirrel,Bush baby,Owl monkey: (Heimel, Van Hooser et al. 2005). Rabbit: (Zhuang, Stoelzel et al. 2013). Ferret: (Baker, Thompson et al. 1998). Tree shrew: (Johnson, Van Hooser et al. 2010). Marmoset: (Forte, Hashemi-Nezhad et al. 2005). Cat: (Movshon, Thompson et al. 1978). Macaque: (De Valois, Albrecht et al. 1982). VF: visual field. RF: receptive field
Figure 3
Figure 3
Changes in orientation preference and receptive field position along a horizontal track of cat visual cortex. From top to bottom, the rows show OFF receptive fields mapped with dark stimuli (in blue), ON receptive fields mapped with light stimuli (in red), the ON-OFF receptive field difference (diff.), and the orientation/direction preference measured with moving bars (circles show the orientation preference predicted from the receptive field maps). From left to right, the columns show cortical measurements separated by 0.1 mm from 0 to 1.2 mm distance. The column on the right shows the receptive field average along the entire horizontal track (top three receptive fields) and the central positions of ON (red circles) and OFF receptive fields (blue circles). The position of these ON and OFF cortical receptive fields is determined by the receptive field population of the ON and OFF thalamic afferents.
Figure 4
Figure 4
Pinwheel pattern of the cortical map for stimulus orientation. Colors illustrate the different orientations represented on the cortical surface (cat area 17, 2 × 2 mm). A square of 0.5 × 0.5 mm is shown centered on a cortical pinwheel.

References

    1. Adams DL, Horton JC. Capricious expression of cortical columns in the primate brain. Nature neuroscience. 2003;6(2):113–114. - PubMed
    1. Adams DL, Sincich LC, et al. Complete pattern of ocular dominance columns in human primary visual cortex. The Journal of neuroscience : the official journal of the Society for Neuroscience. 2007;27(39):10391–10403. - PMC - PubMed
    1. Andrews TJ, Halpern SD, et al. Correlated size variations in human visual cortex, lateral geniculate nucleus, and optic tract. The Journal of neuroscience : the official journal of the Society for Neuroscience. 1997;17(8):2859–2868. - PMC - PubMed
    1. Antonini A, Fagiolini M, et al. Anatomical correlates of functional plasticity in mouse visual cortex. The Journal of neuroscience : the official journal of the Society for Neuroscience. 1999;19(11):4388–4406. - PMC - PubMed
    1. Baker GE, Thompson ID, et al. Spatial-frequency tuning and geniculocortical projections in the visual cortex (areas 17 and 18) of the pigmented ferret. The European journal of neuroscience. 1998;10(8):2657–2668. - PubMed

Publication types

LinkOut - more resources