. 2017 Oct 5;21(4):502-516.e9.
doi: 10.1016/j.stem.2017.08.018. Epub 2017 Sep 28.

MYC Controls Human Pluripotent Stem Cell Fate Decisions through Regulation of Metabolic Flux

Affiliations

MYC Controls Human Pluripotent Stem Cell Fate Decisions through Regulation of Metabolic Flux

Timothy S Cliff et al. Cell Stem Cell. .

Abstract

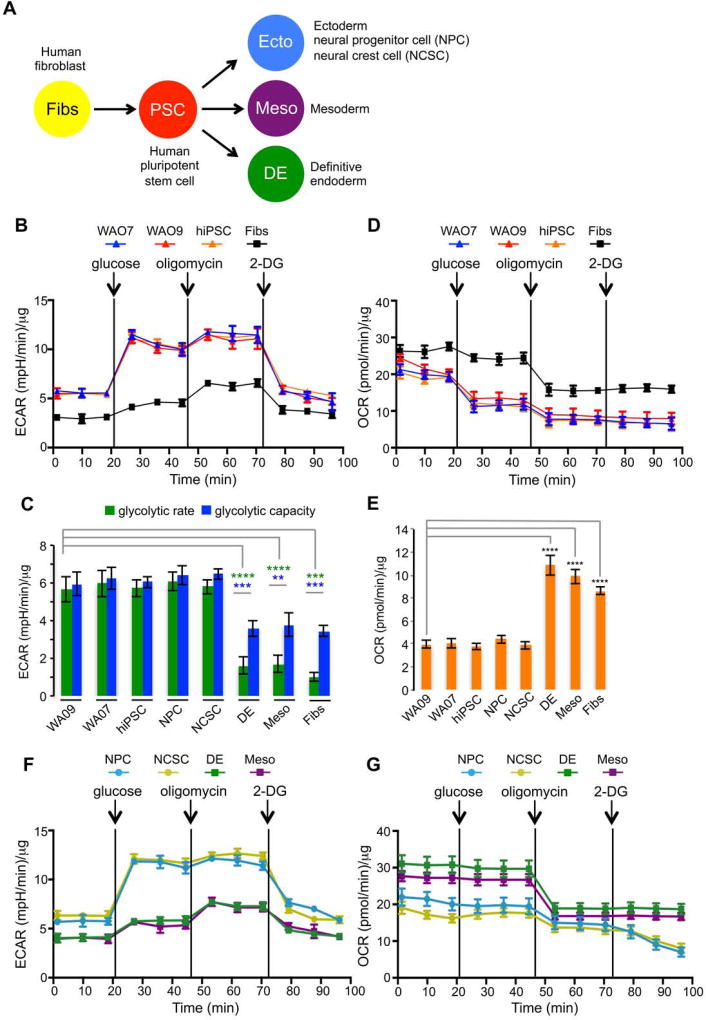
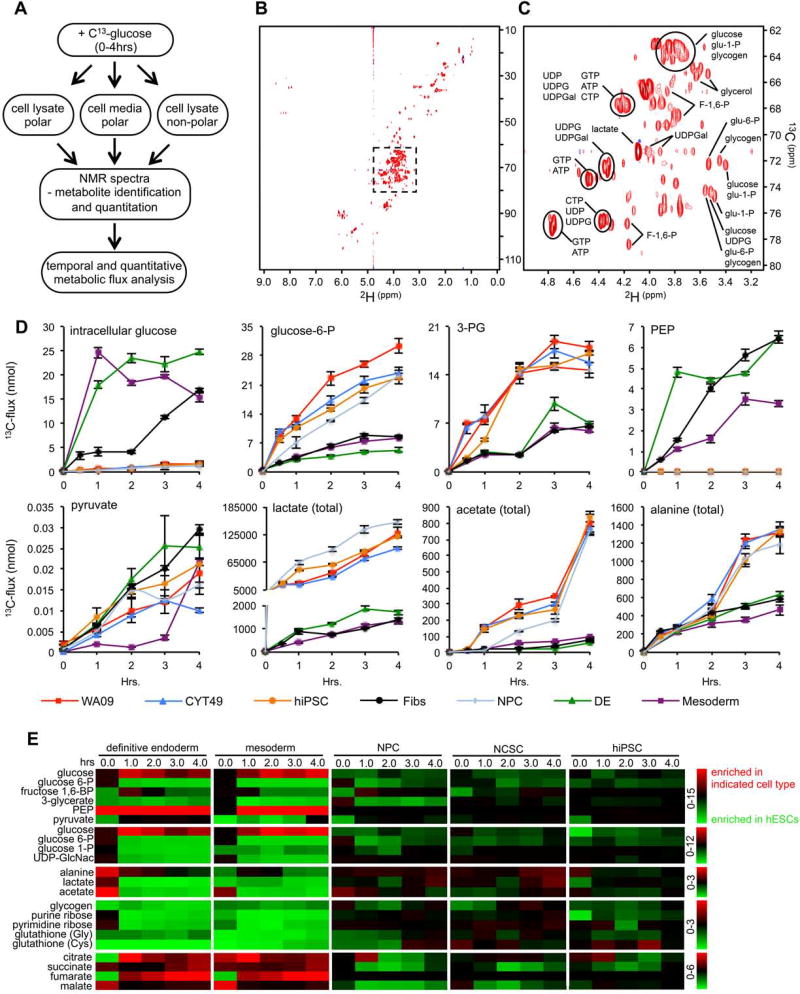
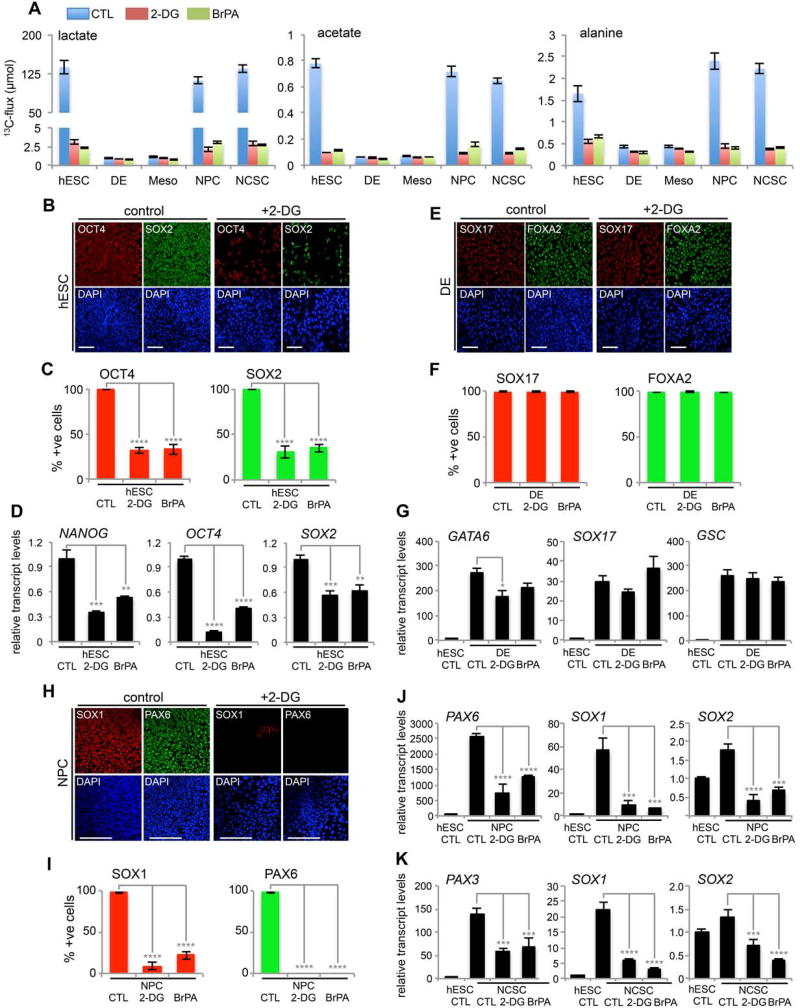
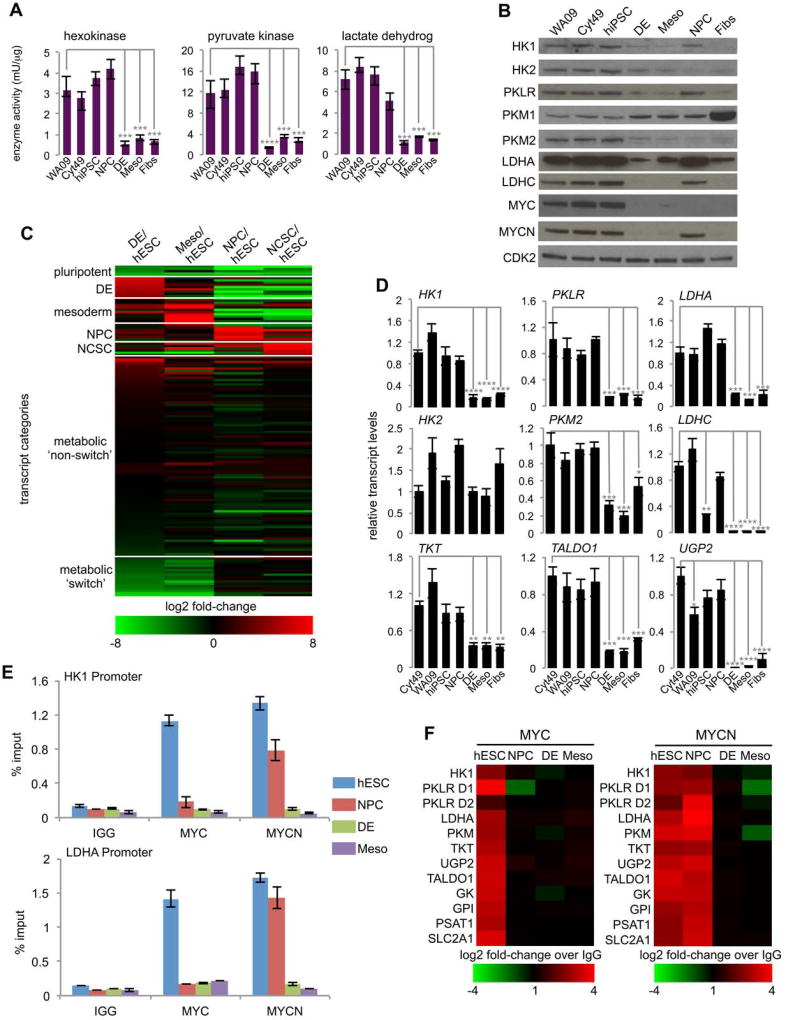
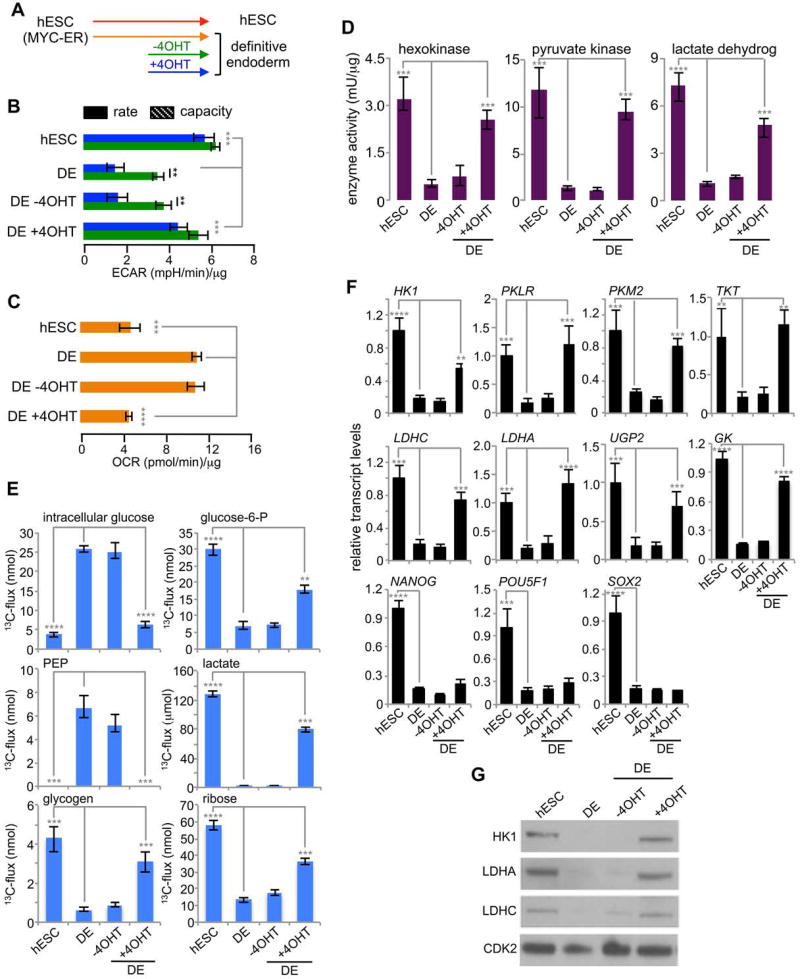
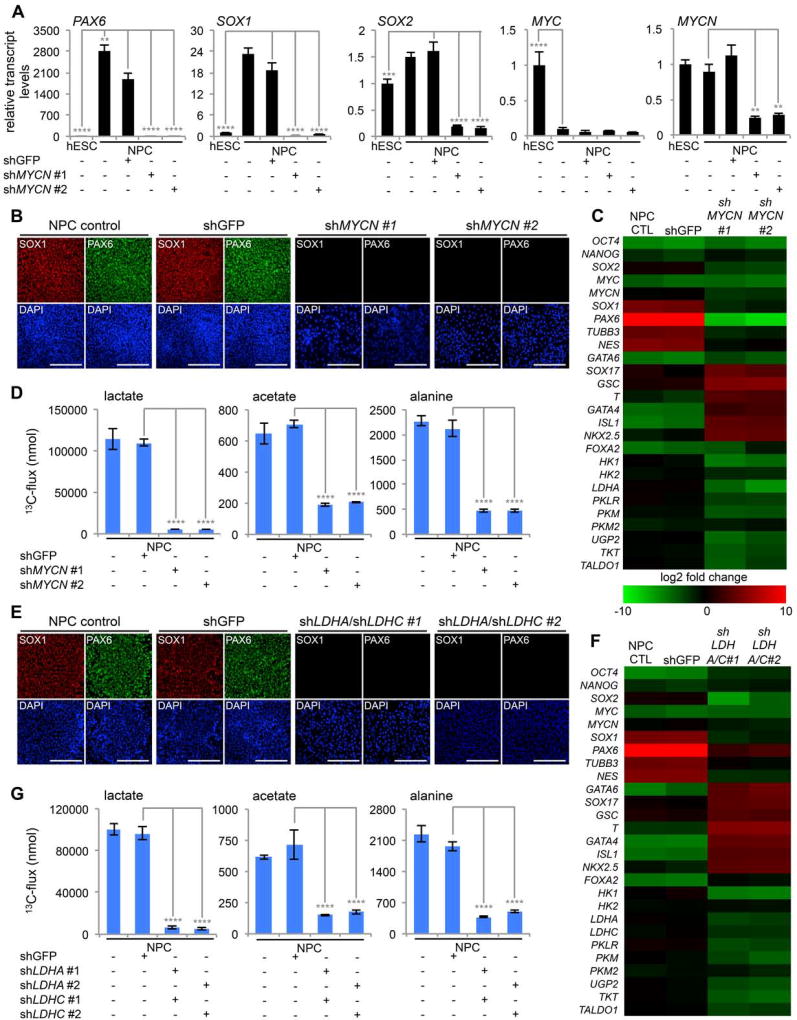
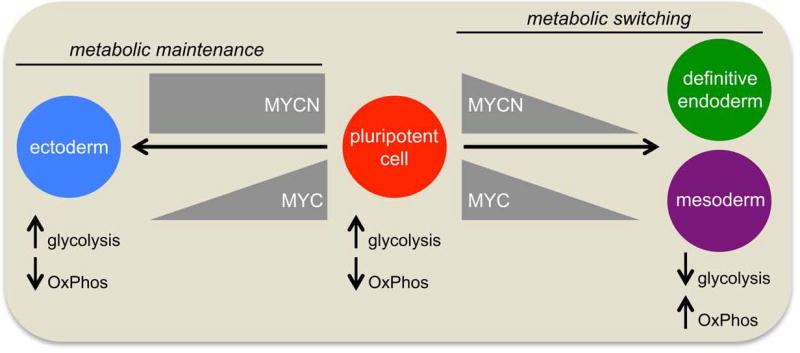
As human pluripotent stem cells (hPSCs) exit pluripotency, they are thought to switch from a glycolytic mode of energy generation to one more dependent on oxidative phosphorylation. Here we show that, although metabolic switching occurs during early mesoderm and endoderm differentiation, high glycolytic flux is maintained and, in fact, essential during early ectoderm specification. The elevated glycolysis observed in hPSCs requires elevated MYC/MYCN activity. Metabolic switching during endodermal and mesodermal differentiation coincides with a reduction in MYC/MYCN and can be reversed by ectopically restoring MYC activity. During early ectodermal differentiation, sustained MYCN activity maintains the transcription of "switch" genes that are rate-limiting for metabolic activity and lineage commitment. Our work, therefore, shows that metabolic switching is lineage-specific and not a required step for exit of pluripotency in hPSCs and identifies MYC and MYCN as developmental regulators that couple metabolism to pluripotency and cell fate determination.

Keywords: MYC; cell fate; differentiation; germ layers; metabolic flux; metabolic switching; pluripotency.


Figures

Figure 1
Figure 1. Metabolic switching as cells exit pluripotency is germ layer-specific
(A) Summary of cell types used in this study. (B) Extracellular acidification rate (ECAR) analysis of human pluripotent stem cells (hESCs; WA07, WA09, hiPSCs) and primary human fibroblasts (Fibs) following addition of glucose (10 mM), oligomycin (1 mM) and 2-deoxyglucose (2-DG, 50 mM). (C) Glycolytic rates (ECAR) and glycolytic capacity (ECAR following oligomycin) for hPSCs, Fibs, neural progenitor cells (NPC), pre-neural crest stem cells (NCSC), definitive endoderm (DE) and mesoderm (Meso). (D) Oxygen consumption rate (OCR) assays for hPSCs and Fibs. (E) OCRs for the indicated cell types. (F,G) ECAR and OCR analysis for the indicated cell types. All assays were performed in biological triplicate. Error bars represent the standard deviation. **** p<0.0001, *** p<0.001, ** p<0.01 for Students pair-wise t-test. See also Figure S1. Note: non-statically significant changes are not denoted on graphs; only significant changes are labeled.
Figure 2
Figure 2. Nuclear magnetic resonance (NMR) analysis of metabolic switching
(A) Workflow for NMR-based 13C-glucose metabolic flux analysis. (B) Representative gradient enhanced 1D-1H and 2D-1H, 13C-heteronuclear single quantum coherence (cCHSQC) NMR spectra (Figures 2B–C). Each peak measures an individual carbon to hydrogen bond within metabolites that can be identified and quantitated. (C) Magnification of NMR spectra shown in boxed area of (B). Representative metabolites are indicated. (D)13C-flux analysis over a 0–4 hr time-course for definitive endoderm (DE), mesoderm (Meso), neural progenitor cells (NPC), pre-neural crest stem cells (NCSC) and hiPSCs. Measurements are of intracellular metabolites unless observed in both the intra- and extracellular fractions and are then marked by (total), which represents the combination of intra- and extra-cellular measurements. Scale bars are shown (right). (E) NMR-based 13C-glucose metabolic flux analysis over a 4 hr labeling time-course for indicated metabolites in glycolysis, hexosamine biosynthetic pathway, the pentose phosphate pathway, glycogen biosynthesis, glutathione production and the tricarboxylic acid cycle within pluripotent cells (WA09, Cyt49, hiPSC), WA09-derived germ layer derivatives (NPC, DE, Meso) and primary fibroblasts (Fibs). Metabolite levels for indicated cell types are displayed as the fold-change to metabolite levels at corresponding time points in hESCs (WA09). See also Figure S2.
Figure 3
Figure 3. Elevated glycolytic activity is required for pluripotency and early ectoderm differentiation
(A) 13C-glucose metabolic flux analysis over 4 hr in hESCs, definitive endoderm (DE), mesoderm (Meso) and early ectoderm- neural progenitor cells (NPCs) and pre-neural crest stem cells (NCSC). 24 hours after plating, cells were cultured for a further 3 days (hESCs, DE and Meso) or 5 days (NPC and NCSC) in the presence of 2-deoxyglucose (2-DG, 2.2 mM) or 3-bromopyruvate (BrPA, 17µM) where indicated. Units are nmol standardized to 25 million cells. Error bars represent the standard deviation. Cells were immunostained and probed for indicated antibodies, then scored for % cells expressing lineage markers (red and green bar graphs) and analyzed by qRT-PCR (black bar graphs) analysis to determine transcript levels in WA09 hESCs (B–D), DE (E–G) or NPCs (H–J). (K) qRT-PCR transcript analysis of PAX3, SOX1 and SOX2 in hESCs and NCSC that were seeded and cultured for 24 hrs, then treated with 2-DG (2.2 mM) or BrPA (17 µM), as indicated for 5 days. **** p<0.0001, *** p<0.001, ** p<0.01 for one-way ANOVA. All experiments were performed in biological triplicate. Error bars represent the standard deviation. Micron bars, 100 mm. See also Figure S3, S4 and S5.
Figure 4
Figure 4. Metabolic switch genes are MYC/MYCN targets
(A) Enzyme activities assayed in cell lysates from the indicated cell types. (B) Immunoblot analysis of hPSC (WA09, Cyt49, hiPSC), definitive endoderm (DE), mesoderm (Meso), ectoderm (NPC; neural progenitor cell) and primary human fibroblast (Fibs) cell lysates probed with the indicated antibodies. (C) RNA-seq analysis of cell identity and metabolic genes in hESCs compared to derivative cell types; DE, Meso and ectoderm (NPC and pre-neural crest stem cells; NCSC). Metabolic 'non-switch' and 'switch' transcripts are indicated as are cell identity genes for each cell type (see Table S1). (D) qRT-PCR analysis of representative metabolic 'switch' transcripts in hPSCs, NPC, Meso, DE and Fibs. (E) Quantitative ChIP assays of MYC and MYCN binding to the promoters of HK1 and LDHA in hESCs and the three germ layers with immunoglobulin G (IgG) as the control. (F) Heat map of quantitative ChIP assays showing binding of MYC and MYCN as the log2 fold change over IgG control to metabolic 'switch' genes in hESCs and the three germ layers. **** p<0.0001, *** p<0.001, ** p<0.01 for one-way ANOVA. All experiments were performed in biological triplicate. Error bars represent the standard deviation. See also Table S1.
Figure 5
Figure 5. MYC is sufficient to re-establish the pluripotent mode of metabolic activity in endodermal cells
(A) Experimental scheme where a MYC-ER transgene is under control of 4OHT. (B) Extracellular acidification rate (ECAR) measurements in WA09 hESCs, derivative definitive endoderm (DE) and DE from hESCs carrying a MYC-ER transgene (+/− 4OHT) final 48 hours of differentiation. Oxygen consumption rate (OCR) analysis (C), enzyme activity assays (D)13C-glucose metabolic flux analysis over 4 hr (E), qRT-PCR (F) and immunoblot analysis (G) under conditions described in (B). **** p<0.0001, *** p<0.001, ** p<0.01 for one-way ANOVA. All experiments were performed in biological triplicate. Error bars represent the standard deviation. See also Figure S6.
Figure 6
Figure 6. MYC activity is required for maintenance of metabolic flux in pluripotent cells and during the early ectoderm transition
(A) qRT-PCR transcript analysis of WA09 hESCs, WA09-derived NPCs and NPCs transduced with lentivirus expressing GFP shRNA, MYCN shRNA#1, or MYCN shRNA#2. (B) Immunofluorescence showing levels of differentiation marker expression in control, GFP shRNA, MYCN shRNA#1, or MYCN shRNA#2 lentivirus transduced NPCs. qRT-PCR heat map of pluripotency and differentiation marker transcripts and metabolic 'switch' transcripts (C) and 13C-glucose metabolic flux analysis (D) of NPCs transduced with GFP shRNA, MYCN shRNA#1, or MYCN shRNA#2 lentivirus for 5 days. (E) Immunofluorescence showing levels of differentiation marker expression in WA09-derived control NPCs, NPCs transduced with lentivirus expressing GFP shRNA, co-expressing LDHA shRNA#1 and LDHC shRNA#1, or co-expressing LDHA shRNA#2 and LDHC shRNA#2. qRT-PCR heat map of pluripotency and differentiation marker transcripts and metabolic 'switch' transcripts (F) and 13C-glucose metabolic flux analysis (G) of NPCs transduced with lentivirus expressing GFP shRNA, co-expressing LDHA shRNA#1 and LDHC shRNA#1, or co-expressing LDHA shRNA#2 and LDHC shRNA#2 for 5 days. **** p<0.0001, *** p<0.001, ** p<0.01 for one-way ANOVA. All experiments were performed in biological triplicate. Error bars represent the standard deviation. Micron bars, 100 mm. See also Figure S7.
Figure 7
Figure 7. Mechanism by which MYC couples cell fate decisions to metabolic activity
MYC and MYCN maintain high glycolytic flux and pluripotency of human pluripotent cells by maintaining the transcriptional activity of metabolic 'switch' genes. During differentiation to definitive endoderm and mesoderm, global MYC levels decrease, metabolic 'switch' genes are down-regulated and glycolytic flux decreases. During early ectoderm commitment, MYC levels decline but MYCN activity is maintained- this maintains the transcription of metabolic 'switch' genes and an elevated glycolytic flux that is required for the pluripotency to ectoderm transition.

References

    1. Adhikary S, Peukert K, Karsunky H, Beuger V, Lutz W, Elsässer H-P, Möröy T, Eilers M. Miz1 is required for early embryonic development during gastrulation. Molecular and Cellular Biology. 2003;23:7648–7657. - PMC - PubMed
    1. Berger RP, Sun YH, Kulik M, Lee JK, Nairn AV, Moremen KW, Pierce M, Dalton S. ST8SIA4-Dependent Polysialylation is Part of a Developmental Program Required for Germ Layer Formation from Human Pluripotent Stem Cells. Stem Cells. 2016;34:1742–1752. - PMC - PubMed
    1. Bergmeyer HU, Bernt E, Hess B. Lactate dehydrogenase. Methods of Enzymatic Analysis. 1974;2:574–579.
    1. Bernstein BE, Stamatoyannopoulos JA, Costello JF, Ren B, Milosavljevic A, Meissner A, Kellis M, Marra MA, Beaudet AL, Ecker JR, et al. The NIH Roadmap Epigenomics Mapping Consortium. Nat Biotechnol. 2010;28:1045–1048. - PMC - PubMed
    1. Blackwood E, Eisenman R. Max: a helix-loop-helix zipper protein that forms a sequence-specific DNA-binding complex with Myc. Science. 1991;251:1211–1217. - PubMed

Publication types

Substances

LinkOut - more resources