. 2017 Oct 5;21(4):472-488.e10.
doi: 10.1016/j.stem.2017.08.014. Epub 2017 Sep 28.

Differentiation of Human Pluripotent Stem Cells into Functional Lung Alveolar Epithelial Cells

Affiliations

Differentiation of Human Pluripotent Stem Cells into Functional Lung Alveolar Epithelial Cells

Anjali Jacob et al. Cell Stem Cell. .

Abstract

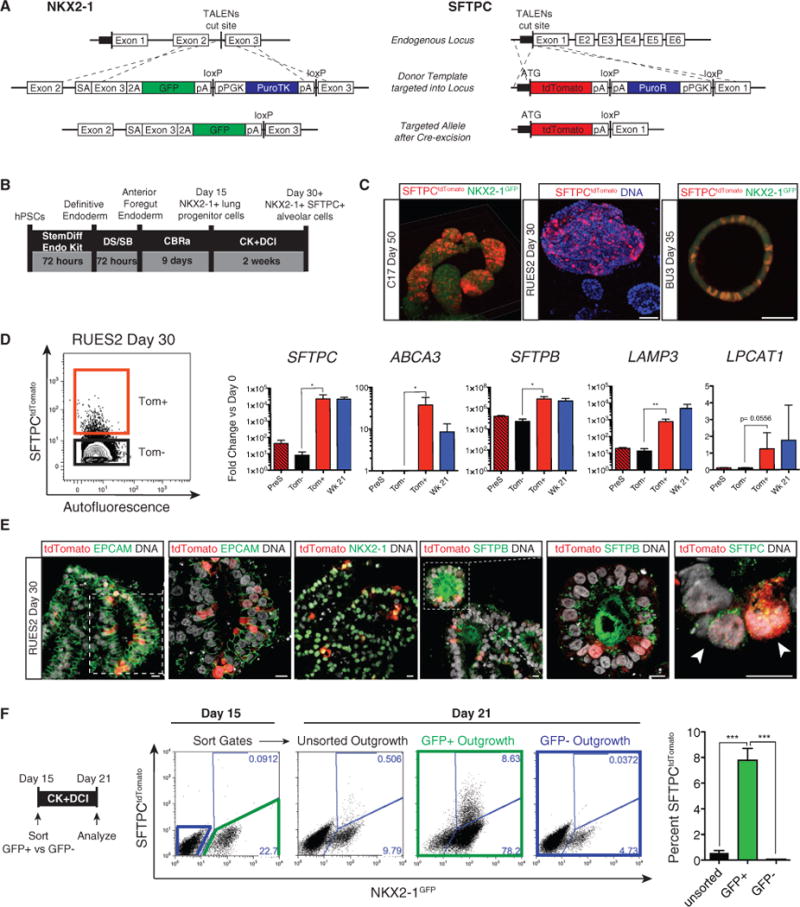
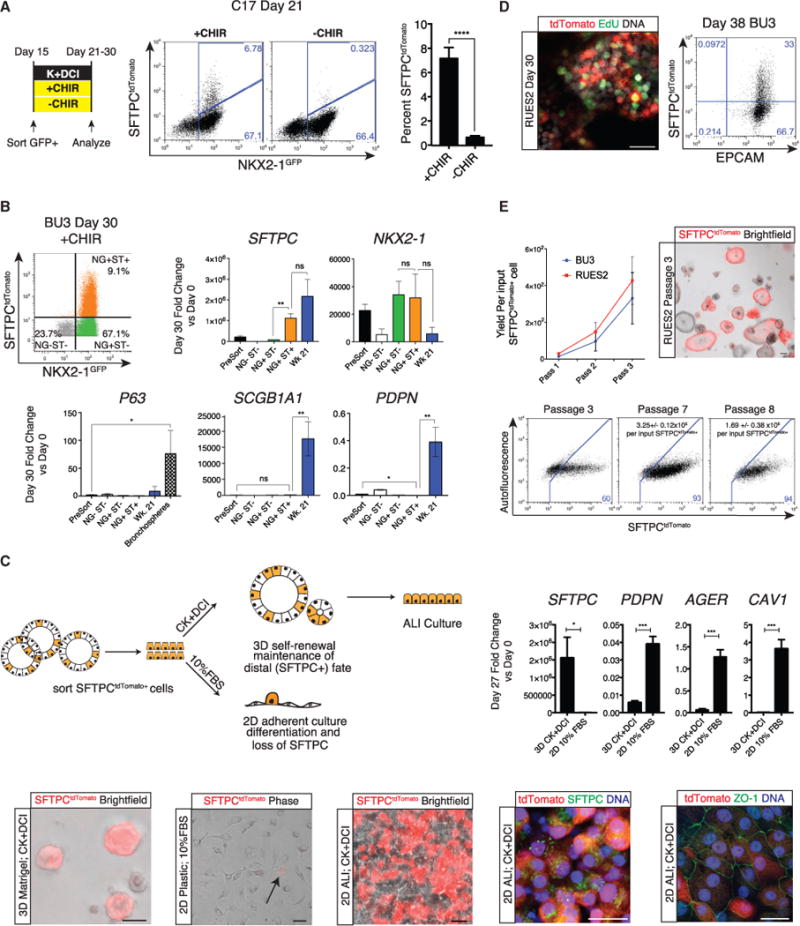
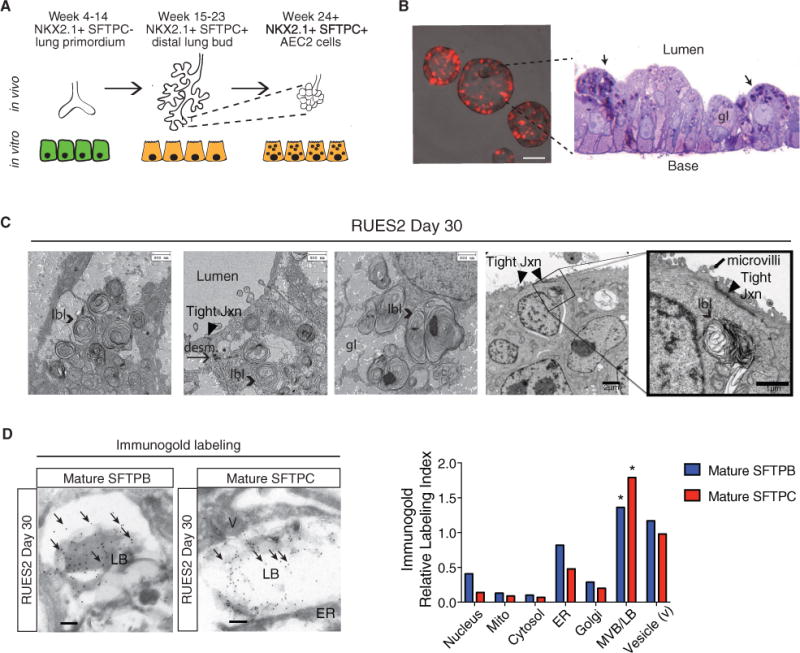
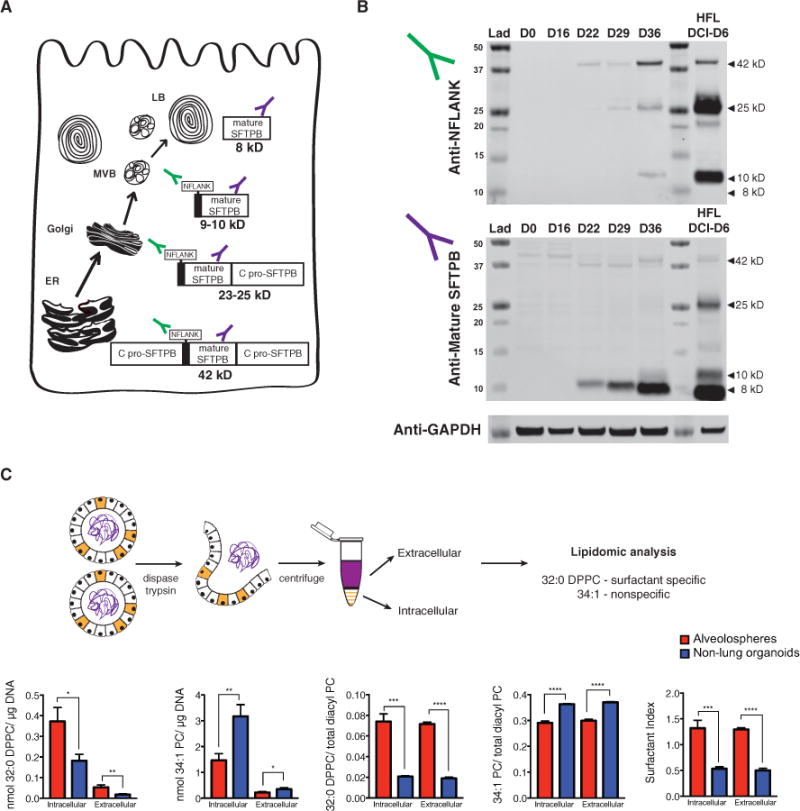
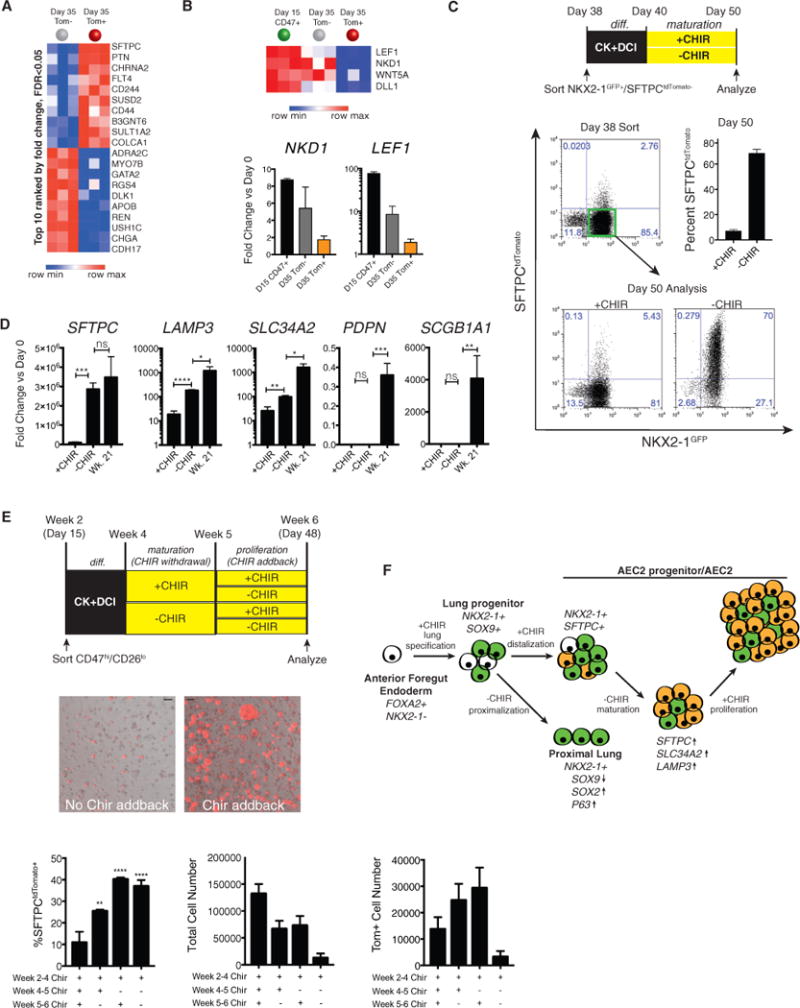
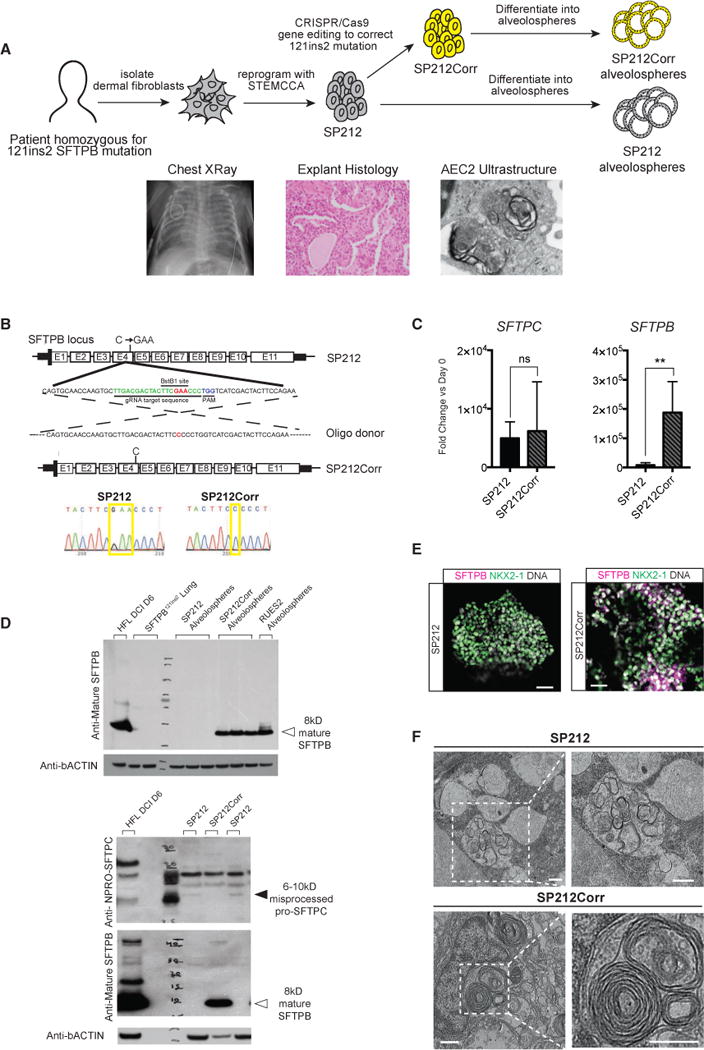
Lung alveoli, which are unique to air-breathing organisms, have been challenging to generate from pluripotent stem cells (PSCs) in part because there are limited model systems available to provide the necessary developmental roadmaps for in vitro differentiation. Here we report the generation of alveolar epithelial type 2 cells (AEC2s), the facultative progenitors of lung alveoli, from human PSCs. Using multicolored fluorescent reporter lines, we track and purify human SFTPC+ alveolar progenitors as they emerge from endodermal precursors in response to stimulation of Wnt and FGF signaling. Purified PSC-derived SFTPC+ cells form monolayered epithelial "alveolospheres" in 3D cultures without the need for mesenchymal support, exhibit self-renewal capacity, and display additional AEC2 functional capacities. Footprint-free CRISPR-based gene correction of PSCs derived from patients carrying a homozygous surfactant mutation (SFTPB121ins2) restores surfactant processing in AEC2s. Thus, PSC-derived AEC2s provide a platform for disease modeling and future functional regeneration of the distal lung.

Keywords: CRISPR; alveolar epithelial cell; development; disease modeling; embryonic stem cells; gene editing; human induced pluripotent stem cells; lung; surfactant; surfactant protein B.


Figures

Figure 1
Figure 1. NKX2-1GFP and SFTPCtdTomato Reporters Allow Visualization of Distal Lung Differentiation and Isolation of Putative iAEC2s
(A) Transcription activator-like effector nucleases (TALEN) targeting strategy and edited NKX2-1GFP and SFTPCtdTomato loci post Cre-mediated antibiotic cassette excision. (B) Differentiation protocol from PSC to putative iAEC2s used hereafter. (C) Representative images of “alveolospheres” late in differentiation showing expression of endogenous NKX2-1GFP and SFTPCtdTomato (C17 and RUES2 show 3D whole-mount confocal fluorescence microscopy reconstructions; BU3 shows live imaging on an inverted microscope). Scale bars, 100 μm. (D) Representative flow cytometry of SFTPCtdTomato expression in day 30 RUES2. qRT-PCR of pre-sorted, sorted tdTomato+ (Tom+), and tdTomato− (Tom−) samples compared with primary week 21 human fetal distal lung control. Bars represent mean fold change (2−ΔΔCt) ± SD in 3 biological replicates separated on day 0; *p % 0.05, **p % 0.01 by unpaired, one-tailed Student’s t test. (E) Representative immunofluorescence microscopy with antibodies against tdTomato (red), EPCAM, NKX2-1, proSFTPB, and proSFTPC (green) in day 30 RUES2 alveolospheres. Nuclei were stained with Hoechst (gray). Scale bars, 10 μm. (F) Day 21 representative flow cytometry analysis of C17 day 15 unsorted, sorted NKX2-1GFP+, or sorted NKX2-1GFP− outgrowth. Bars represent mean ± SD in 3 biological replicates separated on day 0; ***p % 0.001 by unpaired, two-tailed Student’s t test. See also Figures S1 and S2.
Figure 2
Figure 2. Putative iAEC2s Proliferate and Differentiate in Long-Term Culture
(A) Day 21 representative flow cytometry analysis of C17 day 15 NKX2-1GFP+ outgrowth cultured from days 15–21 with or without addition of CHIR to K+DCI base medium. Bars represent mean ± SD, n = 6 biological replicates separated on day 0; ****p % 0.0001 by unpaired, two-tailed Student’s t test. (B) Day 30 representative flow cytometry analysis of BU3 iPSCs sorted on day 15 based on NKX2-1GFP+ expression, replated for outgrowth from days 15–30, and then sorted for analysis from each gate: NKX2-1GFP− SFTPCtdTomato− (NG−ST−), NKX2-1GFP+ SFTPCtdTomato− (NG+ST−), and NKX2-1GFP+ SFTPCtdTomato+ (NG+ST+). Shown is qRT-PCR of these populations in addition to unsorted (Pre-Sort) day 30 cells, week 21 primary human fetal distal lung controls, and BU3 iPSC-derived proximal spheres generated as described in McCauley et al. (2017) (Bronchospheres). Bars represent mean fold change (2−ΔΔCt) ± SD, n = 3 biological replicates separated on day 15. (C) Schematic showing SFTPCtdTomato+ cells from day 22 alveolospheres sorted either into 3D culture in CK+DCI medium or 2D culture (tissue culture-treated plastic) in 10% fetal bovine serum (FBS) medium. Shown is representative phase/bright-field and tdTomato fluorescence microscopy of live cells after 7 days in 2D plastic, 3D Matrigel, or after 2D ALI culture conditions. Scale bars, 50 μm; the arrow indicates tdTomato expression in 2D cultured cells. Also shown is representative immunofluorescence microscopy for tdTomato (red), ZO-1 or proSFTPC (green), and DNA (Hoechst, blue) in RUES2 alveolospheres cultured in ALI. Scale bars, 25 μm. We also show qRT-PCR of day 22 sorted SFTPCtdTomato+ cells cultured under 3D versus 2D conditions for 5 days, with bars representing mean fold change (2−ΔΔCt) ± SD, n = 3 biological replicates; *p % 0.05, ***p % 0.001 by unpaired, two-tailed Student’s t test. (D) Representative confocal immunofluorescence microscopy of EdU (green), anti-tdTomato (red), and DNA (Hoechst, blue) after 24-hr 5-ethynyl-2′-deoxyuridine (EdU) incubation. Scale bar, 25 μm. Representative flow cytometry analysis of day 38 BU3 iPSC-derived alveolospheres shows co-expression of EPCAM and tdTomato proteins. (E) Graph showing yield in cell number per input RUES2 or BU3 SFTPCtdTomato+ sorted cell plated on day 22 or 30, respectively. Shown is representative live-cell imaging on passage 3 of SFTPCtdTomato+ sorted RUES2 alveolospheres. Scale bar, 100 μm. Also shown is representative flow cytometry of passage 3, 7, and 8 RUES2-derived alveolospheres from the outgrowth of SFTPCtdTomato+ cells with SFTPCtdTomato+ cell yields indicated (mean ± SD) per input sorted tdTomato+ cell. See also Figure S3.
Figure 3
Figure 3. Putative iAEC2s Express Lamellar Bodies that Contain Surfactant
(A) Temporal expression of NKX2-1 and SFTPC during human fetal lung development. (B) Representative image of live day 30 RUES2-derived alveolospheres (scale bar, 100 μm) and plastic section stained with toluidine blue. Arrows indicate cells with putative lamellar body-like inclusions. gl, glycogen lake. (C) TEM of day 30 RUES2-derived alveolospheres. LBL, lamellar body-like inclusion; tight jxn, tight junction; desm, desmosome. (D) Immunogold labeling of mature SFTPB and SFTPC in day 30 RUES2 alveolospheres. Scale bars, 0.2 μm. The significance of the relative labeling index in each cellular compartment (χ2 statistics and contingency table analyses) is indicated. *p < 0.0001. See also Figure S4.
Figure 4
Figure 4. Putative iAEC2 Lamellar Bodies Function to Synthesize and Secrete Surfactant
(A) Cellular compartments in which proSFTPB processing into mature SFTPB occurs. MVB, multivesicular body. (B) Western blot of a time course of alveolosphere differentiation (days 0, 16, 22, 29, and 36) and 6-day DCI-cultured primary week 21 human fetal distal lung (HFL DCI-D6) as a positive control. Top: use of an anti-NFLANK antibody that binds to the N-pro region of pro-SFTPB intermediates. Bottom: use of an anti-mature SFTPB antibody (PT3) that binds all SFTPB forms, including the 8-kD mature form. (C) Dissociation protocol for isolation of intracellular and extracellular components of alveolospheres. Both absolute (nanomoles of lipid/micrograms of DNA in cell samples) and relative (nanomoles of lipid/nanomoles of total diacyl phosphatidylcholine) are shown for both surfactant-specific 32:0 dipalmitoyl phos-phatidylcholine (DPPC) and nonspecific 34:1 phosphatidylcholine (PC). The surfactant index was calculated as the sum of the surfactant-specific 30 and 32 PCs divided by the sum of non-surfactant-specific 36 PCs. Bars represent mean ± SD for each analysis, n = 3 biological replicates separated on day 15; *p % 0.05, **p % 0.01, ***p % 0.001, ****p % 0.0001 by unpaired, two-tailed Student’s t test.
Figure 5
Figure 5. Global Transcriptomic Profiling of PSC-Derived Lung Progenitors and Their Differentiated iAEC2 Progeny
(A) Time points in alveolosphere differentiation from which samples were taken for RNA-seq. (B) Principal-component analysis (PCA) of gene expression variance across all samples based on 30,000 transcripts. (C) Top: qRT-PCR of each sample, with mean fold change (2−ΔΔCt) ± SD, n = 3 biological replicates (RUES2 samples), cells isolated for RNA separately (Wk 21), cells cultured for 4 days separately (Wk 21 DCI), and cells from separate lungs (Adult AEC2). *p % 0.05, **p % 0.01 by unpaired, two-tailed Student’s t test. Bottom: Log2 expression of SFTPC across all samples, with the dotted line representing “noise” because these levels of expression are not consistently detected by qRT-PCR. (D) Heatmap of row-normalized expression of selected lineage markers across PSC-derived and primary samples. (E) Heatmap of the top 10 genes upregulated in day 35 Tom+ cells versus day 15 progenitors (ranked by fold change, FDR % 0.05). Known AEC2 genes are shown in bold. (F) Heatmap of the top 50 genes differentially expressed in day 35 Tom+ cells versus day 15 cells (ranked by FDR, FDR % 0.01). Known AEC2 genes are shown in bold. (G) Heatmap of supervised hierarchical clustering based on the top 300 genes differentially expressed in day 35 Tom+ versus day 15 cells (ranked by absolute fold change, FDR % 0.01). (H) Left: experimental design. Center: western blot for IκB-alpha, phospho-Stat3 (Tyr705), and pan-actin. Right: qRT-PCR of each sample, with mean fold change (2−ΔΔCt) ± SD, n = 3 biological replicates separated on day 35; *p % 0.05, **p % 0.01 by unpaired, two-tailed Student’s t test. See also Figure S5.
Figure 6
Figure 6. Temporal Regulation of Wnt Signaling Promotes iAEC2 Maturation and Proliferation
(A) Heatmap of the top 10 upregulated and downregulated genes in day 35 Tom+ versus Tom− populations (ranked by fold change, FDR % 0.05). (B) Heatmap of selected differentially expressed genes downregulated in Tom+ versus Tom− populations (FDR % 0.05) from the MSigDB v5.1 Hallmark Wnt/β-Catenin Signaling database. Shown is qRT-PCR of day 15 and day 35 Tom− and Day 35 Tom+ samples, with fold change (2−ΔΔCt) ± SD, n = 3 biological replicates. (C) Schematic showing the late CHIR withdrawal experiment. Shown is a representative flow cytometry analysis of day 38 sort gates and day 50 outgrowth of the BU3 NKX2-1GFP+/SFTPCtdTomato− population cultured with or without CHIR from days 40–50. Bars show mean ± SD, n = 3 biological replicates separated on day 38. (D) qRT-PCR of day 50 ± CHIR populations and week 21 human fetal distal lung, with bars representing mean fold change (2−ΔΔCt) ± SD, n = 3 biological replicates from differentiations separated on day 38. (E) Schematic of CHIR addback experiment and representative images of live RUES2 alveolospheres (bright-field/tdTomato overlay; CHIR weeks 4–5 (days 32–39), ± CHIR addback weeks 5–6 (days 39–48). Scale bar, 100 μm. Bar graphs show percent Tom+, total cell number, and total number of Tom+ cells in day 48 populations ± CHIR withdrawal and ± CHIR addback, with 30,000 cells plated on day 32. Bars represent mean ± SD of 3 differentiations separated on day 32. (F) Schematic of putative effects of Wnt stimulation on lung epithelial differentiation. *p % 0.05, **p % 0.01, ***p % 0.001 by unpaired, two-tailed Student’s t test for all panels. See also Figure S6.
Figure 7
Figure 7. iPSC-Derived AEC2s Enable In Vitro Modeling of Genetic Alveolar Disease
For a Figure360 author presentation of Figure 7, see the figure legend at http://dx.doi.org/10.1016/j.stem.2017.08.014 (A) Radiograph and histopathologic samples of lung of a child from which iPSCs were generated. The schematic shows the process of correcting both alleles carrying the homozygous 121ins2 SFTPB mutations in iPSCs derived from dermal fibroblasts, resulting in pre-correction (SP212) and post-correction (SP212Corr) iPSC lines. (B) SFTPB exon4 genomic sequence, with the 121ins2 C > GAA mutation shown in red, CRISPR guide RNA target sequence shown in green, the protospacer adjacent motif (PAM) cutting site shown in blue, and the oligo-based donor design with corrected base shown in red. Pre- and post-correction DNA sequencing chromatograms with yellow boxes show the 121ins2 mutation site sequence. (C) qRT-PCR of day 35 SP212 and SP212Corr alveolospheres, with bars representing mean fold change (2−ΔΔCt) ± SD, n = 3 biological replicates separated on day 0, **p % 0.01 by unpaired, two-tailed Student’s t test. (D) Top: western blot for mature SFTPB (immunoblotted with PT3 antibody) on SP212 and SP212Corr alveolospheres (n = 3 separated on day 15) as well as RUES2 alveolospheres, 6-day DCI-cultured week 21 human fetal distal lung, and lung samples from a different patient with the same SFTPB121ins2 mutation. Bands showing mature 8-kD SFTPB are present only in normal week 21 controls, RUES2 alveolospheres, and SP212Corr alveolospheres (closed arrowhead). Bottom: western blots for mature SFTPB (PT3) and proSFTPC (NPRO-SFTPC) in 2 different alveolosphere samples of SP212 and 1 sample of SP212Corr, all separated on day 0, with an 6- to 10-kD abnormal/misprocessed proSFTPC band (closed arrowhead) present only in the SP212 samples and 8-kD mature SFTPB (open arrowhead) present only in the cultured week 21 and SP212Corr samples. (E) Representative immunofluorescence microscopy of proSFTPB (magenta), NKX2-1 (green), and DNA (Hoechst, gray) in SP212 and SP212Corr alveolospheres. Scale bars, 50 μm. (F) Representative TEM of SP212 and SP212Corr alveolospheres. Scale bars, 500 nm. See also Figure S7.

Comment in

Similar articles

Cited by

References

    1. Ballard PL, Lee JW, Fang X, Chapin C, Allen L, Segal MR, Fischer H, Illek B, Gonzales LW, Kolla V, Matthay MA. Regulated gene expression in cultured type II cells of adult human lung. Am J Physiol Lung Cell Mol Physiol. 2010;299:L36–L50. - PMC - PubMed
    1. Barkauskas CE, Cronce MJ, Rackley CR, Bowie EJ, Keene DR, Stripp BR, Randell SH, Noble PW, Hogan BLM. Type 2 alveolar cells are stem cells in adult lung. J Clin Invest. 2013;123:3025–3036. - PMC - PubMed
    1. Beers MF, Bates SR, Fisher AB. Differential extraction for the rapid purification of bovine surfactant protein B. Am J Physiol. 1992;262:L773–L778. - PubMed
    1. Beers MF, Kim CY, Dodia C, Fisher AB. Localization, synthesis, and processing of surfactant protein SP-C in rat lung analyzed by epitope-specific antipeptide antibodies. J Biol Chem. 1994;269:20318–20328. - PubMed
    1. Beers MF, Hamvas A, Moxley MA, Gonzales LW, Guttentag SH, Solarin KO, Longmore WJ, Nogee LM, Ballard PL. Pulmonary surfactant metabolism in infants lacking surfactant protein B. Am. J Respir Cell Mol Biol. 2000;22:380–391. - PubMed

Publication types

MeSH terms