

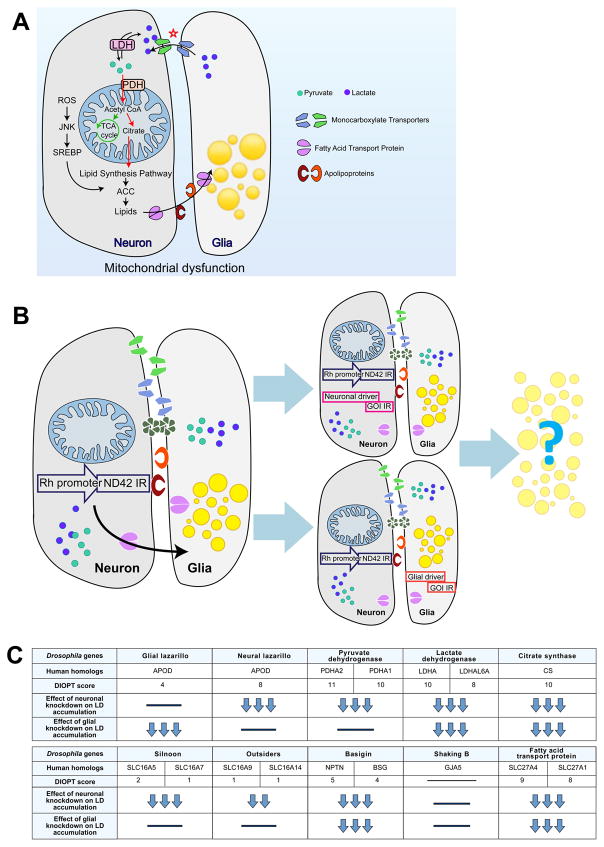
The Glia-Neuron Lactate Shuttle and Elevated ROS Promote Lipid Synthesis in Neurons and Lipid Droplet Accumulation in Glia via APOE/D
- PMID: 28965825
- PMCID: PMC5677551
- DOI: 10.1016/j.cmet.2017.08.024
The Glia-Neuron Lactate Shuttle and Elevated ROS Promote Lipid Synthesis in Neurons and Lipid Droplet Accumulation in Glia via APOE/D
Abstract
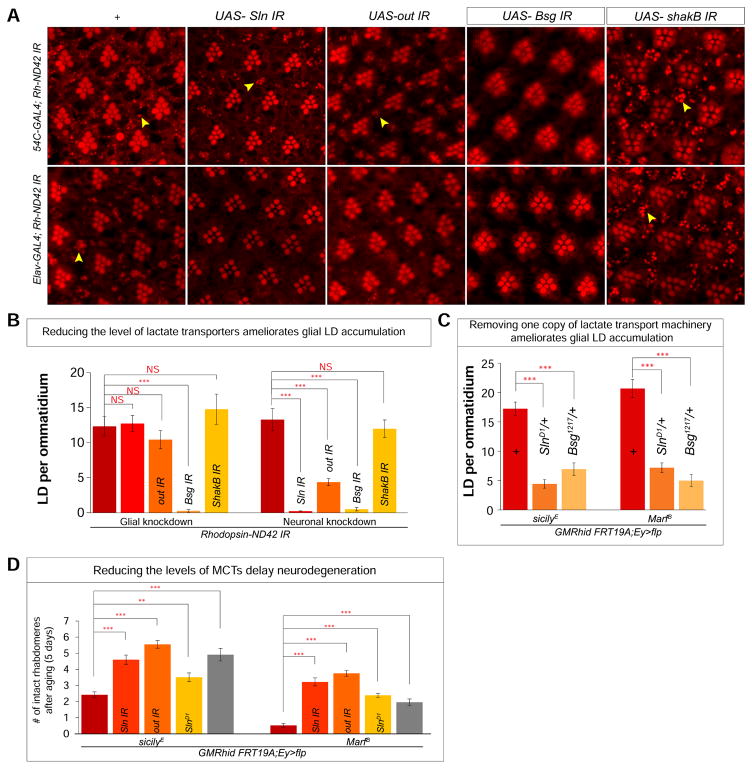
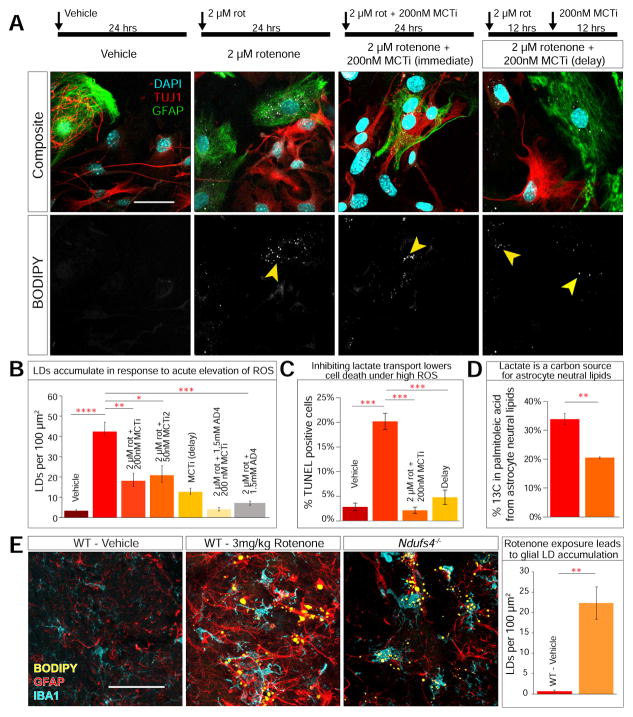
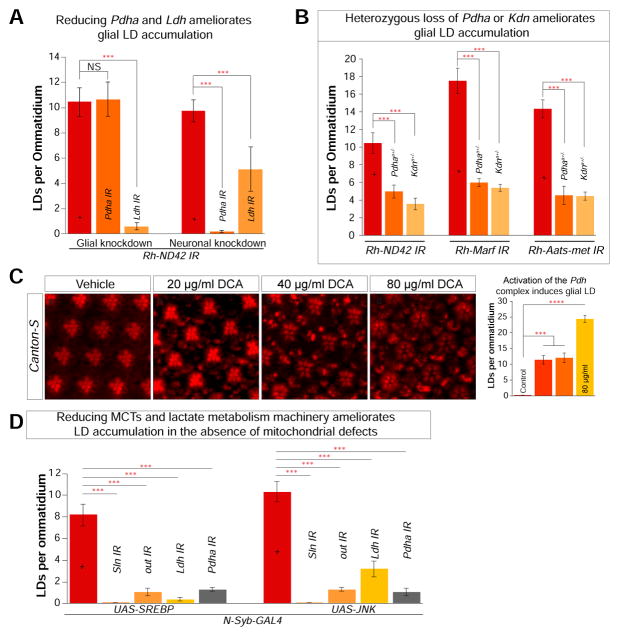
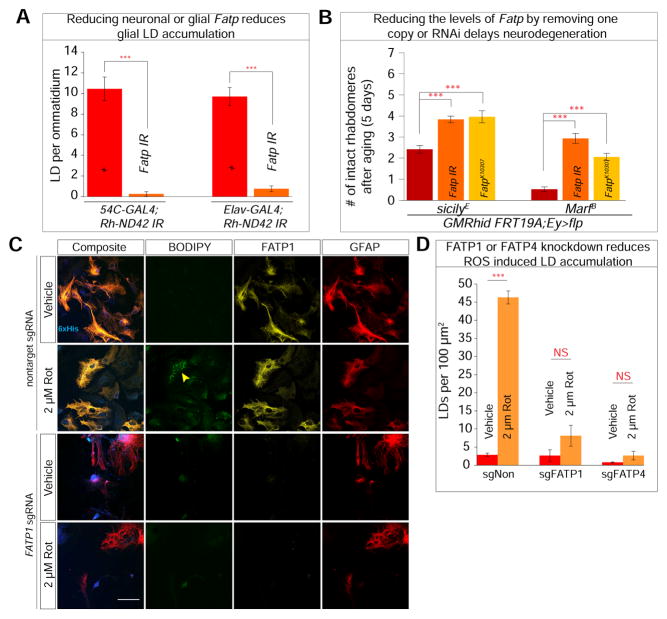
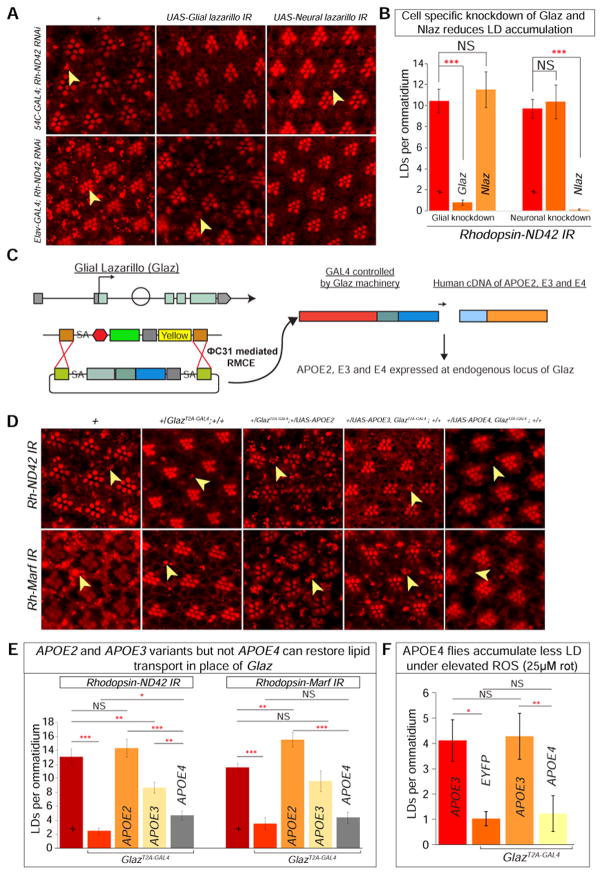
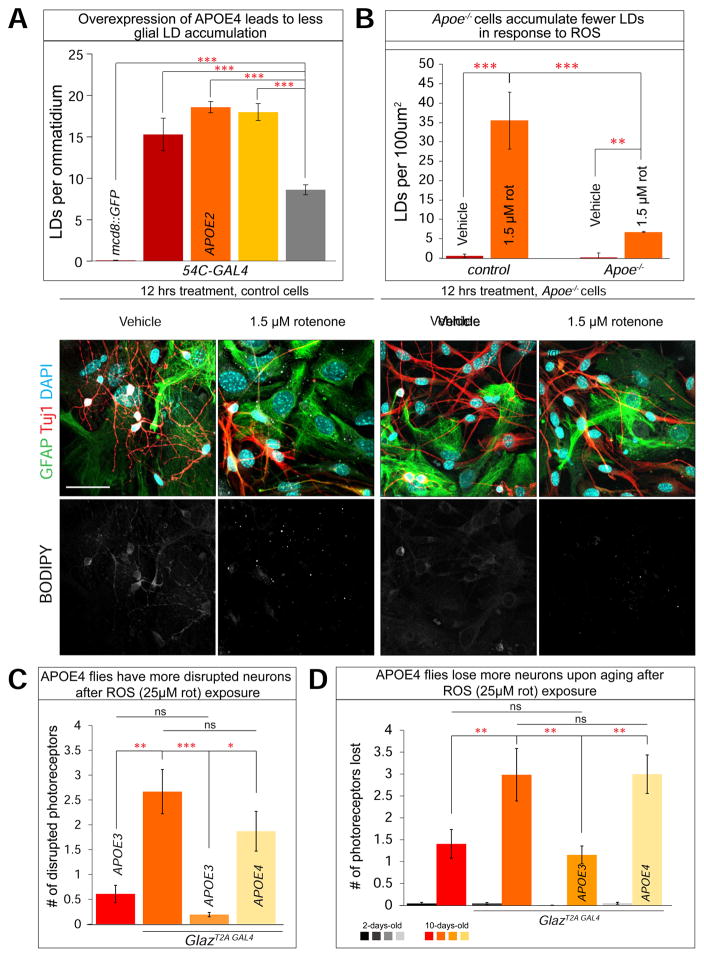
Elevated reactive oxygen species (ROS) induce the formation of lipids in neurons that are transferred to glia, where they form lipid droplets (LDs). We show that glial and neuronal monocarboxylate transporters (MCTs), fatty acid transport proteins (FATPs), and apolipoproteins are critical for glial LD formation. MCTs enable glia to secrete and neurons to absorb lactate, which is converted to pyruvate and acetyl-CoA in neurons. Lactate metabolites provide a substrate for synthesis of fatty acids, which are processed and transferred to glia by FATP and apolipoproteins. In the presence of high ROS, inhibiting lactate transfer or lowering FATP or apolipoprotein levels decreases glial LD accumulation in flies and in primary mouse glial-neuronal cultures. We show that human APOE can substitute for a fly glial apolipoprotein and that APOE4, an Alzheimer's disease susceptibility allele, is impaired in lipid transport and promotes neurodegeneration, providing insights into disease mechanisms.
Keywords: APOE2; APOE3; APOE4; ARSAL; Aats-met; Alzheimer’s disease; CMT2A; Drosophila melanogaster; Leigh syndrome; MARS2; Marf; Mitofusin; Mus musculus; NDUFAF6; astrocytes; reactive oxygen species; sicily.
Copyright © 2017 Elsevier Inc. All rights reserved.
Figures
Comment in
-
Glial Cell Evolution: The Origins of a Lipid Store.Cell Metab. 2017 Nov 7;26(5):701-702. doi: 10.1016/j.cmet.2017.10.011. Cell Metab. 2017. PMID: 29117544
References
-
- Amer J, Atlas D, Fibach E. N-acetylcysteine amide (AD4) attenuates oxidative stress in beta-thalassemia blood cells. Biochim Biophys Acta. 2008;1780:249–255. - PubMed
-
- Anderson R, Barnes JC, Bliss TV, Cain DP, Cambon K, Davies HA, Errington ML, Fellows LA, Gray RA, Hoh T, et al. Behavioural, physiological and morphological analysis of a line of apolipoprotein E knockout mouse. Neuroscience. 1998;85:93–110. - PubMed
-
- Barnerias C, Saudubray JM, Touati G, De Lonlay P, Dulac O, Ponsot G, Marsac C, Brivet M, Desguerre I. Pyruvate dehydrogenase complex deficiency: four neurological phenotypes with differing pathogenesis. Dev Med Child Neurol. 2010;52:e1–9. - PubMed
MeSH terms
Substances
Grants and funding
LinkOut - more resources
Full Text Sources
Other Literature Sources
Molecular Biology Databases
Research Materials
Miscellaneous
