. 2017 Nov 6;10(11):1400-1416.
doi: 10.1016/j.molp.2017.09.012. Epub 2017 Sep 28.

Initiation of ER Body Formation and Indole Glucosinolate Metabolism by the Plastidial Retrograde Signaling Metabolite, MEcPP

Affiliations

Initiation of ER Body Formation and Indole Glucosinolate Metabolism by the Plastidial Retrograde Signaling Metabolite, MEcPP

Jin-Zheng Wang et al. Mol Plant. .

Abstract

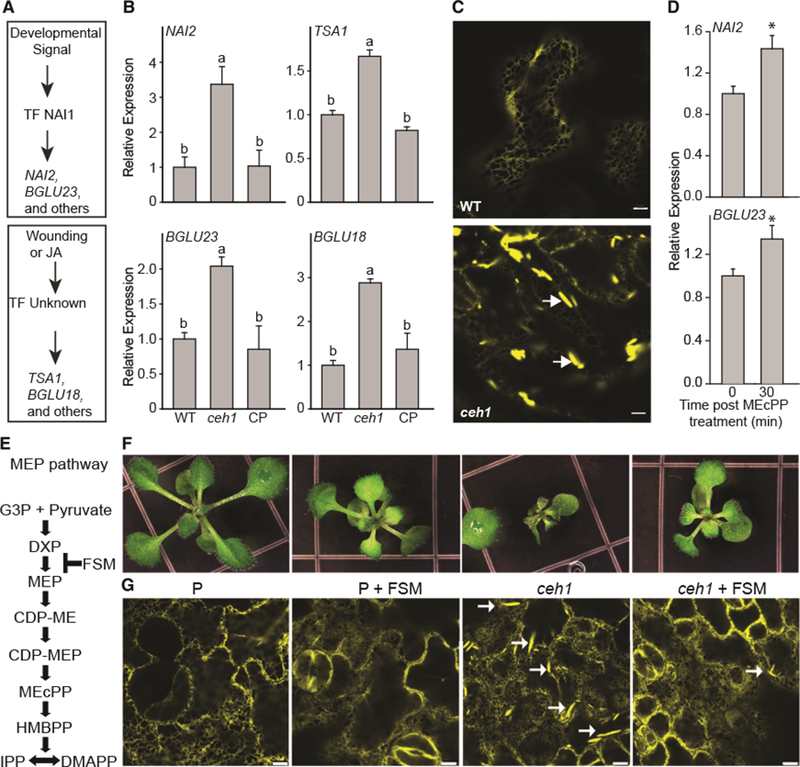
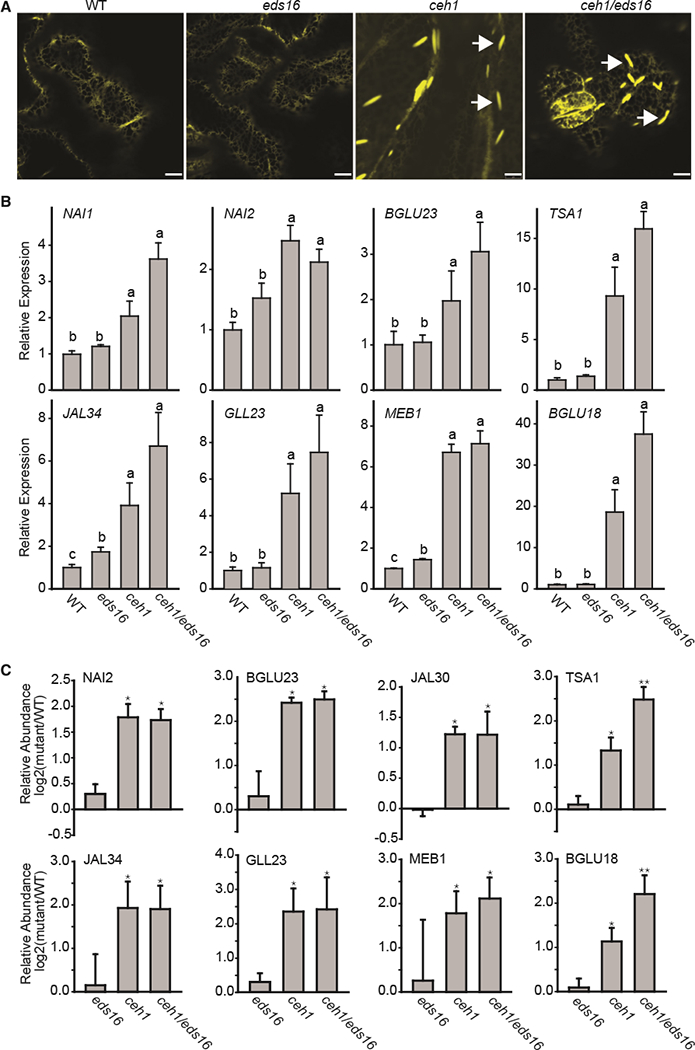
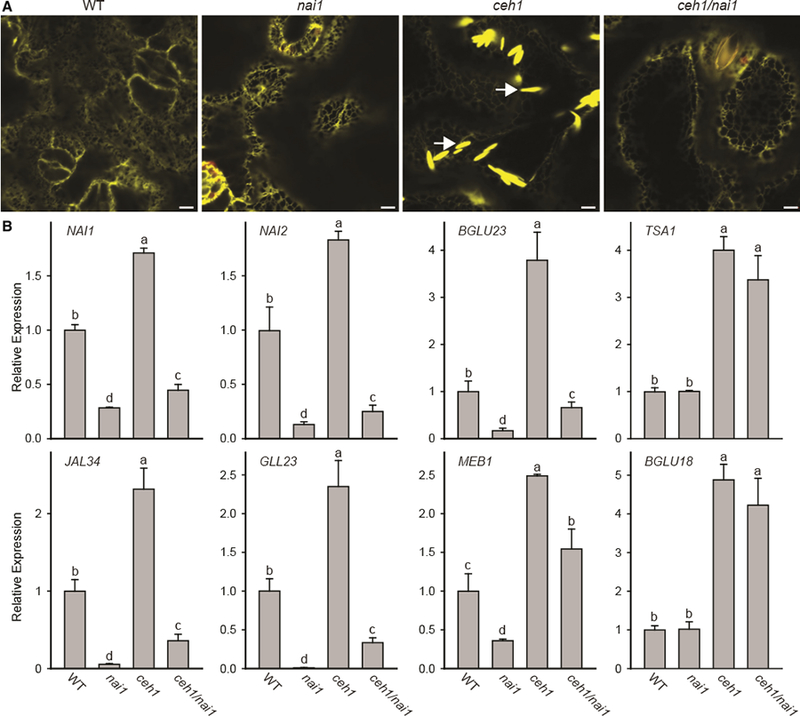
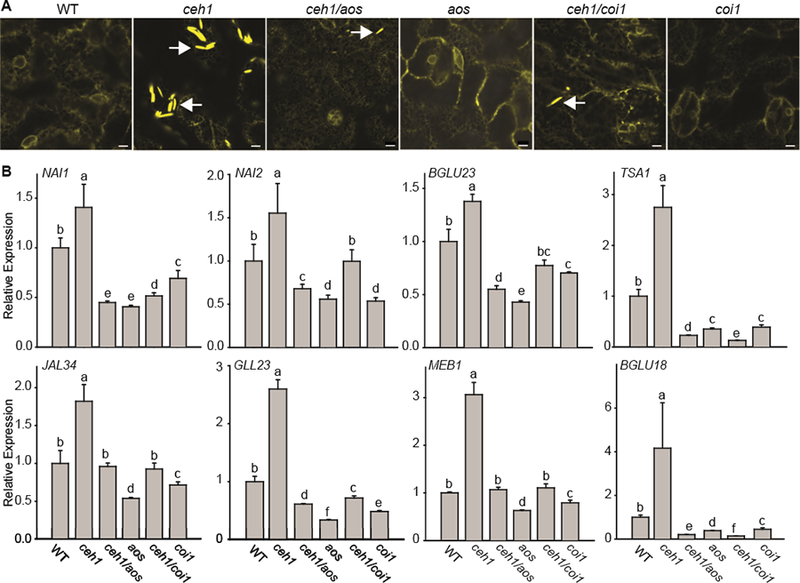
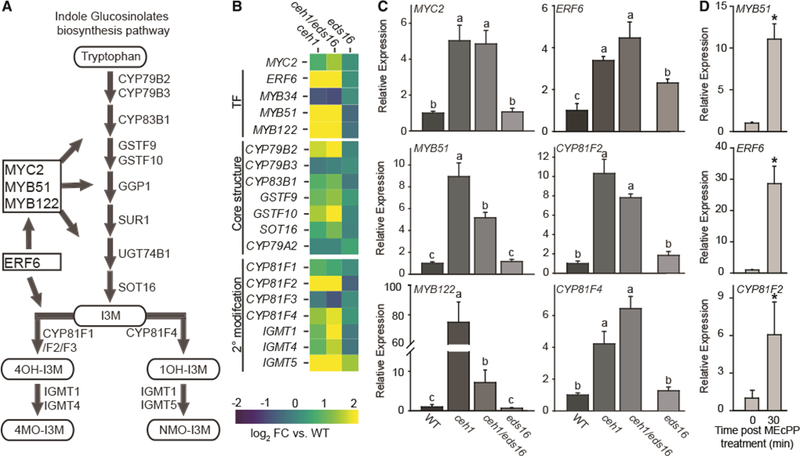
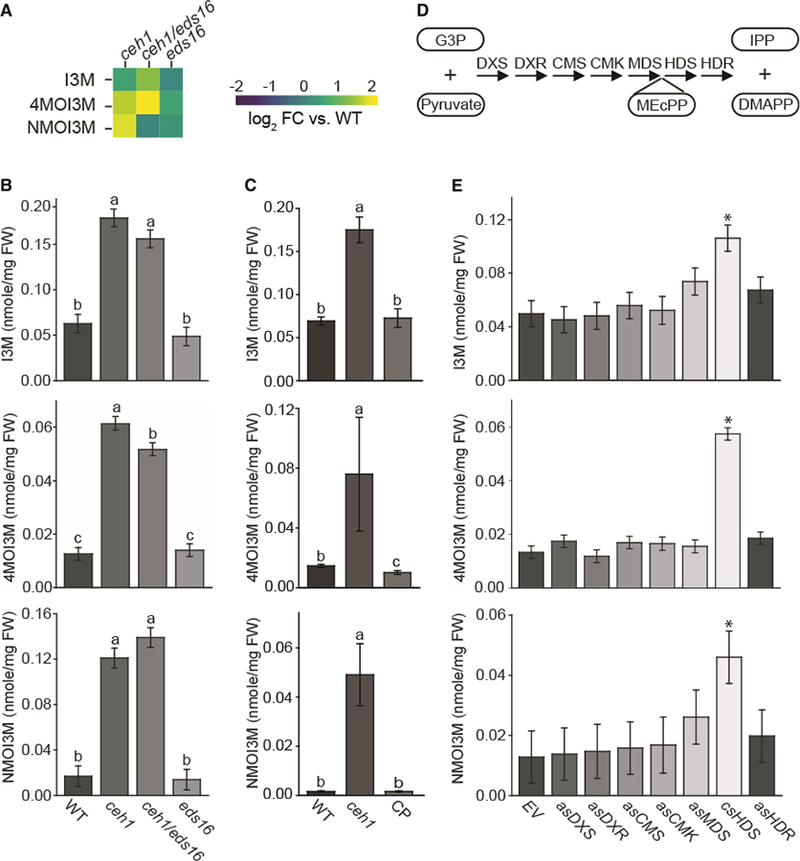
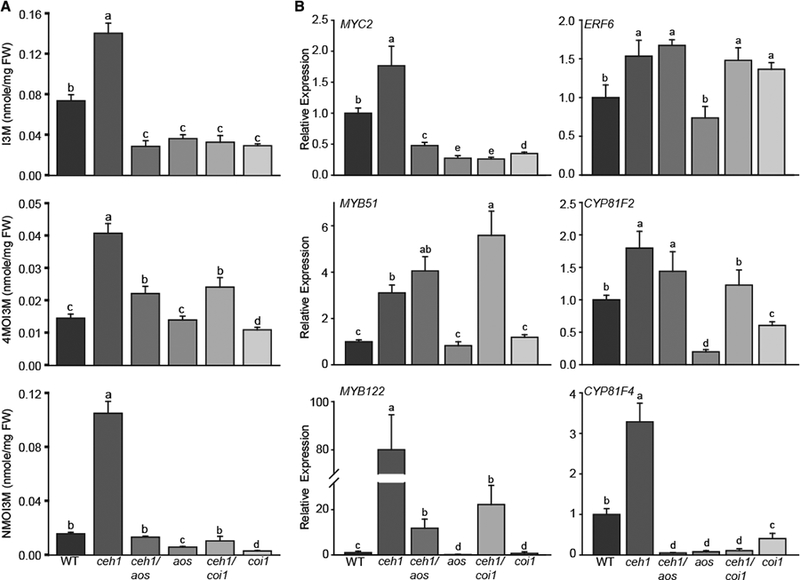
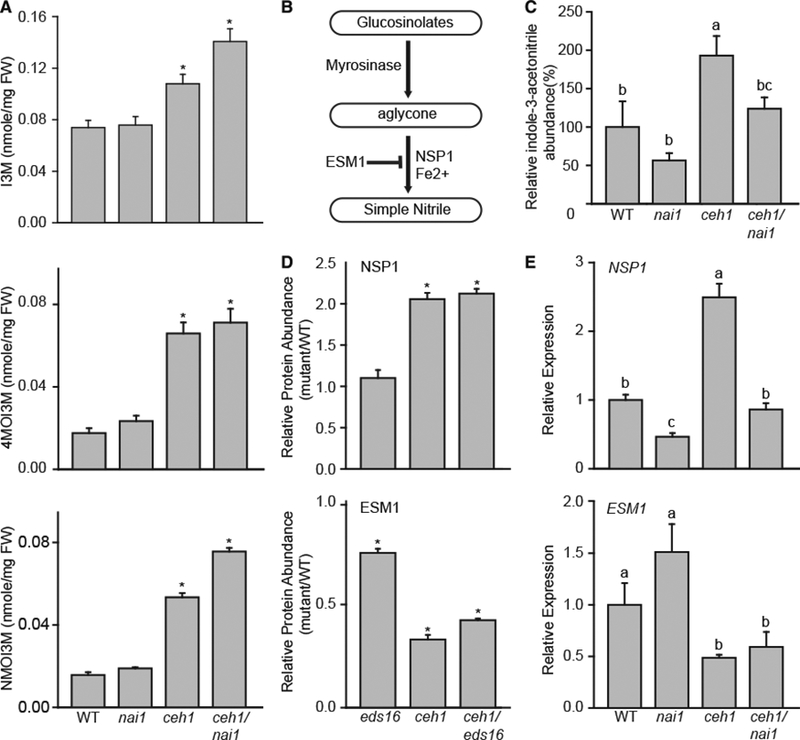
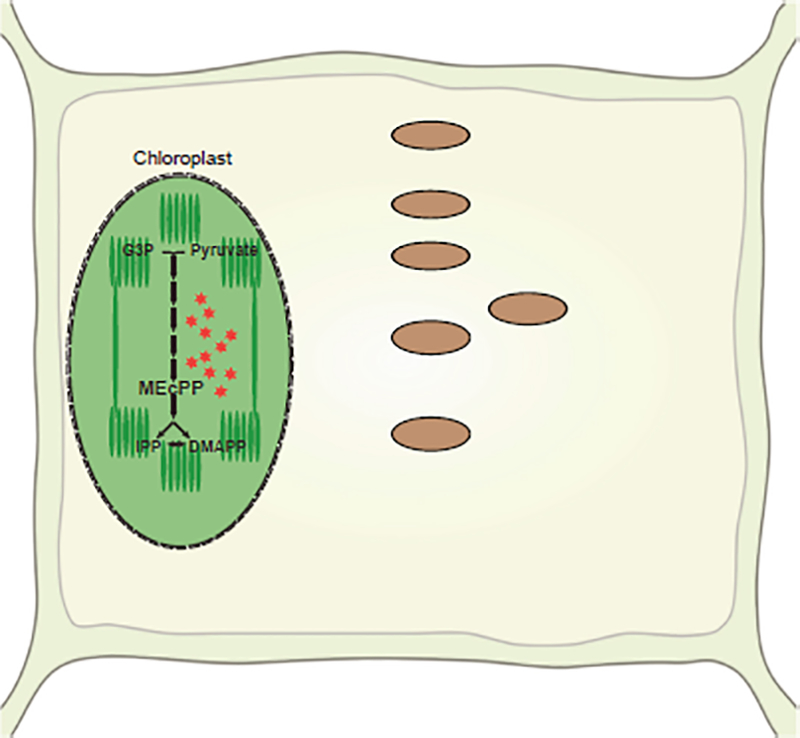
Plants have evolved tightly regulated signaling networks to respond and adapt to environmental perturbations, but the nature of the signaling hub(s) involved have remained an enigma. We have previously established that methylerythritol cyclodiphosphate (MEcPP), a precursor of plastidial isoprenoids and a stress-specific retrograde signaling metabolite, enables cellular readjustments for high-order adaptive functions. Here, we specifically show that MEcPP promotes two Brassicaceae-specific traits, namely endoplasmic reticulum (ER) body formation and induction of indole glucosinolate (IGs) metabolism selectively, via transcriptional regulation of key regulators NAI1 for ER body formation and MYB51/122 for IGs biosynthesis). The specificity of MEcPP is further confirmed by the lack of induction of wound-inducible ER body genes as well as IGs by other altered methylerythritol phosphate pathway enzymes. Genetic analyses revealed MEcPP-mediated COI1-dependent induction of these traits. Moreover, MEcPP signaling integrates the biosynthesis and hydrolysis of IGs through induction of nitrile-specifier protein1 and reduction of the suppressor, ESM1, and production of simple nitriles as the bioactive end product. The findings position the plastidial metabolite, MEcPP, as the initiation hub, transducing signals to adjust the activity of hard-wired gene circuitry to expand phytochemical diversity and alter the associated subcellular structure required for functionality of the secondary metabolites, thereby tailoring plant stress responses.

Keywords: ER body; MEP pathway; MEcPP; glucosinolates; retrograde signaling; stress.


Figures

Figure 1.
Figure 1.. Stress-lnducible ER Bodies Are Constitutive in the ceh1 Mutant.
(A) Depiction of ER body marker genes induced by developmental or stress signals. (B) Relative expression levels of genes regulated by developmental (NAI2 and BGLU23) and stress (TSA1 and BGLU18) signals, in WT, ceh1, and ceh1 complemented (CP) lines. Total RNA extracted from these genotypes was subjected to real-time qPCR analysis. The transcript levels were normalized to At4g26410 (M3E9) measured in the same samples. Data are the mean fold difference ± SD of three biological replicates each with three technical repeats. Different letters represent statistically significant differences (p < 0.05). p values were determined by Student’s t-test. (C) Representative confocal images of WT and the ceh1 mutant rosette leaves depicting constitutive presence of otherwise wound-inducible ER bodies exclusively in ceh1. White arrows show the ER body. Bars, 5 μm. (D) Relative expression levels of genes in WT plants treated exogenously with MEcPP. The transcript levels were normalized to At4g26410 (M3E9) measured in the same samples. Data are the mean fold difference ± SD of three biological replicates each with three technical repeats. Asterisks show the statistically significant differences relative to time 0 (p < 0.05). p values were determined by Student’s t-test. (E) Schematic presentation of the MEP pathway depicting the site of fosmidomycin (FSM) action. (F and G) Representative images of seedlings (F) together with the confocal images depicting ER body structure selectively shown by white arrows (G), grown in the presence (+) or absence (−) of FSM. Bars, 5 μm.
Figure 2.
Figure 2.. Constitutive Presence of ER Bodies in the ceh1 Is SA Independent.
(A) Representative confocal images of WT, the SA-deficient mutant eds16, ceh1, and ceh1/eds16 leaves depicting constitutive presence of otherwise wound-inducible ER bodies independently of SA in ceh1 mutant backgrounds. White arrows show the ER body. Bars, 5 μm. (B) Relative expression levels of ER marker genes in the aforementioned genotypes. Total RNA extracted from these genotypes was subjected to real-time qPCR analysis. The transcript levels were normalized to At4g26410 (M3E9) measured in the same samples. Data are the mean fold difference ± SD of three biological replicates each with three technical repeats. Different letters represent statistically significant differences (p < 0.05). (C) Normalized iTRAQ protein abundance ratios of detected ER marker proteins in mutants (eds16, ceh1, and ceh1/eds16) relative to the WT plants. Data are means of n = 3 ± SEM. Single and double asterisks denote a statistically significant difference relative to WT and ceh1, respectively (p < 0.05) as determined by t-tests.
Figure 3.
Figure 3.. ER Body Formation in the ceh1 Mutant Is NAI1 Dependent.
(A) Representative confocal images of WT, nai1, ceh1, and ceh1/nai1 leaves depicting the NAI1-dependent constitutive presence of otherwise wound-inducible ER bodies the in ceh1 mutant background. White arrows show the ER body. Bars, 5 μm. (B) Relative expression levels of ER marker genes in the aforementioned genotypes. Total RNA extracted from these genotypes was subjected to real-time qPCR analysis. The transcript levels were normalized to At4g26410 (M3E9) measured in the same samples. Data are the mean fold difference ± SD of three biological replicates each with three technical repeats. Different letters represent significant differences (p < 0.05). p values were determined by Student’s t-test.
Figure 4.
Figure 4.. Constitutive ER Body Formation in ceh1 Is Dependent on the Jasmonate Signaling Pathway.
(A) Representative confocal images of WT, ceh1, ceh1/aos, aos, ceh1/coi1, and coi1 leaves depicting the jasmonate-dependent constitutive presence of otherwise wound-inducible ER bodies in the ceh1 mutant background. White arrows show the ER body. Bars, 5 μm. (B) Relative expression levels of ER marker genes in the aforementioned genotypes. Total RNA extracted from these genotypes was subjected to real-time qPCR analysis. The transcript levels were normalized to At4g26410 (M3E9) measured in the same samples. Data are the mean fold difference ± SD of three biological replicates each with three technical repeats. Different letters represent statistically significant differences (p < 0.05). p values were determined by Student’s t-test.
Figure 5.
Figure 5.. MEcPP Mediates Induction of Genes Associated with Indole Glucosinolate Synthesis.
(A) Schematic of the indole glucosinolate (IGs) biosynthesis pathway depicting the TFs in boxes and the enzyme substrates lassoed. (B) Heatmap of genes within each IG category (TFs, the core structure synthesis, and 2° modification proteins). The log2 fold change for ceh1 (left), ceh1/eds16 (middle), and eds16 (right) versus WT is represented by color, from −2 (blue) to 2 (yellow). (C) Relative expression levels of selected genes within each of the three aforementioned categories. Total RNA extracted from these genotypes was subjected to real-time qPCR analysis. The transcript levels were normalized to At4g26410 (M3E9) measured in the same samples. Data are the mean fold difference ± SD of three biological replicates each with three technical repeats. Different letters represent significant differences (p < 0.05). p values were determined by Student’s t-test. (D) Relative expression levels of genes in WT plants treated exogenously with MEcPP. The transcript levels were normalized to At4g26410 (M3E9) measured in the same samples. Data are the mean fold difference ± SD of three biological replicates each with three technical repeats. Asterisks show the statistically significant differences relative to time 0 (p < 0.05). p values were determined by Student’s t-test.
Figure 6.
Figure 6.. MEcPP Specifically Induces the Production of IGs.
(A) Heatmap of IG levels in ceh1, ceh1/eds16, and eds16 relative to WT extracted from the metabolomics analyses using LC-MS-based methods. The log2 fold change is presented by color, from −2 (blue) to 2 (yellow). (B and C) HPLC-based targeted measurements of IG levels in WT, ceh1, ceh1/eds16, and eds16 (B), and in WT, ceh1, and HDS complementation line (CP) (C). Data are means ± SEM; n = 3. Different letters represent statistically significant differences (p < 0.05). (D) Schematic of the MEP-pathway genes and lassoed selected metabolites involved. (E) Measurement of IG levels in WT transformed with empty vector (EV), RNAi lines silencing MEP-pathway genes individually, and co-suppressed HDS (csHDS). Data are means ± SEM; n = 3. Asterisks show the statistically significant differences relative to EV (p < 0.05). All the statistical analyses were performed using ANOVA.
Figure 7.
Figure 7.. MEcPP-Mediated Selective Induction of IGs Is COI1 Dependent.
(A) HPLC-based measurement of IG levels in WT, ceh1, ceh1/aos, aos, ceh1/coi1, and coi1. Data are means ± SEM; n = 3. Different letters represent significant differences (p < 0.05). p values were determined by ANOVA. (B) Relative expression levels of IG-associated genes encoding transcription factors (MYC2, ERF2, MYB51, and MYB122) and biosynthetic enzymes (CYP81F2, CYP81F4) in the aforementioned genotypes by qRT-PCR. Total RNA extracted from these genotypes was subjected to real-time qPCR analysis. The transcript levels were normalized to At4g26410 (M3E9) measured in the same samples. Data are the mean fold difference ± SD of three biological replicates each with three technical repeats. Different letters represent significant differences (p < 0.05). p values were determined by Student’s t-test.
Figure 8.
Figure 8.. MEcPP-Mediated Induction of Simple Nitriles Is Partially NAI1 Dependent.
(A) HPLC-based measurement of IG levels in WT, nai1, ceh1, and ceh1/nai1. Data are means ± SEM; n = 3. Asterisks show the statistically significant differences relative to WT (p < 0.05). (B) Schematic of IG hydrolysis with intermediate and terminal products lassoed and associated enzymes and cofactors. (C) Relative levels of indole-3-acetonitrile in WT, nai1, ceh1, and ceh1/nai1 measured by LC-MS. Data are means ± SEM; n = 4. Letters represent significant differences if not shared (p < 0.05). (D) Normalized protein abundance of NSP1 and ESM1 (eds16, ceh1, and ceh1/eds16) relative to the WT plants. Data are means ± SEM, n = 3. Asterisks denote a statistically significant difference relative to WT (p < 0.05). (E) Relative expression levels of NSP1 and ESM1 in WT, nai1, ceh1, and ceh1/nai1. Data are means ± SEM; n = 4. Letters represent statistically significant differences if not shared (p < 0.05). P values were determined by Student’s t-test for (C-E).
Figure 9.
Figure 9.. Simplified Schematic Models of MEcPP-Mediated Induction of IG Biosynthesis/Breakdown and the Associated ER Body Formation.
Stress-induced accumulation of MEcPP enables readjustment of the activity of hard-wired gene circuitry (lassoed), resulting in alteration of the levels of IG biosynthesis and hydrolytic products (boxed), and the formation of the associated cellular infrastructure ER bodies.

Similar articles

Cited by

References

    1. Agee AE, Surpin M, Sohn EJ, Girke T, Rosado A, Kram BW, Carter C, Wentzell AM, Kliebenstein DJ, Jin HC, et al. (2010). MODIFIED VACUOLE PHENOTYPE1 is an Arabidopsis myrosinase-associated protein involved in endomembrane protein trafficking. Plant Physiol. 152:120–132. - PMC - PubMed
    1. Ahn YO, Shimizu BI, Sakata K, Gantulga D, Zhou CH, Bevan DR, and Esen A (2010). Scopolin-hydrolyzing beta-glucosidases in roots of Arabidopsis. Plant Cell Physiol. 51:132–143, - PubMed
    1. Andreasson E, Bolt Jorgensen L, Hoglund AS, Rask L, and Meijer J (2001). Different myrosinase and idioblast distribution in Arabidopsis and Brassica napus. Plant Physiol. 127:1750–1763. - PMC - PubMed
    1. Barth C, and Jander G (2006). Arabidopsis myrosinases TGG1 and TGG2 have redundant function in glucosinolate breakdown and insect defense. Plant J. 46:549–562. - PubMed
    1. Bednarek P (2012). Chemical warfare or modulators of defence responses - the function of secondary metabolites in plant immunity. Curr. Opin. Plant Biol. 15:407–414. - PubMed

Publication types

MeSH terms