. 2017 Oct 5;101(4):564-577.
doi: 10.1016/j.ajhg.2017.08.016. Epub 2017 Sep 28.

The Immune Signaling Adaptor LAT Contributes to the Neuroanatomical Phenotype of 16p11.2 BP2-BP3 CNVs

Collaborators, Affiliations

The Immune Signaling Adaptor LAT Contributes to the Neuroanatomical Phenotype of 16p11.2 BP2-BP3 CNVs

Maria Nicla Loviglio et al. Am J Hum Genet. .

Abstract

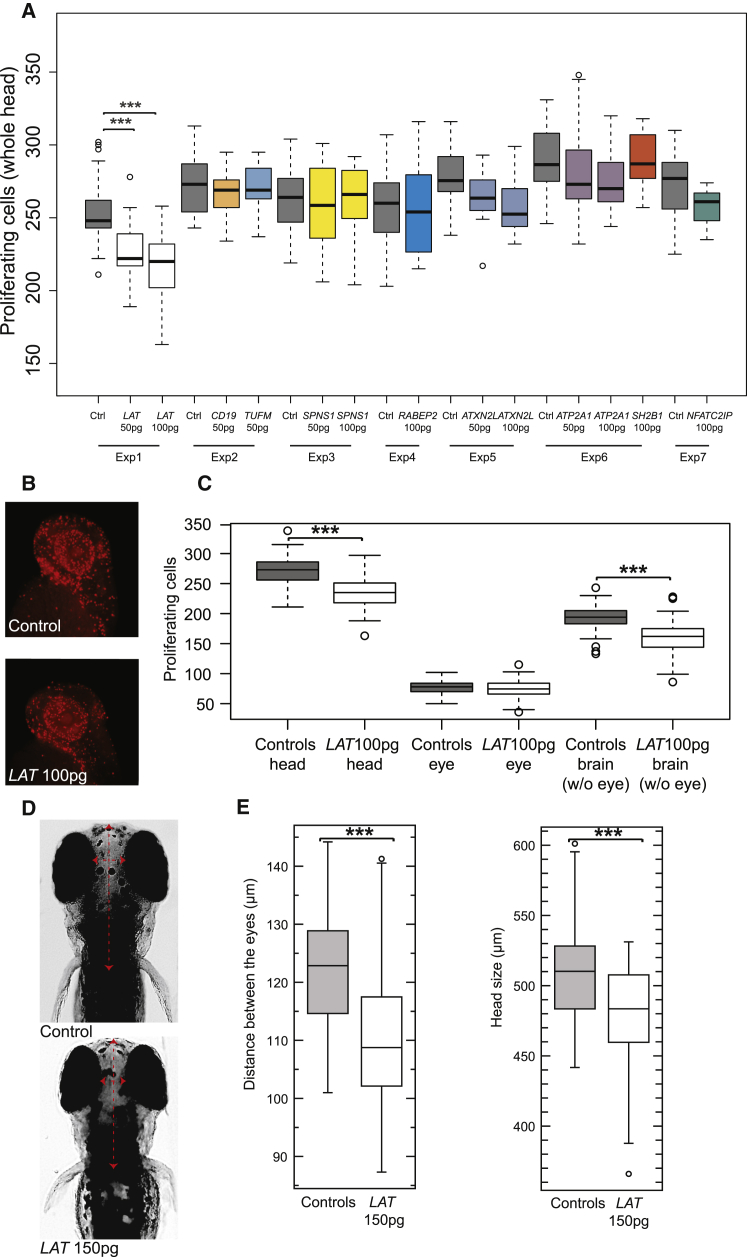
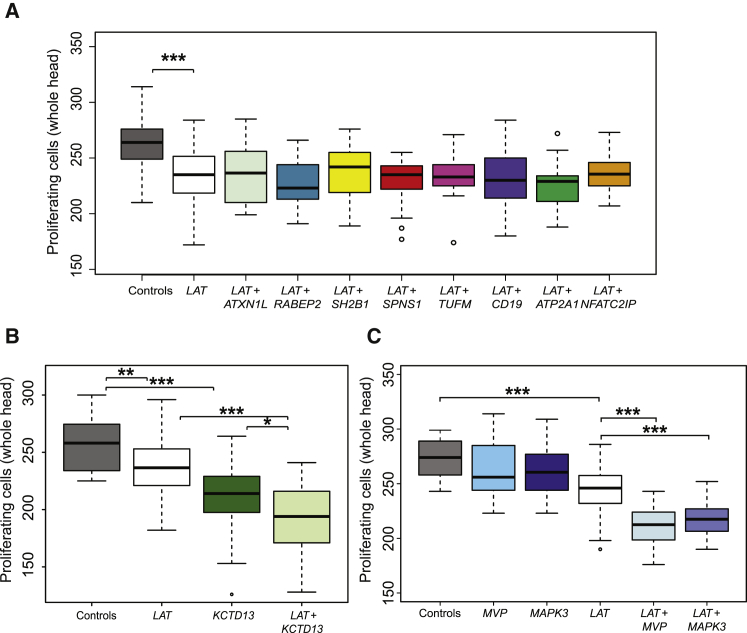
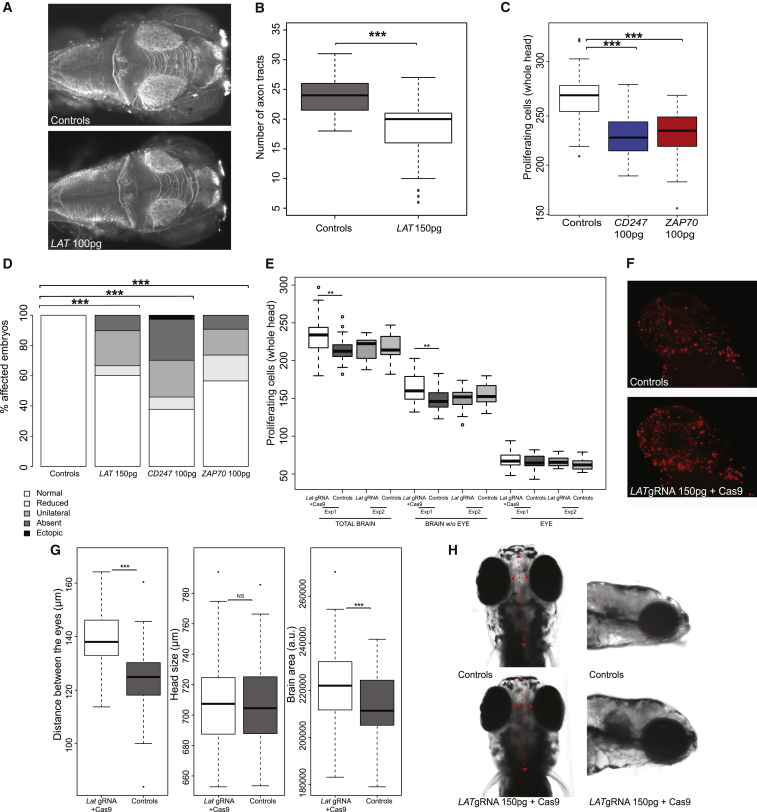
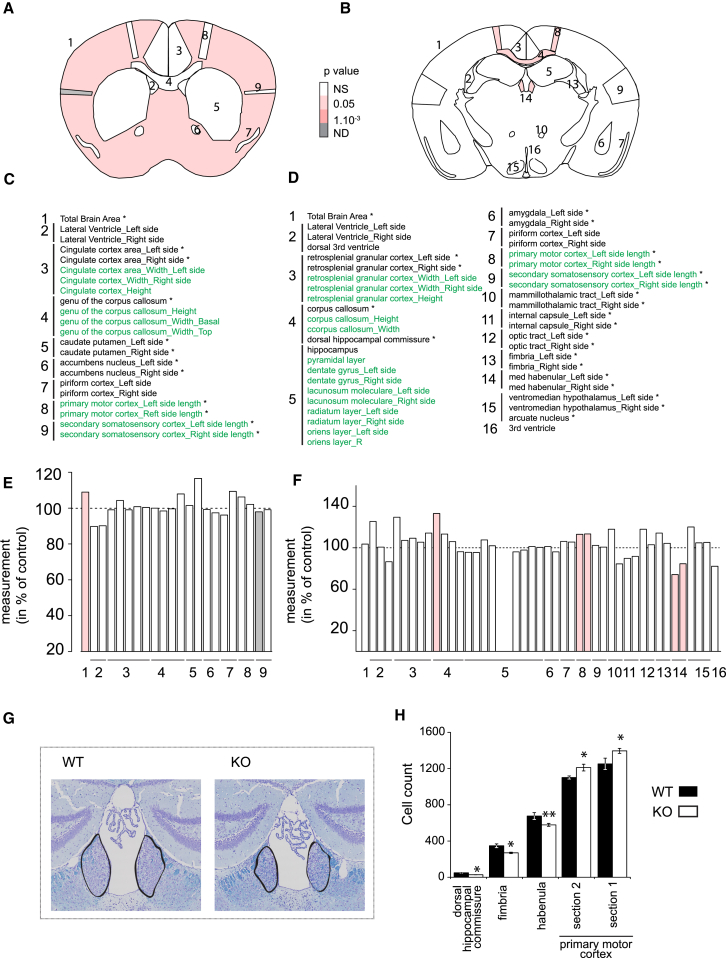
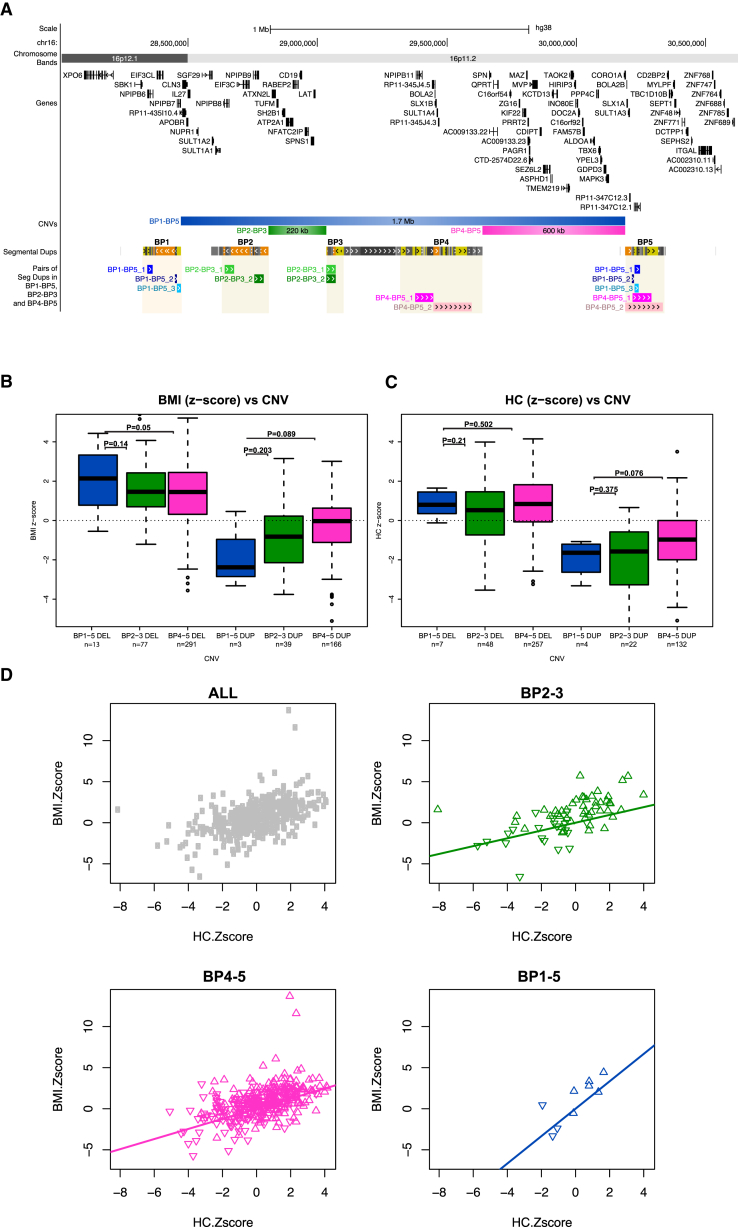
Copy-number changes in 16p11.2 contribute significantly to neuropsychiatric traits. Besides the 600 kb BP4-BP5 CNV found in 0.5%-1% of individuals with autism spectrum disorders and schizophrenia and whose rearrangement causes reciprocal defects in head size and body weight, a second distal 220 kb BP2-BP3 CNV is likewise a potent driver of neuropsychiatric, anatomical, and metabolic pathologies. These two CNVs are engaged in complex reciprocal chromatin looping, intimating a functional relationship between genes in these regions that might be relevant to pathomechanism. We assessed the drivers of the distal 16p11.2 duplication by overexpressing each of the nine encompassed genes in zebrafish. Only overexpression of LAT induced a reduction of brain proliferating cells and concomitant microcephaly. Consistently, suppression of the zebrafish ortholog induced an increase of proliferation and macrocephaly. These phenotypes were not unique to zebrafish; Lat knockout mice show brain volumetric changes. Consistent with the hypothesis that LAT dosage is relevant to the CNV pathology, we observed similar effects upon overexpression of CD247 and ZAP70, encoding members of the LAT signalosome. We also evaluated whether LAT was interacting with KCTD13, MVP, and MAPK3, major driver and modifiers of the proximal 16p11.2 600 kb BP4-BP5 syndromes, respectively. Co-injected embryos exhibited an increased microcephaly, suggesting the presence of genetic interaction. Correspondingly, carriers of 1.7 Mb BP1-BP5 rearrangements that encompass both the BP2-BP3 and BP4-BP5 loci showed more severe phenotypes. Taken together, our results suggest that LAT, besides its well-recognized function in T cell development, is a major contributor of the 16p11.2 220 kb BP2-BP3 CNV-associated neurodevelopmental phenotypes.

Keywords: 16p11.2; autism; epistasis; genome architecture; head size; obesity; zebrafish.


Figures

Figure 1
Figure 1
LAT Overexpression Is Associated with a Decrease of Cell Proliferation in the Brain (A) Boxplots of the number of proliferating phospho-histone H3-stained brain cells upon injection of human mRNA of CD19, NFATC2IP, ATXN2L, TUFM, ATP2A1, RABEP2, SPNS1, LAT, and SH2B1, the nine genes mapping within the 16p11.2 220 kb BP2-BP3 interval, in 2 dpf zebrafish embryos. Each gene was assessed in different experiments (exp) and whenever possible using both 50 and 100 pg of mRNA (Material and Methods). All quantifications are performed with ImageJ software. Average n = 20 for each subgroup. (B) Representative examples of uninjected and LAT-injected zebrafish embryos stained with anti-phospho-histone H3 for assessment of proliferation. (C) Boxplots of the number of phospho-histone H3-stained cells in the whole brain (left), the eye (center), and the brain excluding the eye (right) upon injection of 100 pg of human LAT in 2 dpf zebrafish embryos. Average n = 80 for each subgroup. (D and E) Boxplots (E) of the distance between the eye (left) and head size (i.e., anterior-most part of the forebrain until the hindbrain of the fish, right) upon injection of 150 pg of human LAT in 4.5 dpf zebrafish embryos. Representative examples of uninjected and LAT-injected animals are presented in (D). Average n = 60 per injection. Significance was calculated by two-tailed t test comparisons between control and mRNA-injected embryos (p ≤ 0.05, ∗∗p ≤ 0.01, ∗∗∗p ≤ 0.001).
Figure 2
Figure 2
LAT Genetically Interacts with KCTD13, MVP, and MAPK3 (A) Boxplots of the number of proliferating phospho-histone H3-stained brain cells upon pairwise injections of 100 pg LAT mRNA and 100 pg of the eight other mRNAs encoded by the 16p11.2 BP2-BP3 genes. Co-injections of CD19, NFATC2IP, ATXN2L, TUFM, ATP2A1, RABEP2, SPNS1, and SH2B1 have no effect on LAT overexpression’s induced phenotype. (B and C) Boxplots of the number of proliferating phospho-histone H3-stained cells in the brain upon pairwise injections of 100 pg LAT mRNA and 100 pg of KCTD13, MVP, and MAPK3, the major driver and modifiers of the 16p11.2 600 kb BP4-BP5 syndromes, respectively. Additive and epistatic effects are observed in the LAT/KCTD13 (B), LAT/MAPK3, and LAT/MVP cocktails (C), respectively. Average n = 40 for each subgroup. Significance was calculated by two-tailed t test comparisons between control and mRNA-injected embryos (p ≤ 0.05, ∗∗p ≤ 0.01, ∗∗∗p ≤ 0.001).
Figure 3
Figure 3
The Overexpression of LAT and Its Signalosome Partners CD247 and ZAP70 Affects Neuron Morphology and Maturation whereas Its Suppression Is Associated with Increase in Brain Cell Numbers and Size (A) Dorsal views of control and LAT mRNA-injected embryos at 3 dpf stained with anti-acetylated tubulin (AcTub). (B) Boxplots of inter-tecta axonal tracts’ count after acetylated Tubulin staining of 3 dpf control embryos and embryos injected with 150 pg of LAT. Average n = 80 for each subgroup. (C) Boxplots of phospho-histone H3 staining quantification of proliferating cells in the zebrafish brain of 2 dpf control embryos, and embryos injected with CD247 isoform1 and ZAP70 isoform1. Average n = 60 for each group. (D) Percentage of 2 dpf embryos with normal bilateral HuC/D protein levels (white) or unilateral HuC/D (gray), ectopic (black), and absent (dark gray)/reduced protein levels (light gray) in the anterior forebrain in embryo batches injected with LAT 150 pg, CD247 100 pg, and ZAP70 100 pg mRNAs. HuC/D levels in the anterior forebrain of the embryo injected with all three mRNAs are considerably decreased compared to those of the control embryo. Significance was estimated by two-tailed t test comparisons between control and mRNA-injected embryos (B and C); enrichment of “abnormal” pattern of HuC/D staining in the injected embryos versus controls was calculated by Fisher’s exact test (D) (p ≤ 0.05, ∗∗p ≤ 0.01, ∗∗∗p ≤ 0.001). (E and F) Boxplots (E) of the number of phospho-histone H3-stained cells in the whole brain (left), the eye (center), and the brain excluding the eye upon injection of 150 pg of lat guide RNA and Cas9 protein, lat guide RNA only and uninjected controls in 2 dpf zebrafish embryos (assessed in different experiments with respective uninjected controls). Representative examples of uninjected and lat guide RNA and Cas9-injected animals phospho-histone H3-stained for proliferation are presented in (F). Average n = 60 for each subgroup. (G and H) Boxplots (G) of the distance between the eyes (left), head size (i.e., anterior-most part of the forebrain until the hindbrain of the fish, middle part), and head area (measured on lateral view from the fish’s mouth until the anterior part of the trunk, right) upon injection of 150 pg of lat guide RNA and Cas9 in 4.5 dpf zebrafish embryos compared to uninjected controls. Representative images of uninjected CRISPR animals in dorsal and lateral views are presented in (H), respectively. Average n = 80 per subgroup. Significance was calculated by two-tailed t test comparisons between control and CRISPR embryos (p ≤ 0.05, ∗∗p ≤ 0.01, ∗∗∗p ≤ 0.001).
Figure 4
Figure 4
Lat Knockout Mice Present Morphological and Cellular Neuroanatomical Defects (A and B) Schematic representation of brain regions modified in Lat−/− animal models plotted in coronal planes according to p values at Bregma 0.98 mm (A) and −1.34 mm (B). (C and D) Catalog of the 63 assessed brain measured in Bregma 0.98 mm (C) and −1.34 mm (D): 1, total brain area; 2, lateral ventricles; 3, cingulate cortex (Bregma 0.98 mm) and retrosplenial cortex (−1.34 mm); 4, corpus callosum; 5, caudate putamen (0.98 mm) and hippocampus (−1.34 mm); 6 = anterior commissure (0.98 mm) and amygdala (−1.34 mm); 7, piriform cortex; 8, motor cortex; 9, somatosensory cortex; 10, mammilothalamic tract; 11, internal capsule; 12, optic tract; 13, fimbria of the hippocampus; 14, habenula; 15, ventromedial hypothalamus; and 16, third ventricle. Green refers to length and black to area measurements. (E and F) Histograms showing the percentage increase or decrease of measured brain regions in Lat−/− mice as compared to the controls (100%) at Bregma 0.98 mm (E) and −1.34 mm (F). White coloring indicates a p value higher than 0.05 and gray to case subjects where the p value could not be computed due to missing data. (G) Representative coronal brain images of wild-type (left) and Lat−/− mice (right), stained with Luxol and Nissl, showing a significantly smaller area of habenula in knockouts when compared to matched wild-type. (H) Areas in which cell counts were significantly affected. Bar graph shows total cell counts for WT (dark bars) and Lat−/− animals (open bars). p < 0.05, ∗∗p < 0.005.
Figure 5
Figure 5
Carriers of 16p11.2 1.7 Mb BP1-BP5 Rearrangements Exhibit More Severe Phenotypes than Carriers of 16p11.2 220 kb BP2-BP3 and 16p11.2 600 kb BP4-BP5 CNVs (A) From top to bottom: UCSC Genome browser view of human chromosome 16 coordinates and cytobands; schematic representation of coding genes (GENCODE v.24) mapping within the distal part of 16p11.2; extent of the three recurrent and clinically relevant 16p11.2 CNVs discussed in this paper, i.e., 1.7 Mb BP1-BP5 (blue), distal 220 kb BP2-BP3 (green), and proximal 600 kb BP4-BP5 (magenta); the five blocks of segmental duplications (BP1 to BP5); and pairs of directly oriented segmental duplications with >98% identity that might trigger non-allelic homologous recombination and thus changes in number of copies of the BP1-BP5 (blues), 220 kb BP2-BP3 (greens), and 600 kb BP4-BP5 intervals (magentas). Note that no such pair is present at BP2-BP5 according to the hg38 reference sequence. The breakpoint terminology was proposed in Zufferey et al. (B and C) Distribution of Z-score values of BMI (B) and head circumference (HC) (C) in unrelated carriers of deletion (del; left boxplots) and duplication (dup; right boxplots) of the 16p11.2 1.7 Mb BP1-BP5 (blue), 16p11.2 220 kb BP2-BP3 (green), and 16p11.2 600 kb BP4-BP5 intervals (magenta), taking into account the normal effect of age and gender observed in the general population as described in Jacquemont et al. The general population has a mean of zero. (D) BMI plotted against head circumference (HC) of carriers of any 16p11.2 (top left, gray), 16p11.2 220 kb BP2-BP3 (top right, green), 16p11.2 600 kb BP4-BP5 (bottom left, magenta), and 16p11.2 1.7 Mb BP1-BP5 (bottom right, blue) rearrangements. Deletion and duplication carriers are depicted with triangles pointing up and down, respectively.

References

    1. Nuttle X., Giannuzzi G., Duyzend M.H., Schraiber J.G., Narvaiza I., Sudmant P.H., Penn O., Chiatante G., Malig M., Huddleston J. Emergence of a Homo sapiens-specific gene family and chromosome 16p11.2 CNV susceptibility. Nature. 2016;536:205–209. - PMC - PubMed
    1. Zufferey F., Sherr E.H., Beckmann N.D., Hanson E., Maillard A.M., Hippolyte L., Macé A., Ferrari C., Kutalik Z., Andrieux J., Simons VIP Consortium. 16p11.2 European Consortium A 600 kb deletion syndrome at 16p11.2 leads to energy imbalance and neuropsychiatric disorders. J. Med. Genet. 2012;49:660–668. - PMC - PubMed
    1. Cooper G.M., Coe B.P., Girirajan S., Rosenfeld J.A., Vu T.H., Baker C., Williams C., Stalker H., Hamid R., Hannig V. A copy number variation morbidity map of developmental delay. Nat. Genet. 2011;43:838–846. - PMC - PubMed
    1. McCarthy S.E., Makarov V., Kirov G., Addington A.M., McClellan J., Yoon S., Perkins D.O., Dickel D.E., Kusenda M., Krastoshevsky O., Wellcome Trust Case Control Consortium Microduplications of 16p11.2 are associated with schizophrenia. Nat. Genet. 2009;41:1223–1227. - PMC - PubMed
    1. Green E.K., Rees E., Walters J.T., Smith K.G., Forty L., Grozeva D., Moran J.L., Sklar P., Ripke S., Chambert K.D. Copy number variation in bipolar disorder. Mol. Psychiatry. 2016;21:89–93. - PMC - PubMed

MeSH terms

Supplementary concepts