

Pharmacological targeting of GLI1 inhibits proliferation, tumor emboli formation and in vivo tumor growth of inflammatory breast cancer cells
- PMID: 28965853
- PMCID: PMC5720365
- DOI: 10.1016/j.canlet.2017.09.033
Pharmacological targeting of GLI1 inhibits proliferation, tumor emboli formation and in vivo tumor growth of inflammatory breast cancer cells
Abstract
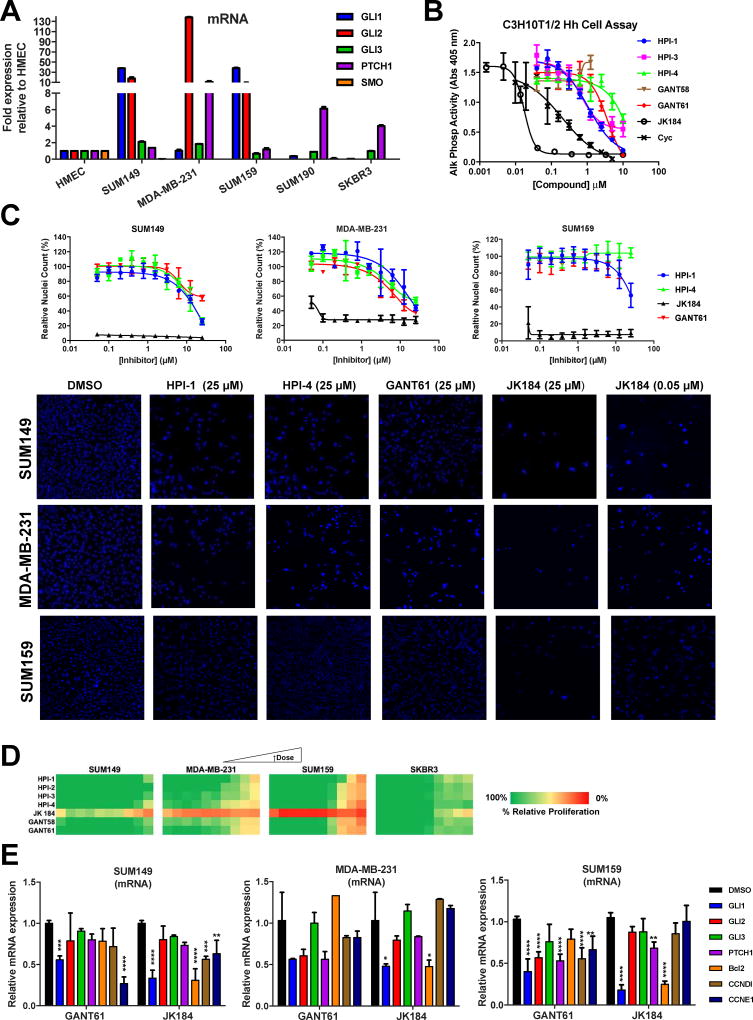
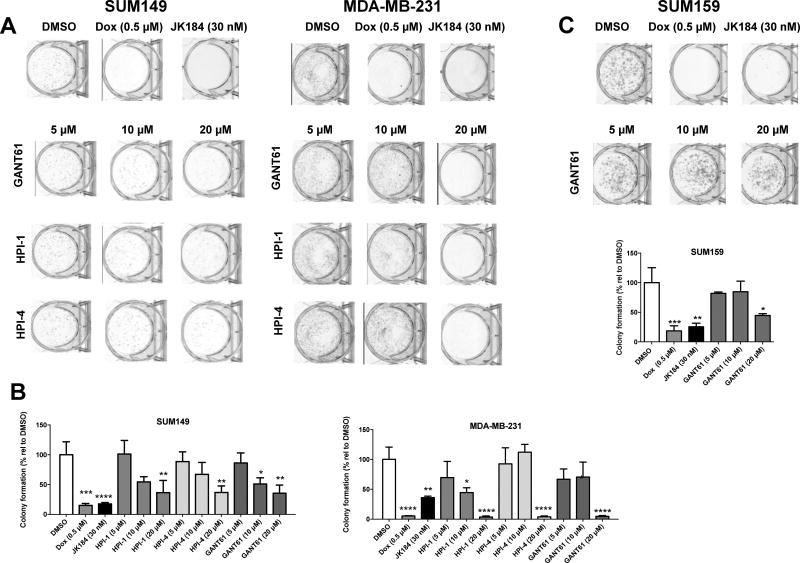
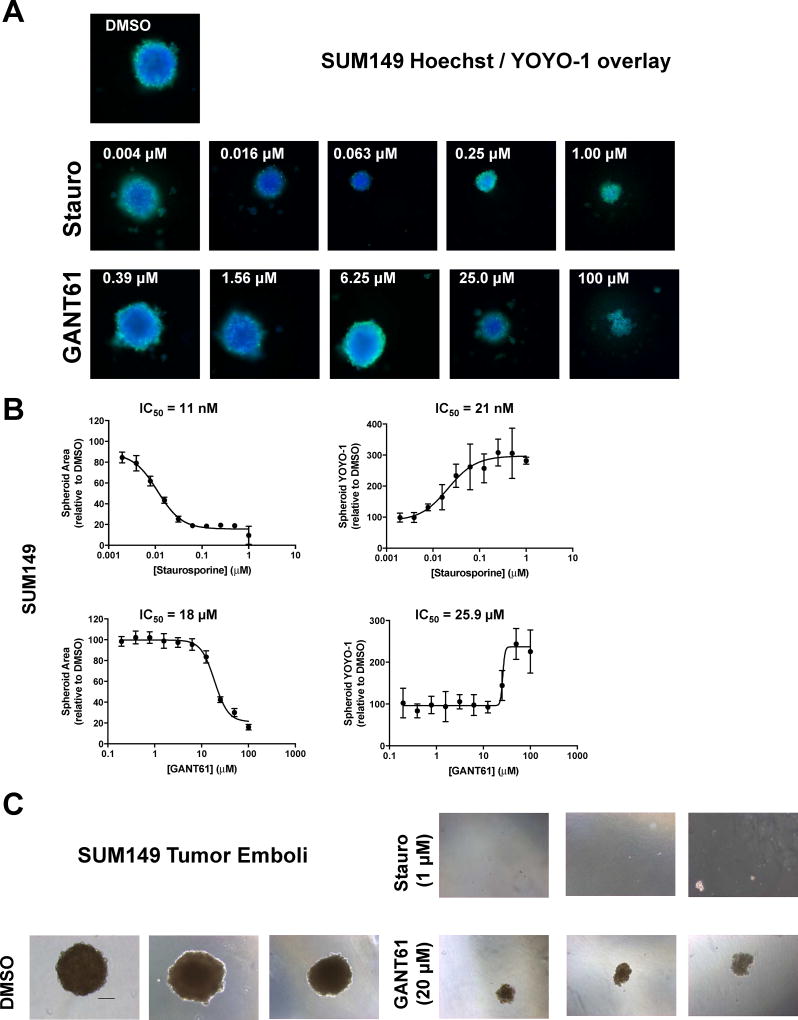
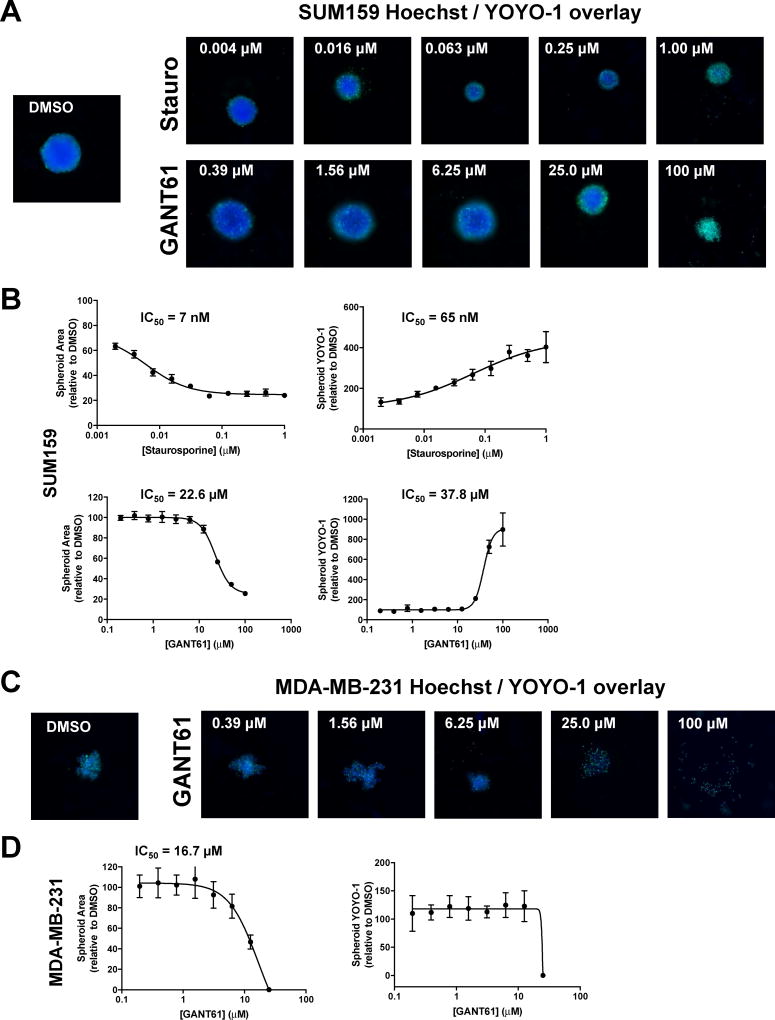
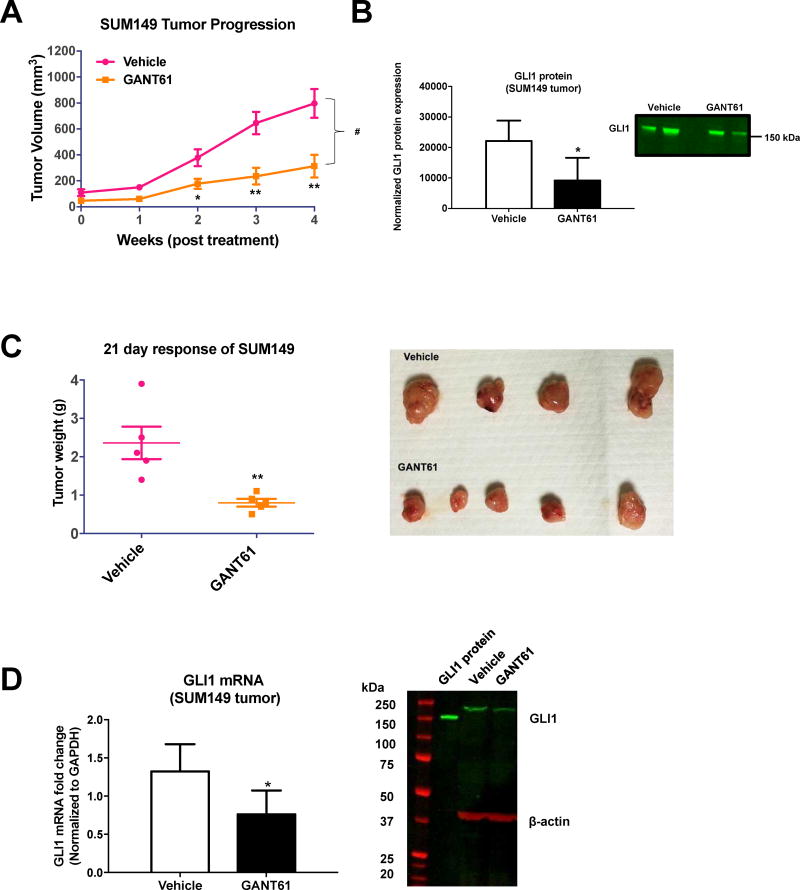
Activation of the Hedgehog (Hh) pathway effector GLI1 is linked to tumorigenesis and invasiveness in a number of cancers, with targeting of GLI1 by small molecule antagonists shown to be effective. We profiled a collection of GLI antagonists possessing distinct mechanisms of action for efficacy in phenotypic models of inflammatory and non-inflammatory breast cancer (IBC and non-IBC) that we showed expressed varying levels of Hh pathway mediators. Compounds GANT61, HPI-1, and JK184 decreased cell proliferation, inhibited GLI1 mRNA expression and decreased the number of colonies formed in TN-IBC (SUM149) and TNBC (MDA-MB-231 and SUM159) cell lines. In addition, GANT61 and JK184 significantly down-regulated GLI1 targets that regulate cell cycle (cyclin D and E) and apoptosis (Bcl2). GANT61 reduced SUM149 spheroid growth and emboli formation, and in orthotopic SUM149 tumor models significantly decreased tumor growth. We successfully utilized phenotypic profiling to identify a subset of GLI1 antagonists that were prioritized for testing in in vivo models. Our results indicated that GLI1 activation in TN-IBC as in TNBC, plays a vital role in promoting cell proliferation, motility, tumor growth, and formation of tumor emboli.
Keywords: GANT61; GLI1; Hedgehog; IBC; JK184; SUM149.
Copyright © 2017 Elsevier B.V. All rights reserved.
Conflict of interest statement
The authors declare that they have no conflict of interest.
Figures
Similar articles
-
Anti-cell growth and anti-cancer stem cell activities of the non-canonical hedgehog inhibitor GANT61 in triple-negative breast cancer cells.Breast Cancer. 2017 Sep;24(5):683-693. doi: 10.1007/s12282-017-0757-0. Epub 2017 Jan 31. Breast Cancer. 2017. PMID: 28144905
-
In vitro and in vivo inhibition of breast cancer cell growth by targeting the Hedgehog/GLI pathway with SMO (GDC-0449) or GLI (GANT-61) inhibitors.Oncotarget. 2016 Feb 23;7(8):9250-70. doi: 10.18632/oncotarget.7062. Oncotarget. 2016. PMID: 26843616 Free PMC article.
-
Targeting GLI1 expression in human inflammatory breast cancer cells enhances apoptosis and attenuates migration.Br J Cancer. 2011 May 10;104(10):1575-86. doi: 10.1038/bjc.2011.133. Epub 2011 Apr 19. Br J Cancer. 2011. PMID: 21505458 Free PMC article.
-
Deciphering the role of interferon alpha signaling and microenvironment crosstalk in inflammatory breast cancer.Breast Cancer Res. 2019 May 6;21(1):59. doi: 10.1186/s13058-019-1140-1. Breast Cancer Res. 2019. PMID: 31060575 Free PMC article. Review.
-
Identity of Gli1+ cells in the bone marrow.Exp Hematol. 2017 Oct;54:12-16. doi: 10.1016/j.exphem.2017.06.349. Epub 2017 Jul 6. Exp Hematol. 2017. PMID: 28690072 Free PMC article. Review.
Cited by
-
Literature-Wide Association Studies (LWAS) for a Rare Disease: Drug Repurposing for Inflammatory Breast Cancer.Molecules. 2020 Aug 28;25(17):3933. doi: 10.3390/molecules25173933. Molecules. 2020. PMID: 32872166 Free PMC article.
-
Omeprazole Inhibits Cell Proliferation and Induces G0/G1 Cell Cycle Arrest through Up-regulating miR-203a-3p Expression in Barrett's Esophagus Cells.Front Pharmacol. 2018 Jan 9;8:968. doi: 10.3389/fphar.2017.00968. eCollection 2017. Front Pharmacol. 2018. PMID: 29375376 Free PMC article.
-
Interactions between hedgehog signaling pathway and the complex tumor microenvironment in breast cancer: current knowledge and therapeutic promises.Cell Commun Signal. 2024 Sep 9;22(1):432. doi: 10.1186/s12964-024-01812-6. Cell Commun Signal. 2024. PMID: 39252010 Free PMC article. Review.
-
Pharmacologic Hedgehog inhibition modulates the cytokine profile of osteolytic breast cancer cells.J Bone Oncol. 2024 Jul 28;47:100625. doi: 10.1016/j.jbo.2024.100625. eCollection 2024 Aug. J Bone Oncol. 2024. PMID: 39183755 Free PMC article.
-
Identification of harmine and β-carboline analogs from a high-throughput screen of an approved drug collection; profiling as differential inhibitors of DYRK1A and monoamine oxidase A and for in vitro and in vivo anti-cancer studies.Eur J Pharm Sci. 2021 Jul 1;162:105821. doi: 10.1016/j.ejps.2021.105821. Epub 2021 Mar 27. Eur J Pharm Sci. 2021. PMID: 33781856 Free PMC article.
References
-
- O'Toole SA, Beith JM, Millar EK, West R, McLean A, Cazet A, Swarbrick A, Oakes SR. Therapeutic targets in triple negative breast cancer. J. Clin. Pathol. 2013;66:530–542. - PubMed
-
- Zardavas D, Baselga J, Piccart M. Emerging targeted agents in metastatic breast cancer. Nature Reviews Clinical Oncology. 2013;10:191–210. - PubMed
Publication types
MeSH terms
Substances
Grants and funding
LinkOut - more resources
Full Text Sources
Other Literature Sources
Medical
Miscellaneous
