. 2017 Oct 9;32(4):411-426.e11.
doi: 10.1016/j.ccell.2017.08.018. Epub 2017 Sep 28.

Coordinated Splicing of Regulatory Detained Introns within Oncogenic Transcripts Creates an Exploitable Vulnerability in Malignant Glioma

Affiliations

Coordinated Splicing of Regulatory Detained Introns within Oncogenic Transcripts Creates an Exploitable Vulnerability in Malignant Glioma

Christian J Braun et al. Cancer Cell. .

Abstract

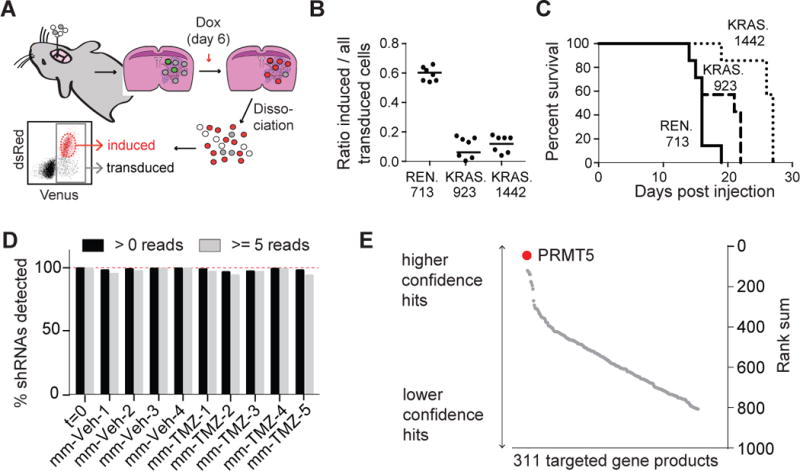
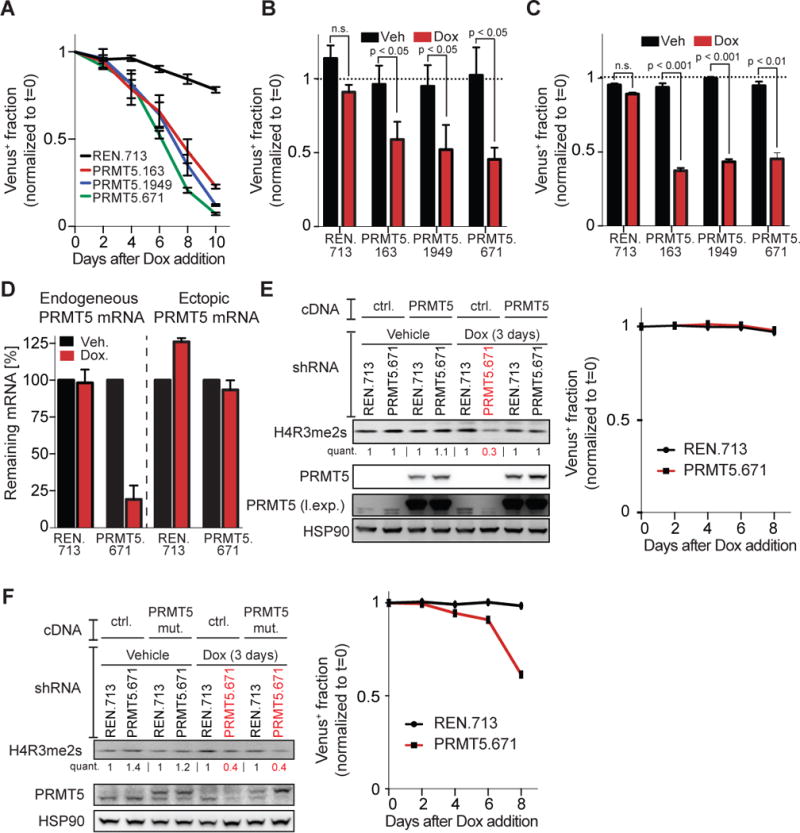
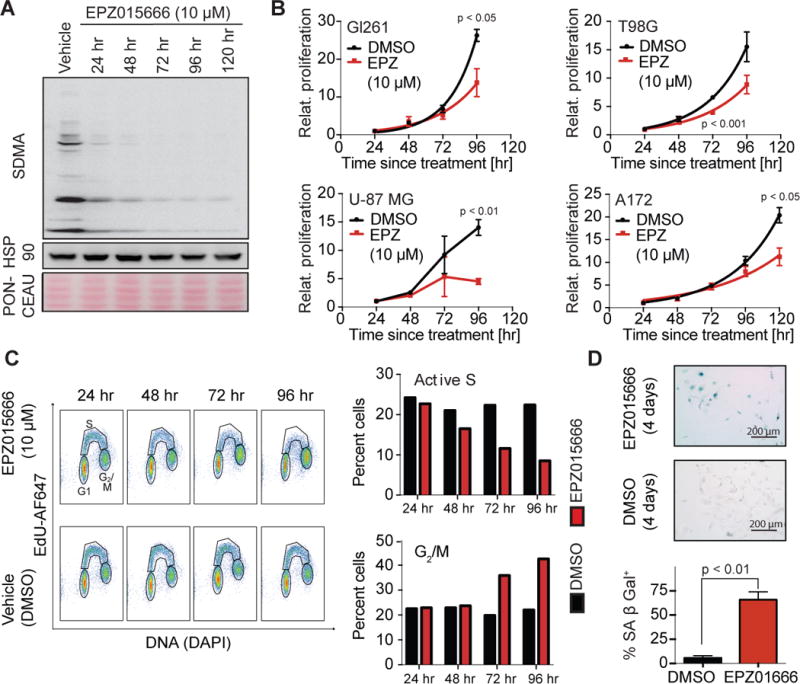
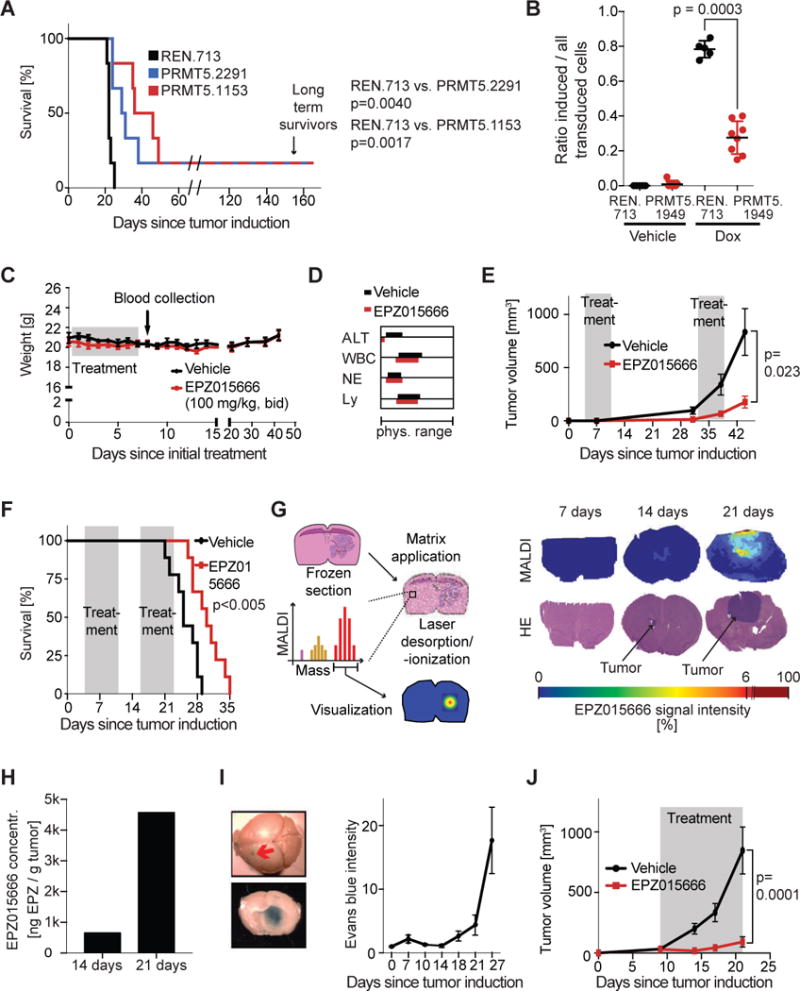
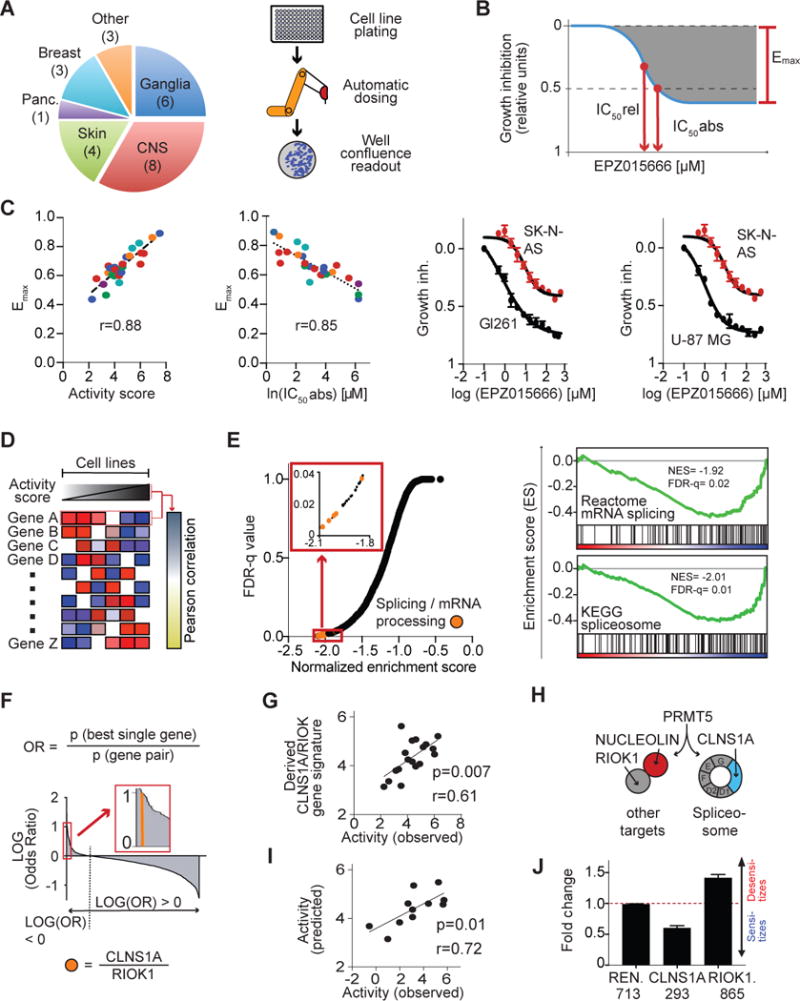
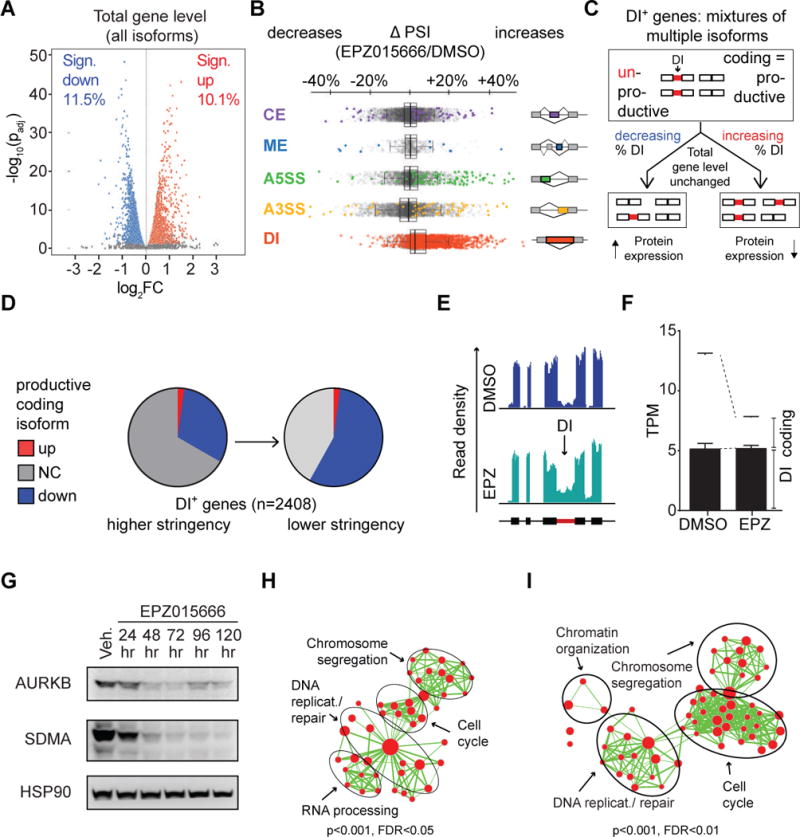
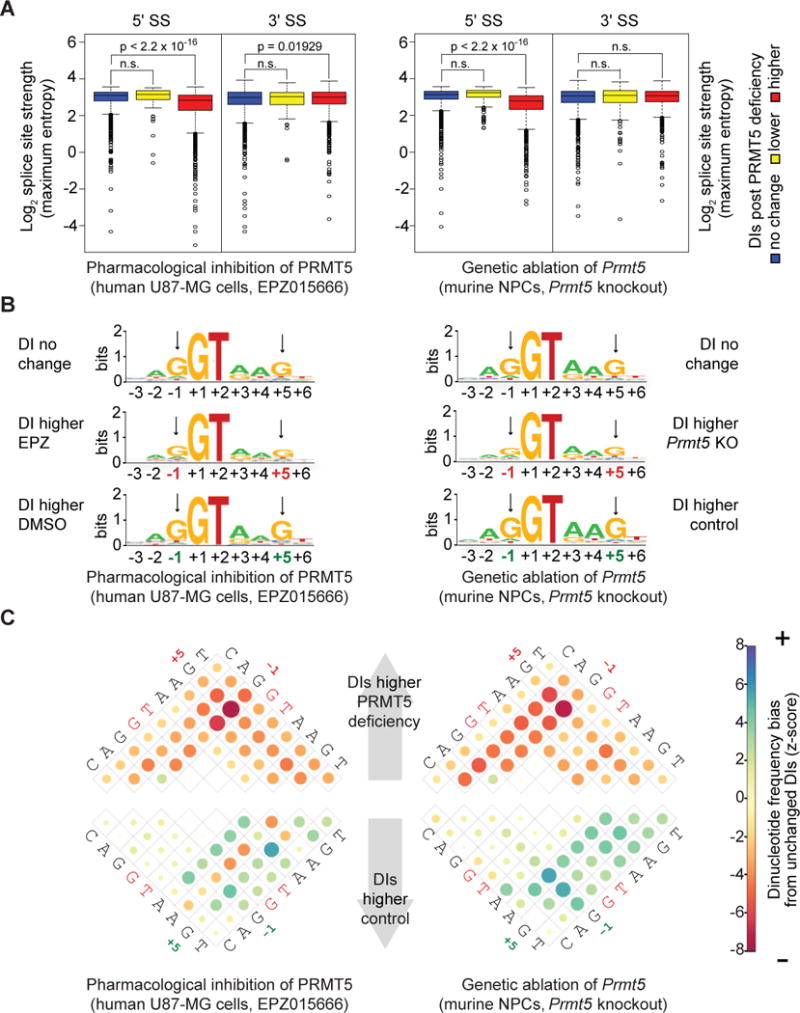
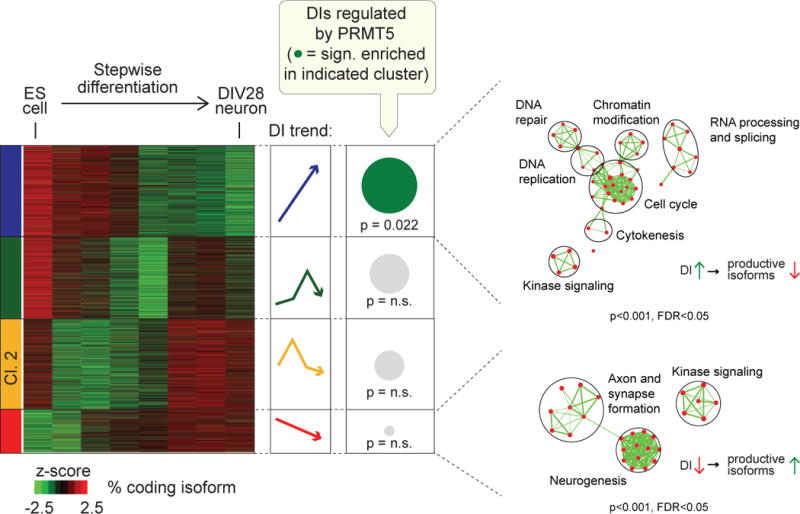
Glioblastoma (GBM) is a devastating malignancy with few therapeutic options. We identify PRMT5 in an in vivo GBM shRNA screen and show that PRMT5 knockdown or inhibition potently suppresses in vivo GBM tumors, including patient-derived xenografts. Pathway analysis implicates splicing in cellular PRMT5 dependency, and we identify a biomarker that predicts sensitivity to PRMT5 inhibition. We find that PRMT5 deficiency primarily disrupts the removal of detained introns (DIs). This impaired DI splicing affects proliferation genes, whose downregulation coincides with cell cycle defects, senescence and/or apoptosis. We further show that DI programs are evolutionarily conserved and operate during neurogenesis, suggesting that they represent a physiological regulatory mechanism. Collectively, these findings reveal a PRMT5-regulated DI-splicing program as an exploitable cancer vulnerability.

Keywords: CLNS1A; EPZ015666; GBM; PRMT5; RIOK1; biomarker; splicing addiction.


Figures

Figure 1
Figure 1. RNAi screen identifies PRMT5 as mediator of GBM growth
(A) Schematic of in vivo competition assays in intracranial GBMs. (B) shRNA representation at harvesting in an intracranial competition assay of Gl261 cells with shRNA expression induction 6 days post cell implantation into C57BL/6J mice, n=7 per condition). 1-way ANOVA p<0.0001, Dunnett’s multiple comparisons tests: adj. p value = 0.0001 for REN.713 vs. KRAS.923 and REN.713 vs. KRAS.1442. Horizontal lines represent mean. (C) Survival plot of mice in (B), Log-rank (Mantel-Cox) p=0.0839 for REN.713 vs. KRAS.923 and p=0.0005 for REN.713 vs. KRAS.1442. (D) Percentage of shRNAs normalized to expected library input across indicated samples. (E) Rank sum waterfall plot across all shRNA sub-screens. See also Figure S1/Table S1/Table S2.
Figure 2
Figure 2. Loss of PRMT5 impairs cellular fitness in a methyltransferase dependent manner
(A) In vitro competition assay in U-87 MG cells (n=3) normalized to pre-shRNA induction levels (t=0). (B,C) Competition assay using the U138 (B) or the A172 (C) cell line, n=3/line, assayed 12 days post shRNA induction with Dox. Significance estimated by paired t-tests. (D) Changes in endogenous and ectopic PRMT5 mRNA levels 2 days post shRNA induction. (E) U-87 MG cells with constitutive expression of wild-type, shRNA resistant PRMT5 cDNA and Dox induced expression of shRNAs as indicated, assayed by immunoblot (I. exp. = increased exposure) and competition assay. (F) U-87 MG cells with constitutive expression of PRMT5 mutant cDNA and Dox induced expression of shRNAs as indicated, assayed by immunoblot (left) and competition assay (right). Error bars = +/− SEM. See also Figure S2.
Figure 3
Figure 3. PRMT5 inhibition promotes G2/M arrest and senescence
(A) Immunoblot of SDMA over time for U-87 MG cells treated with 10 µM EPZ. (B) Relative proliferation of indicated GBM cell lines in response to DMSO control or 10 µM EPZ. Significance estimated by unpaired t-tests. (C, D) FACS-based cell cycle profiles (C, left) with quantification (C, right) and senescence-associated (SA) β-galactosidase staining (D) of U-87 MG cells treated with DMSO or 10 µM EPZ. Significance estimated by unpaired t-test. Error bars = +/− SEM. See also Figure S3.
Figure 4
Figure 4. Genetic or pharmacological inhibition of PRMT5 has strong anti-tumor effects
(A) Survival plot of C57BL/6J mice following intracranial implantation of Gl261 cells constitutively expressing the indicated shRNA constructs (n=6 per condition). Significance estimated with Log-Rank (Mantel-Cox) test. (B) Intracranial competition assay of U-87 MG cells in nude mice, shRNA induction 5 days post injection. n=5 for REN.713, n=8 for PRMT5.1949. Significance estimated with KS-test. Horizontal lines represent mean. (C, D) Weight (C), and blood (D) profiles of non-tumor bearing C57BL/6J mice dosed with oral EPZ or vehicle. ALT = alanine aminotransferase, WBC = white blood cells, NE = neutrophils, Ly = lymphocytes. (E) Tumor volume over time in mice with subcutaneous (s.c.) U-87 MG tumors treated with vehicle (n=24 tumors/12 mice) or EPZ (n=22 tumors/11 mice). Significance estimated with Mann-Whitney test at the final time point. (F) Survival of mice with intracranial U-87 MG tumors, treated with EPZ (n=9) or vehicle (n=9) for indicated times. Significance: Log-Rank (Mantel-Cox test). (G, H) MALDI-MSI workflow (G, left) and MALDI signal intensity/H&E brain sections of intracranial U-87 MG tumors in nude mice (G, right), and quantification of EPZ concentration (H). (I) Evan’s blue dye extravasation, macroscopic example of dye extravasation with red arrow depicting tumor injection site (left) and Evan’s blue dye intensity in brain samples of nude mice at indicated days post U-87 MG cell injection (right). (J) Volumes of s.c. MGG8 PDX tumors treated with vehicle/EPZ at indicated times, n=10. Significance estimated with Mann-Whitney test at final time point. Error bars: +/− SEM. See also Figure S4.
Figure 5
Figure 5. Biomarker predicts EPZ015666 sensitivity
(A) Tissue origin and numbers of cell lines used in screen (pie chart) and schematics of EPZ dosing pipeline. (B) Cell line sensitivity parameters. (C) Linear regressions of indicated cell line drug response (left two graphs). Color indicates tissue origin, as in (A). EPZ dose curves of indicated cell lines (right two graphs). (D) Correlation scheme linking cell line EPZ sensitivity to gene expression. (E) GSEA FDR-q values and normalized enrichment scores for Reactome gene sets (left) and examples of GSEA-derived enrichment plots (right). (F) Log odds ratios of the p value for the single gene of each pair most correlated with activity score over the p value of the paired metagene. (G) Correlation between C/R ratio-based biomarker signature and measured activity scores. (H) Schematic of competition between CLNS1A and RIOK1 for PRMT5. (I) Correlation between predicted and measured activity scores. (J) U-87 MG competition assay with indicated shRNAs after 6 days vehicle/10 µM EPZ treatment. Ratio: % shRNA+ cells in drug over vehicle treated cells. Error bars = +/− SEM. See also Figure S5/Table S3.
Figure 6
Figure 6. Increased intron detention dominates splicing changes upon PRMT5 inhibition
(A) Log2-fold total gene level changes in EPZ-treated cells versus controls. (B) Change in percent spliced in (PSI) between EPZ and control (CE = cassette exon; ME = mutually exclusive exon; A5SS and A3SS = alternative 5′ and 3′ splice sites respectively; and DI = detained intron). Vertical lines within boxes = median, edges of boxes = 1st and 4th quartiles, whiskers = min/max values, outliers (>/< 1.5 × interquartile range) excluded. (C) Transcript pool of a given gene is depicted as a mix of DI negative (coding, productive) and DI positive (non-coding, unproductive) isoforms. (D) Proportion of significantly changed DI+ genes following subtraction of unproductive transcripts. (E) Read density in AURKB across DI and flanking exons, normalized to mapped reads/sample. (F) Transcripts per million (TPM)-normalized AURKB expression in control vs. EPZ treatment, isoform composition indicated, error bars = +/− SEM. (G) Immunoblot of indicated proteins in U-87 MG cells following EPZ treatment. (H, I) Network maps of enriched gene sets in all DI-containing genes (H), and all genes down-regulated following EPZ treatment (I). Nodes: significantly enriched gene set, node size: proportional to the gene number, width of edges: degree of gene overlap between nodes. Functionally related gene sets labeled. See also Figure S6/Table S4/Table S5/Data S1.
Figure 7
Figure 7. 5′ splice site di-nucleotide frequency differs between PRMT5 sensitive and insensitive introns
(A) Relative 5′ and 3′ splice site strengths of the indicated DI sets. Horizontal lines within boxes = median, edges of boxes = 1st and 4th quartile, whiskers = min/max values, outliers excluded. (B) Sequence logo of the 5′ splice sites of the indicated sets of DIs. (C) Di-nucleotide frequency biases between unchanged and changed DIs in indicated DI sets. See also Figure S7.
Figure 8
Figure 8. Detained introns are coordinately regulated during neurogenesis
Clustered, Z-score normalized coding isoform percentages. Enrichment of DIs upregulated upon Prmt5 KO within each cluster is shown as a circle. Circle size: proportional to number of DIs, Significance: Bonferroni-corrected hypergeometric p value. DI expression trends indicated schematically. Network maps display significantly enriched gene sets within the indicated cluster. Functionally related gene sets labeled. See also Figure S8/Table S6.

Comment in

References

    1. Almada AE, Wu X, Kriz AJ, Burge CB, Sharp PA. Promoter directionality is controlled by U1 snRNP and polyadenylation signals. Nature. 2013;499:360–363. - PMC - PubMed
    1. Anders S, Huber W. Differential expression analysis for sequence count data. Genome Biol. 2010;11:R106. - PMC - PubMed
    1. Anders S, Reyes A, Huber W. Detecting differential usage of exons from RNA-seq data. Genome Res. 2012;22:2008–2017. - PMC - PubMed
    1. Antonysamy S, Bonday Z, Campbell RM, Doyle B, Druzina Z, Gheyi T, Han B, Jungheim LN, Qian Y, Rauch C, et al. Crystal structure of the human PRMT5:MEP50 complex. Proc Natl Acad Sci U S A. 2012;109:17960–17965. - PMC - PubMed
    1. Barretina J, Caponigro G, Stransky N, Venkatesan K, Margolin AA, Kim S, Wilson CJ, Lehár J, Kryukov GV, Sonkin D, et al. The Cancer Cell Line Encyclopedia enables predictive modelling of anticancer drug sensitivity. Nature. 2012;483:603–607. - PMC - PubMed

Publication types