. 2017 Oct 9;27(19):2963-2973.e14.
doi: 10.1016/j.cub.2017.08.066. Epub 2017 Sep 28.

Actin Turnover in Lamellipodial Fragments

Affiliations

Actin Turnover in Lamellipodial Fragments

Dikla Raz-Ben Aroush et al. Curr Biol. .

Abstract

Actin turnover is the central driving force underlying lamellipodial motility. The molecular components involved are largely known, and their properties have been studied extensively in vitro. However, a comprehensive picture of actin turnover in vivo is still missing. We focus on fragments from fish epithelial keratocytes, which are essentially stand-alone motile lamellipodia. The geometric simplicity of the fragments and the absence of additional actin structures allow us to characterize the spatiotemporal lamellipodial actin organization with unprecedented detail. We use fluorescence recovery after photobleaching, fluorescence correlation spectroscopy, and extraction experiments to show that about two-thirds of the lamellipodial actin diffuses in the cytoplasm with nearly uniform density, whereas the rest forms the treadmilling polymer network. Roughly a quarter of the diffusible actin pool is in filamentous form as diffusing oligomers, indicating that severing and debranching are important steps in the disassembly process generating oligomers as intermediates. The remaining diffusible actin concentration is orders of magnitude higher than the in vitro actin monomer concentration required to support the observed polymerization rates, implying that the majority of monomers are transiently kept in a non-polymerizable "reserve" pool. The actin network disassembles and reassembles throughout the lamellipodium within seconds, so the lamellipodial network turnover is local. The diffusible actin transport, on the other hand, is global: actin subunits typically diffuse across the entire lamellipodium before reassembling into the network. This combination of local network turnover and global transport of dissociated subunits through the cytoplasm makes actin transport robust yet rapidly adaptable and amenable to regulation.

Keywords: actin turnover; biophysical modeling; cell motility; fish keratocytes.


Figures

Figure 1
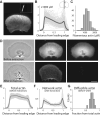
Figure 1. Quantitative analysis of actin in fragments
(A–C) Quantitative measurements of the filamentous actin in fragments. (A) Fluorescence images of a fragment and a filament (inset) after fixing and staining with Alexa Fluor 546-phalloidin. The exposure times are 100× longer for filaments compared to fragments. (B) The molar filamentous actin concentration (subunits per volume) as determined by quantifying the number of actin filaments per unit area and assuming a uniform lamellipodial thickness of 0.2 µm (see STAR Methods). The filamentous actin concentration along a cross section is shown as a function of the normalized distance from the leading edge (front-to-rear distance=1). Traces for individual fragments are plotted (thin lines) along with the population average (thick line). (C) A histogram of the average filamentous actin concentration in individual fragments for the population of fragments shown in (B). (D–G) Extraction experiments show that most of the lamellipodial actin is diffusible. (D) Phase contrast and fluorescence images showing the distribution of Alexa Fluor 488-actin and Texas Red 3kD dextran in the same fragment, before (top) and after extraction (bottom). The diffusible cytoplasmic constituents, including the diffusible actin and the dextran volume marker, are removed during the extraction step. (E) The distribution of total actin in fragments along a cross section from front to rear, perpendicular to the leading edge. The population-average actin intensity before extraction (N=18) (thick line) is plotted together with the standard deviation (shaded region). The actin intensity within each fragment is normalized to have mean=1. (F) The distribution of non-diffusible (network) actin in fragments along a cross section from front to rear. The population-average actin intensity after extraction (N=18) (thick line) is plotted together with the standard deviation (shaded region). The intensity normalization within each fragment is determined before extraction (as in (E)) to have mean=1, so the intensities after extraction reflect the relative fraction of the network actin from the total actin. (G) A histogram of the fraction of diffusible actin in fragments, determined from the difference between the integrated actin signal in fragments before extraction (total actin) and after extraction (network actin). The average diffusible actin fraction is 0.69 ± 0.16 (mean ± std; N=18).
Figure 2
Figure 2. The distribution of uncapped actin filament ends
(A) Fluorescence images showing the distributions of uncapped barbed ends (red; rhodamine-actin), uncapped pointed ends (blue; Alexa Fluor 488-actin), and filamentous actin (green; Alexa Fluor 680- phalloidin) in a fragment following fixation and ends labeling (STAR Methods). (B) An overlay of the uncapped barbed ends, uncapped pointed ends, and actin network density for the fragment shown in (A). (C) A ratio image depicting the barbed ends signal divided by the pointed ends signal for the fragment shown in (A). (D–F) The intensity along a cross section perpendicular to the leading edge is plotted as a function of the normalized distance from the leading edge for the uncapped barbed ends labeling (D), the uncapped pointed ends labeling (E), and the filamentous actin (F). Population averages (lines; N=137) are shown together with the standard deviation (shaded regions). (G) The percentage of uncapped barbed ends at the leading edge is calculated by taking the ratio of the integrated fluorescence intensity of barbed ends staining in a 1 µm wide strip along the leading edge, and the integrated signal over the whole fragment. A histogram of the percentage of uncapped barbed ends at the leading edge in a population of fragments is shown.
Figure 3
Figure 3. FRAP analysis of lamellipodial actin turnover
(A) Confocal images of a live fragment electroporated with two types of labeled actin, Alexa Fluor 647-actin (magenta) and Alexa Fluor 488-actin (green). A ~1µm2 region (ROI) at the center of the lamellipodium, positioned near the leading edge (white box), is bleached in one channel and the other channel is used as a reference. A strip perpendicular to the leading edge (dashed region) is imaged as a function of time in both channels. (B) Kymographs showing the intensity as a function of time along a line perpendicular to the leading edge for the fragment shown in (A). The bleached channel (magenta; Alexa Fluor 647-actin), and the ratio between the bleached channel and the control channel (gray; Alexa Fluor 647-actin/ Alexa Fluor 488-actin) are depicted. The arrow indicates the time of bleaching. Scale bar: 2µm. (C) The ROI ratio intensity (Alexa Fluor 647-actin/ Alexa Fluor 488-actin) as a function of time after bleaching is measured in individual fragments, and normalized by setting the pre-bleach value to 1. The average normalized ROI ratio intensity from a population of fragments (N=26) is plotted as a function of time after bleaching (line) together with the standard deviation (shaded region). The average recovery is fit to an exponential function R(t)=(1ε)α·etτ with τ,α,ε as fit parameters (inset). (D) ROI ratio intensity profiles from individual fragments are fit to an exponential as in (C). A histogram of the fitted recovery times (τ) from individual fragments is depicted. The average recovery time is 4.0 ± 1.6 sec (mean ± std; N=26). (E) The drop in the ROI ratio intensity (ΔR) between the prebleach value (=1) and the first frame after bleaching reflects the fraction of network actin. A histogram of the fraction of diffusible actin (= 1 − ΔR) in a population of fragments is shown. The average diffusible actin fraction determined from the FRAP experiments is 0.62 ± 0.11 (mean ± std; N=26). See also Figure S2.
Figure 4
Figure 4. The diffusible actin pool contains monomers and oligomers
(A) A schematic illustration of the FCS experiments. A fluorescent probe is present at low concentration in a motile fragment. FCS analysis is done by positioning a laser beam in front of the center of the leading edge of the fragment, so that as the fragment moves forward the beam crosses its lamellipodium, along a line perpendicular to the leading edge. (B) The normalized FCS correlation as a function of lag time is depicted for the different probes used: Alexa Fluor 488-actin, Alexa Fluor 488-phalloidin and Alexa Fluor 488. The normalized correlation functions measured in individual fragments (thin lines), are shown together with the average correlation (thick lines) for each probe. (C) The average diffusion times and effective diffusion coefficients determined from the FCS experiments for each probe. The values are determined by fitting the normalized correlation function to a simple diffusion model in solution (3D) and in the lamellipodium (2D). (D) The diffusible filament fraction is determined from the FCS experiments with Alexa Fluor 488-phalloidin, as the ratio between the FCS count rate (due to diffusing phalloidin-bound filaments) and the total count rate (from all phalloidin-labeled filaments) inferred from the average lamellipodial fluorescence intensity (STAR Methods). A histogram of the fraction of diffusible phalloidin is depicted. The average fraction of diffusible filaments from the total filamentous actin pool in fragments is 0.21 ± 0.9 (mean ± std; N=26). (E) Phase contrast and fluorescence images showing the distribution of Alexa Fluor 546-phalloidin in the same fragment, before (top) and after extraction (bottom). The diffusible phalloidin fraction, which includes phalloidin-bound actin oligomers, is removed during the extraction step. (F) The diffusible filament fraction is determined as the ratio between the integrated extracted phalloidin signal (difference between signal before and after extraction) and the integrated signal before extraction (STAR Methods). A histogram of the fraction of diffusible filaments from the total filamentous actin pool in fragments is depicted. The average diffusible phalloidin fraction determined from the extraction experiments is 0.32 ± 0.18 (mean ± std; N=11). See also Figure S3.
Figure 5
Figure 5. Mathematical model for lamellipodial actin turnover
(A) Schematic illustration of the reactions involved in lamellipodial actin turnover between the different actin subpopulations: polymerizable actin monomers assemble onto uncapped barbed ends in the network, network severing yields oligomers, oligomer disassemble into polymerizable actin monomers, and monomers exchange between polymerizable and non-polymerizable forms (top). At steady state, the system has to exhibit flux balance. This allows us to infer the average bulk concentration of each actin subpopulation and the relevant reaction rates (bottom). (B) Schematic illustration of the mathematical model for actin turnover in fragments (top) and its formulation in terms of reaction-drift-diffusion equations in 1D (bottom). The equations describe the time evolution of the spatial concentrations of the actin subpopulations, incorporating the reactions described in (A) and taking into account actin network flow and diffusion of monomers and oligomers. (C) Schematic illustration of the life-cycle of an actin subunit based on the model. See also Figures S4,S5.
Figure 6
Figure 6. Model predictions and their experimental testing
(A) The model predicted steady-state distributions for the four actin subpopulations (left), and the distribution of diffusible actin, G+g+f, and network actin, F (right), are plotted as a function of position along the front-to-rear axis. (B) The measured diffusible actin concentration and network density in fragments as obtained from extraction experiments (Fig. 1D–E). The diffusible actin concentration is determined by locally subtracting the network actin density (after extraction) from the total actin density (before extraction) and dividing by the local volume marker intensity (Texas Red 3kD dextran) to correct for height variations (N=11). To compare to the 1D model, the relative actin distributions are determined by setting the average total actin along the cross section to be 1. The observed diffusible and network actin density distributions (mean (line) ± std (shaded region)) are comparable to the model-predicted distributions shown in (A). (C–E) Experimental analysis of the correlation between filamentous actin and uncapped barbed ends based on co-staining of filaments and uncapped filament ends (Fig. 2). (C) Scatter plot of the average uncapped barbed ends labeling intensity (rhodamine-actin) versus the average filamentous actin signal (Alexa Fluor 680-phalloidin) from individual fragments (N=137). A clear correlation between the level of uncapped barbed ends and the level of filaments is observed. (D–E) The spatial correlation between the filamentous actin signal and the uncapped barbed ends labeling intensity along a cross section from front to rear is examined in individual fragments. (D) A histogram of the correlation coefficients computed in individual fragments is depicted. The vast majority of fragments (116 out of 137) exhibit positive correlation between the uncapped barbed ends and the filamentous actin distributions. (E) The spatial distribution of the filamentous actin signal and the uncapped barbed ends labeling as a function of distance from the leading edge are plotted for the fragment that exhibits the highest correlation (0.98).

References

    1. Pollard TD, Borisy GG. Cellular motility driven by assembly and disassembly of actin filaments. Cell. 2003;112:453–465. - PubMed
    1. Blanchoin L, Boujemaa-Paterski R, Sykes C, Plastino J. Actin dynamics, architecture, and mechanics in cell motility. Physiological reviews. 2014;94:235–263. - PubMed
    1. Abraham VC, Krishnamurthi V, Taylor DL, Lanni F. The actin-based nanomachine at the leading edge of migrating cells. Biophys J. 1999;77:1721–1732. - PMC - PubMed
    1. Pollard TD, Blanchoin L, Mullins RD. Molecular mechanisms controlling actin filament dynamics in nonmuscle cells. Annu Rev Biophys Biomol Struct. 2000;29:545–576. - PubMed
    1. Pollard TD, Cooper JA. Actin, a central player in cell shape and movement. Science. 2009;326:1208–1212. - PMC - PubMed

LinkOut - more resources