. 2017 Oct 10;9(4):1109-1123.
doi: 10.1016/j.stemcr.2017.07.014. Epub 2017 Sep 28.

Crohn's Disease Disturbs the Immune Properties of Human Adipose-Derived Stem Cells Related to Inflammasome Activation

Affiliations

Crohn's Disease Disturbs the Immune Properties of Human Adipose-Derived Stem Cells Related to Inflammasome Activation

Carolina Serena et al. Stem Cell Reports. .

Abstract

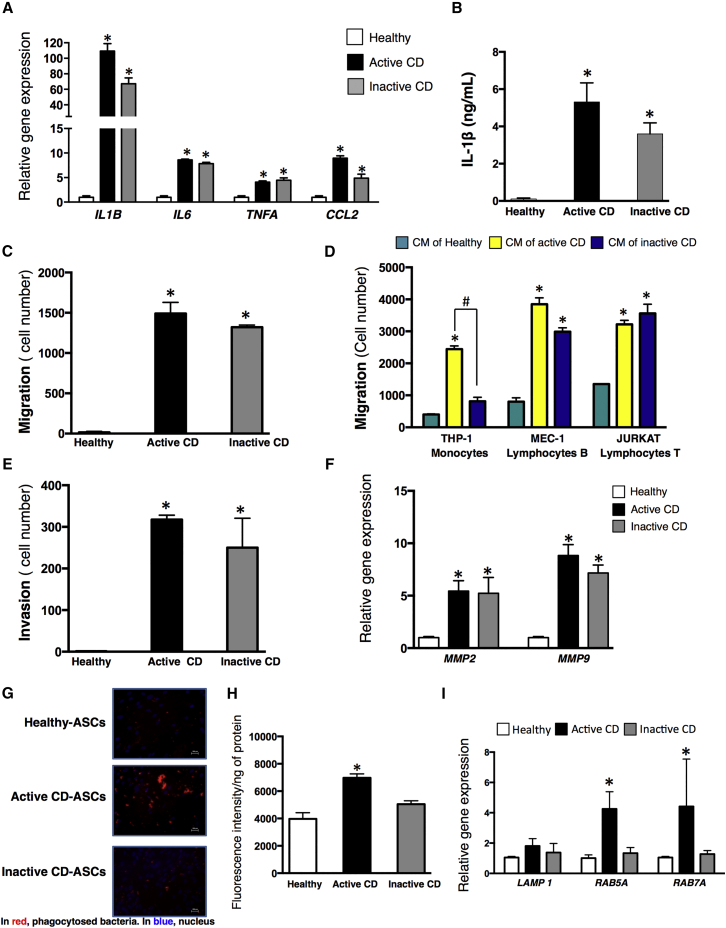
Crohn's disease (CD) is characterized by the expansion of mesenteric fat, also known as "creeping fat." We explored the plasticity and immune properties of adipose-derived stem cells (ASCs) in the context of CD as potential key players in the development of creeping fat. Mesenteric CD-derived ASCs presented a more proliferative, inflammatory, invasive, and phagocytic phenotype than equivalent cells from healthy donors, irrespective of the clinical stage. Remarkably, ASCs from the subcutaneous depot of patients with CD also showed an activated immune response that was associated with a reduction in their immunosuppressive properties. The invasive phenotype of mesenteric CD ASCs was governed by an inflammasome-mediated inflammatory state since blocking inflammasome signaling, mainly the secretion of interleukin-1β, reversed this characteristic. Thus, CD alters the biological functions of ASCs as adipocyte precursors, but also their immune properties. Selection of ASCs with the best immunomodulatory properties is advocated for the success of cell-based therapies.

Keywords: cell therapy; creeping fat; immunity; interleukin 1B; invasion; lymphocytes; mesenchymal stem cells; migration; phagocytosis; regulatory T cell.


Figures

Figure 1
Figure 1
CD Increases Mesenteric ASC Proliferation and Reduces Their Adipogenic Differentiation Capacity (A–C) AT-cell number ratio (A), MTT (B), and BrdU cell proliferation (C) assays were performed as detailed in Experimental Procedures to study the cell proliferation of mesenteric ASCs. (D) Representative images of intracellular lipid enrichment in mature adipocyte (AD) from healthy subjects, active CD patients, and inactive CD individuals (magnification, ×200; scale bar, 200 μm). (E) Quantification of oil red O staining of AD from healthy subjects, active CD patients, and inactive CD patients. (F) Gene expression of adipogenic markers was analyzed by RT-PCR in AD and undifferentiated ASCs from healthy subjects, active CD patients, and inactive CD patients. n = 5–10 per group as explained in Experimental Procedures. p < 0.017 versus healthy ASCs; #p < 0.017 as indicated in the figure.
Figure 2
Figure 2
CD Triggers an Inflammasome-Mediated Inflammatory Response in Mesenteric ASCs and Increases Their Metabolic Activity (A) Expression of IL6, TNFA, CCL2, IL1B, IL10, and adiponectin were analyzed by qPCR in ASCs isolated from VAT of healthy subjects, active CD patients, and inactive CD patients. (B) Secretion of IL-1β was analyzed by ELISA from conditioned medium (CM) of ASCs from healthy subjects, active CD patients, and inactive CD patients. (C) Gene expression of different components of the inflammasome, NLRP1, NLRP3, and CASP1 were analyzed by qPCR. (D) Gene expression of glucose and lipid metabolism genes was analyzed by qPCR in VAT ASCs. (E and F) Lactate (E) and succinate (F) levels in CM of ASCs isolated from healthy subjects, active CD patients, and inactive CD patients. n = 5–10 per group as explained in Experimental Procedures, with the exception of metabolic data (n = 4 for all groups). p < 0.017 versus healthy ASCs; #p < 0.017 as indicated in the figure.
Figure 3
Figure 3
CD Changes the Functional Properties of Mesenteric ASCs (A) The migratory capacity of healthy ASCs, active CD ASCs, and immune cells (Jurkat cells) into 24-hr CM of CF of active CD patients or VAT of healthy individuals were assessed in Transwell assays. (B) The migratory capacity of basal ASCs isolated from VAT of healthy subjects, active CD patients, and inactive CD patients was assessed in Transwell assays. Representative toluidine blue-stained cells are shown below the graph (magnification, ×200; scale bar, 200 μm). (C) CM of VAT from healthy subjects, active CD patients, and inactive CD patients was tested to ascertain if it promotes the migration of immune cells (monocytes, THP-1 cell line; B lymphocytes, MEC-1 cell line; and T lymphocytes, Jurkat cell line) using the Transwell system. (D) Invasion capacity was studied in ASCs by adding Matrigel to the upper Transwell chamber. Representative toluidine blue-stained cells are shown below the graph (magnification, ×200; scale bar, 200 μm). (E) Zymographic analysis of MMP2/9 activities using gelatin as substrate. Representative zymogram and densitometric analysis are shown. (F) Phagocytosis assay was performed using a rhodamine-based red dye conjugated to E. coli bacteria, which turns bright red upon lysosomal acidification. Phagocytic activity of cells is marked in red and the cell nucleus is marked in blue (DAPI). Representative images of ASCs from healthy subjects, active CD patients, and inactive CD patients (magnification, ×200; scale bar, 200 μm). (G) Phagocytosis was quantified using the Varioskan LUX multimode microplate reader. Fluorescence intensity was normalized to total protein content. n = 5–10 per group as explained in Experimental Procedures, with the exception of phagocytic data (n = 4 for all groups). p < 0.05 versus healthy ASCs; #p < 0.01 as indicated in the figure.
Figure 4
Figure 4
CD Alters the Functional Properties of Subcutaneous ASCs (A) Expression of IL1B, IL6, TNFA and CCL2 was analyzed by qPCR in ASCs isolated from SAT of healthy subjects, active CD patients, and inactive CD patients. (B) Secretion of IL-1β was analyzed by ELISA from CM of ASCs from healthy subjects, active CD patients, and inactive CD patients. (C) Migratory capacity of ASCs isolated from healthy subjects, active CD patients, and inactive CD patients from SAT was assessed using the Transwell system. (D) CM of SAT from healthy subjects, active CD patients, and inactive CD patients was tested to ascertain if it promotes the migration of immune cells (monocytes, THP-1 cell line; B lymphocytes, MEC-1 cell line; and T lymphocytes, Jurkat cell line) using the Transwell system. (E) Invasion capacity was studied in ASCs by adding Matrigel to the upper Transwell chamber. (F) MMP2 and MMP9 gene expression was analyzed by qPCR in ASCs from healthy subjects, active CD patients, and inactive CD patients. (G) Phagocytosis assay was performed using a rhodamine-based red dye conjugated to E. coli bacteria, which turns bright red upon lysosomal acidification. Phagocytic activity of cells is marked in red, and the cell nucleus is marked in blue (DAPI). Representative images of ASCs from healthy subjects, active CD patients, and inactive CD patients (magnification, ×200; scale bar, 200 μm). (H) Phagocytosis was quantified using the Varioskan LUX multimode microplate reader. Fluorescence intensity was normalized to total protein content. (I) Gene expression of different phagocytic markers, LAMP1, RAB5A, and RAB7A, was analyzed by qPCR. n = 6–10 per group as explained in Experimental Procedures, with the exception of phagocytic data (n = 4 for all groups). p < 0.017 versus healthy ASCs; #p < 0.017 as indicated in the figure.
Figure 5
Figure 5
CD Reduces the Immunosuppressive Properties of ASCs (A) ASCs were isolated from SAT of healthy subjects, active CD patients, and inactive CD patients, and the expression of TGFB1 was analyzed by qPCR. (B) Secretion of TGF-β1 was analyzed by ELISA in CM of ASCs from healthy subjects, active CD patients, and inactive CD patients. (C) CM of ASCs from SAT of healthy subjects, active CD patients, and inactive CD patients, was added to THP-1 PMA-activated macrophage, and gene expression of M1/M2 phenotype markers was analyzed by qPCR. (D) Cell proliferation of Jurkat T cells and MEC-1 B cells was measured after adding CM of ASCs from SAT of healthy subjects, active CD patients, and inactive CD patients. (E) Gene expression of Th1/Th2/Treg markers were studied in naive T lymphocytes that were co-cultured with healthy or active CD ASCs for 48 hr. (F) Secretion of G-CSF was analyzed by ELISA in culture supernatant of co-cultured naive T lymphocytes with healthy ASCs or active CD ASCs. (G) Gene expression of GCSF in ASCs previously co-cultured with naive T lymphocytes. n = 6–10 per group. p < 0.017 versus healthy ASCs; #p < 0.017 versus control (CM) as indicated in the figure.
Figure 6
Figure 6
Inflammasome Inhibition of CD ASCs Reverses the Immune-Activated Phenotype (A–D) Invasion capacity was studied in (A) SAT or (B) VAT CD ASCs treated with 40 ng/mL interleukin 1 receptor antagonist (IL1RA), 20 ng/mL TGF-β1, 10 μM YVAD-CHO (caspase-1 inhibitor), or the combined treatments at the same doses described in the figure. MMP2/9 gene expression was analyzed by qPCR in ASCs from (C) SAT and (D) VAT isolated from healthy subjects, active CD patients, and inactive CD patients. (E and F) SAT (E) and VAT (F) relative gene expression of inflammasome, phagocytic, and metabolic markers was determined in untreated CD ASCs (basal) or those treated with IL1RA plus YVAD-CHO. n = 4 for all groups. p < 0.017 versus untreated ASCs (basal); #p < 0.017 as indicated in the figure.

References

    1. Altundag K., Altundag O., Baptista M.Z., Akyurek S. Heparanase activity and bone loss in postmenopausal breast cancer patients. J. Clin. Oncol. 2005;23:8916–8917. author reply 8917–8918. - PubMed
    1. Baek S.J., Kang S.K., Ra J.C. In vitro migration capacity of human adipose tissue-derived mesenchymal stem cells reflects their expression of receptors for chemokines and growth factors. Exp. Mol. Med. 2011;43:596–603. - PMC - PubMed
    1. Baptista L.S., Silva K.R., Borojevic R. Obesity and weight loss could alter the properties of adipose stem cells? World J. Stem Cells. 2015;7:165–173. - PMC - PubMed
    1. Barbagallo I., Li Volti G., Galvano F., Tettamanti G., Pluchinotta F.R., Bergante S., Vanella L. Diabetic human adipose tissue-derived mesenchymal stem cells fail to differentiate in functional adipocytes. Exp. Biol. Med. (Maywood) 2017;242:1079–1085. - PMC - PubMed
    1. Batra A., Heimesaat M.M., Bereswill S., Fischer A., Glauben R., Kunkel D., Scheffold A., Erben U., Kuhl A., Loddenkemper C. Mesenteric fat - control site for bacterial translocation in colitis? Mucosal Immunol. 2012;5:580–591. - PubMed

MeSH terms