. 2017 Sep 15:8:1128.
doi: 10.3389/fimmu.2017.01128. eCollection 2017.

Peripheral Autoimmune Regulator Induces Exhaustion of CD4+ and CD8+ Effector T Cells to Attenuate Autoimmune Diabetes in Non-Obese Diabetic Mice

Affiliations

Peripheral Autoimmune Regulator Induces Exhaustion of CD4+ and CD8+ Effector T Cells to Attenuate Autoimmune Diabetes in Non-Obese Diabetic Mice

Divakar Kulshrestha et al. Front Immunol. .

Abstract

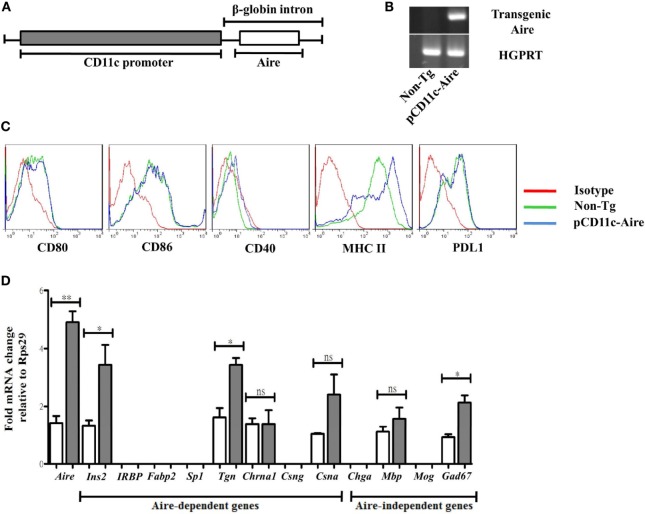
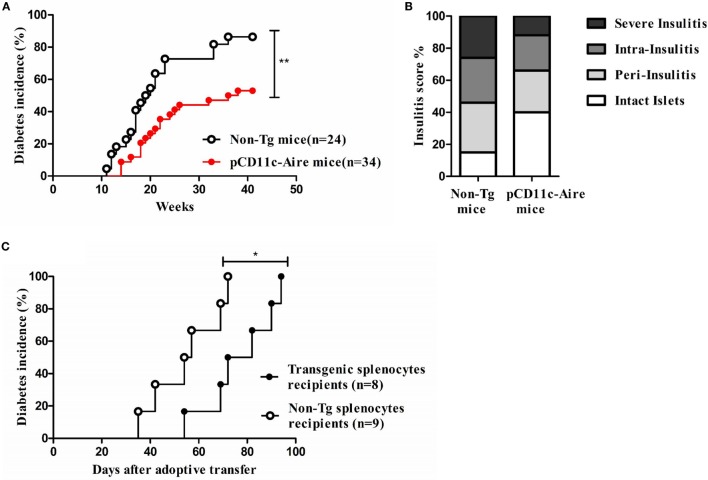
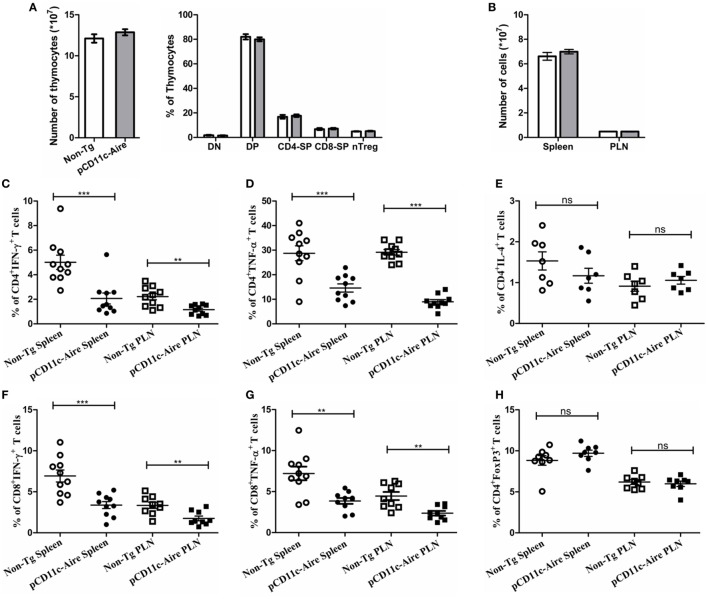
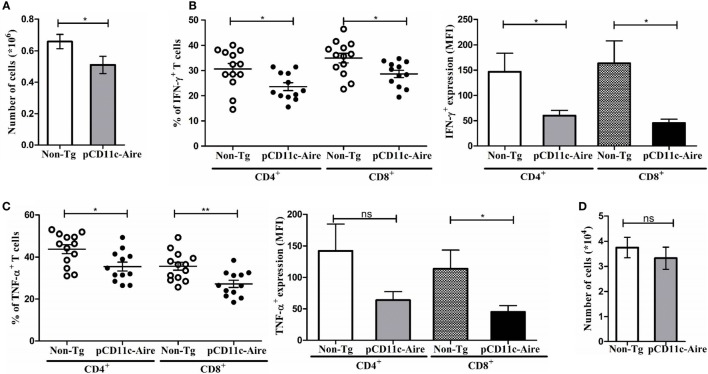
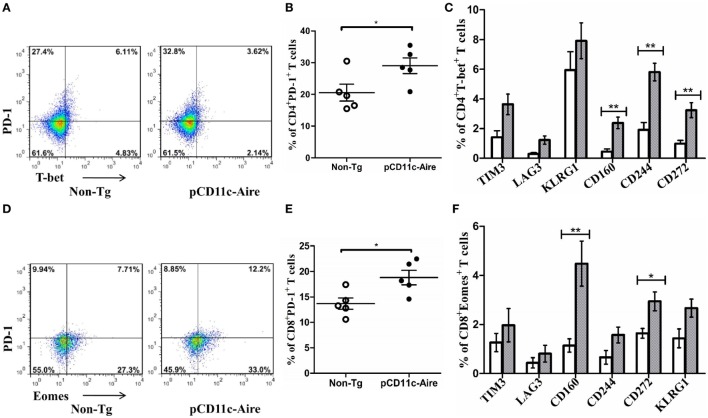
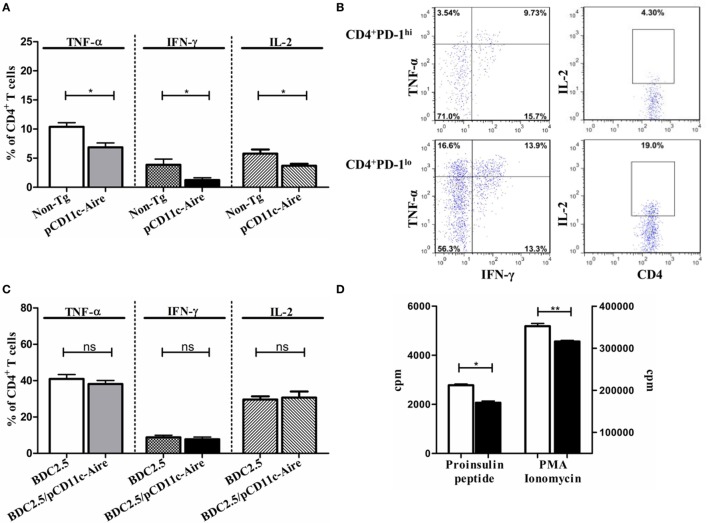
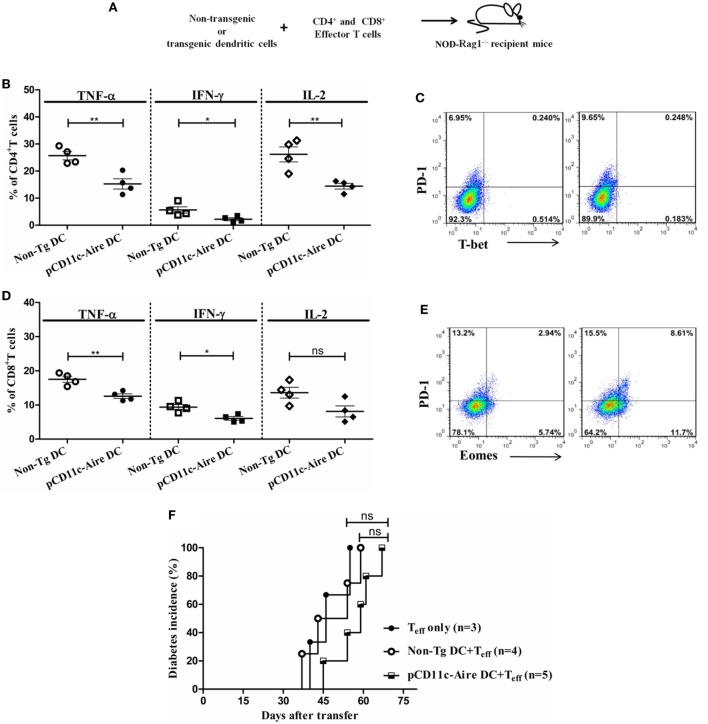
Autoimmune regulator (Aire) is one of the most crucial genes expressed in the thymus, where it orchestrates the promiscuous expression and presentation of tissue-specific antigens during thymocyte selection. The presence of Aire-expressing cells outside the thymus points toward its plausible extrathymic functions; however, the relative contribution of Aire-expressing cells of hematopoietic origin and their role in the modulation of autoimmune diseases are still obscure. Here, we report that non-obese diabetic mice with transgenic Aire expression under the control of the CD11c (integrin alpha X) promoter were significantly protected from autoimmune diabetes compared with their non-transgenic littermates. The protective effect of Aire transgene was mediated primarily by an increase in the "exhausted" populations of CD4+ and CD8+ T cells, both demonstrating poor expressions of interferon-γ and tumor necrosis factor-α. Both CD4+ and CD8+ effector T cells in transgenic mice displayed distinctive and differential expression of T-bet and Eomesodermin, respectively, in conjunction with high expression of programmed cell death protein-1 and other exhaustion-associated markers. Importantly, transgenic Aire expression did not result in any detectable changes in the population of Foxp3+ regulatory T (Treg) cells. Co-transfer experiments also demonstrated that Aire transgenic dendritic cells, as a "stand-alone" cell population, had the potential to suppress effector T cells in vivo without the support of Treg cells, but eventually failed to prevent the diabetogenesis in recipient mice. In conclusion, our study suggests that apart from its role in clonal deletion of autoreactive T cells or clonal diversion to Treg lineage, Aire can also contribute to tolerance by forcing effector T cells into a state of exhaustion with poor effector functions, thereby effectively containing autoimmune diseases.

Keywords: T cell exhaustion; autoimmune diabetes; autoimmune regulator; dendritic cells; effector T cells; regulatory T cells.


Figures

Figure 1
Figure 1
Generation of pCD11c-Aire transgenic non-obese diabetic mice. (A) Schematic diagram of pCD11c-Aire transgenic construct. Aire cDNA was cloned downstream of the CD11c promoter within a rabbit β-globin gene fragment that also contained an intron and a polyadenylation signal. (B) PCR genotyping of pCD11c-Aire and non-transgenic (non-Tg) littermate mice. Specifically designed primers were used to detect the transgenic Aire in genomic DNA (upper gel). HGPRT was used as internal control (lower gel). (C) Phenotypic characterization of splenic dendritic cells (DCs). Splenocytes were used for phenotypic analysis of splenic DCs using flow cytometry to analyze the surface expression of given cell surface markers. (D) Quantitative real-time (RT) PCR analysis of Aire and tissue-specific antigens. RNA was collected from splenic DCs and used as template for RT-PCR following cDNA synthesis, and normalized to Rps29 (Ribosomal protein S29) mRNA expression. IRBP, interphotoreceptor retinoid binding protein; Fabp2, fatty acid-binding protein 2; Sp1, salivary protein-1; Chrna1, acetylcholine receptor alpha 1; Csng, casein γ; Chga, chromogranin A; Mbp, myelin basic protein; Mog, myelin oligodendrocyte glycoprotein; Gad67, glutamic acid decarboxylase. White bars represent non-Tg DCs, while gray bars represent transgenic DCs. Data are representative of at least three different experiments. P-values, ** = 0.0015, * ≤ 0.05, and ns = not significant.
Figure 2
Figure 2
Dendritic cell-specific transgenic Aire expression significantly attenuates autoimmune diabetes in non-obese diabetic (NOD) mice. (A) Spontaneous diabetes incidence. Diabetes was detected by measuring urine glucose concentration for up to 40 weeks. Glycosuria was defined by urine glucose concentration >500 mg/dl in two consecutive tests. Open circles (n = 24) and solid red circles (n = 34) represent non-transgenic (non-Tg) and transgenic mice, respectively. P-value, ** = 0.0027 by log-rank test. (B) Assessment of insulitis. The severity of insulitis was evaluated in 10 pairs of 12- to 15-week-old transgenic and non-Tg mice by histological analysis of fixed pancreases. At least 100 islets were counted for each group. (C) Diabetes frequency following adoptive transfer of transgenic and non-Tg splenocytes. Splenocytes from non-Tg (open circles, n = 9 recipients) and transgenic mice (solid black circles, n = 8 recipients) were transferred to NOD-SCID recipients and diabetes was checked twice every week. P-value, * = 0.0279.
Figure 3
Figure 3
pCD11c-Aire mice have reduced populations of interferon-γ (IFN-γ) and tumor necrosis factor-α (TNF-α) expressing CD4+ and CD8+ effector T cells. (A) Thymocyte analysis. Thymocytes were collected from 8- to 10-week-old mice (n = 8 in each group) and analyzed for total cellularity and population of CD4CD8 (DN), CD4+CD8+ (DP), CD4+ (CD4-SP), CD8+ (CD8-SP), and CD4+FoxP3+ regulatory T cells. Non-transgenic and transgenic mice are represented by white and gray bars, respectively. (B) Spleen and pancreatic lymph nodes were collected from 8- to 10-week-old mice (n = 10 in each group) and analyzed for total cellularity. (C,D) IFN-γ and TNF-α expressing CD4+ T cell populations in the indicated organs. (E) IL-4 expressing CD4+ T cells in the indicated organs. (F,G) IFN-γ and TNF-α expressing CD8+ T cell populations in the indicated organs. (H) CD4+FoxP3+ regulatory T cell population in the indicated organs. P-values, ** ≤ 0.005, *** ≤ 0.0010, and ns = not significant.
Figure 4
Figure 4
pCD11c-Aire mice have fewer and less pathogenic T cells within the pancreas. (A) Reduction in lymphocyte populations within transgenic mice pancreases. Pancreases were collected from 12- to 15-week-old non-transgenic (non-Tg) (n = 13) and transgenic (n = 12) mice, lymphocytes were isolated and enumerated. (B) Lymphocytes from pancreases were analyzed for interferon-γ (IFN-γ) expressing CD4+ and CD8+ T cells (left) and expression levels of IFN-γ (right). (C) Lymphocytes from pancreases were analyzed for tumor necrosis factor-α (TNF-α) expressing CD4+ and CD8+ T cells (left) and expression levels of TNF-α (right). (D) Population of regulatory T cells in non-Tg and transgenic mice pancreases. P-values, * ≤ 0.05, ** ≤ 0.0050, and ns = not significant.
Figure 5
Figure 5
pCD11c-Aire mice harbor “exhausted” CD4+ and CD8+ T cell populations. (A) Programmed cell death protein-1 (PD-1) and T-bet expressing splenic CD4+ T cells in non-transgenic (non-Tg) and transgenic mice (n = 7 each). (B) PD-1 expression by splenic CD4+ T cells. (C) Population of splenic CD4+T-bet+ T cells with additional expression of the indicated markers associated with CD4+ T cell exhaustion. Non-Tg and transgenic mice are represented by white and gray bars, respectively. (D) PD-1 and eomesodermin (Eomes) expressing splenic CD8+ T cells in non-Tg and transgenic mice (n = 7 each). (E) PD-1 expression by splenic CD8+ T cells. (F) Population of splenic CD8+Eomes+ T cells expressing the indicated surface markers associated with CD8+ T cell exhaustion. P-values, * ≤ 0.05, ** ≤ 0.005.
Figure 6
Figure 6
Tolerance induction by pCD11c-Aire dendritic cells (DCs) is largely auto-antigen specific. (A) Effector cytokine expression by proinsulin-specific splenic CD4+ T cells. Splenocytes from non-transgenic (non-Tg) and transgenic mice were stimulated with proinsulin peptide for 18–24 h before analysis. (B) Effector cytokine expression by proinsulin peptide stimulated splenic CD4+ programmed cell death protein-1 (PD-1)lo and CD4+PD-1hi T cells in transgenic mice. (C) Splenic CD4+ T cell effector cytokine expression in BDC2.5 and BDC2.5/pCD11c-Aire mice. Splenocytes from BDC2.5 and BDC2.5/pCD11c-Aire mice were stimulated with p31 mimotope peptide (Table 2) for 18–24 h before analysis. (D) Splenic CD4+ Teff cell proliferation. Non-Tg or transgenic mice splenic CD4+ T cells were cultured with non-Tg mice splenic DCs in the presence of proinsulin peptide for 3 days before [methyl-3H] thymidine incorporation was measured (left). In addition, indicated CD4+T cells were stimulated non-specifically using PMA and ionomycin (right). White bars represent non-Tg mice CD4+ T cell proliferation whereas black bars represent transgenic mice CD4+ T cell proliferation. P-values, * ≤ 0.05, ** = 0.0062, and ns = not significant.
Figure 7
Figure 7
Dendritic cell (DC)–T cell co-transfer experiments reveal transgenic DCs to have strong tolerogenic but limited disease preventive potential. (A) Schematic diagram of DC-T cell co-transfer into RAG1/ mice. DCs from non-transgenic (non-Tg) or transgenic mice were mixed with CD4+ and CD8+ effector T cells and transferred into recipient mice for diabetes incidence and T cell analysis. (B) CD4+ T cell effector cytokine expression of mice recipient with non-Tg or transgenic DCs and effector T cells. (C) T-bet and programmed cell death protein-1 (PD-1) expression in CD4+ T cells from non-Tg DC (left) and transgenic DC (right) recipient RAG1/ mice. (D) CD8+ T cell effector cytokine expression of mice recipient with non-Tg or transgenic DCs and effector T cells. (E) Eomesodermin and PD-1 expression in CD8+ T cells from non-Tg DC (left) and transgenic DC (right) recipient RAG1/ mice. (F) Diabetes incidence in RAG1/ mice recipient with effector T cells with/without indicated DC populations. P-values, * ≤ 0.05, ** ≤ 0.0010, and ns = not significant.

Similar articles

Cited by

References

    1. Atkinson MA. The pathogenesis and natural history of type 1 diabetes. Cold Spring Harb Perspect Med (2012) 2(11):a007641.10.1101/cshperspect.a007641 - DOI - PMC - PubMed
    1. Atkinson MA, Eisenbarth GS, Michels AW. Type 1 diabetes. Lancet (2014) 383(9911):69–82.10.1016/s0140-6736(13)60591-7 - DOI - PMC - PubMed
    1. Bluestone JA, Herold K, Eisenbarth G. Genetics, pathogenesis and clinical interventions in type 1 diabetes. Nature (2010) 464(7293):1293–300.10.1038/nature08933 - DOI - PMC - PubMed
    1. Kyewski B, Klein L. A central role for central tolerance. Annu Rev Immunol (2006) 24:571–606.10.1146/annurev.immunol.23.021704.115601 - DOI - PubMed
    1. Mathis D, Benoist C. Aire. Annu Rev Immunol (2009) 27:287–312.10.1146/annurev.immunol.25.022106.141532 - DOI - PubMed