

SIRT1/Adenosine Monophosphate-Activated Protein Kinase α Signaling Enhances Macrophage Polarization to an Anti-inflammatory Phenotype in Rheumatoid Arthritis
- PMID: 28966618
- PMCID: PMC5605563
- DOI: 10.3389/fimmu.2017.01135
SIRT1/Adenosine Monophosphate-Activated Protein Kinase α Signaling Enhances Macrophage Polarization to an Anti-inflammatory Phenotype in Rheumatoid Arthritis
Abstract
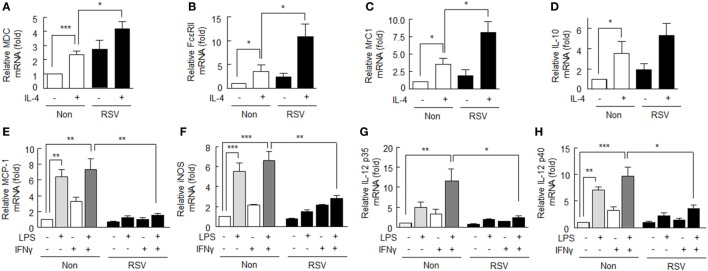
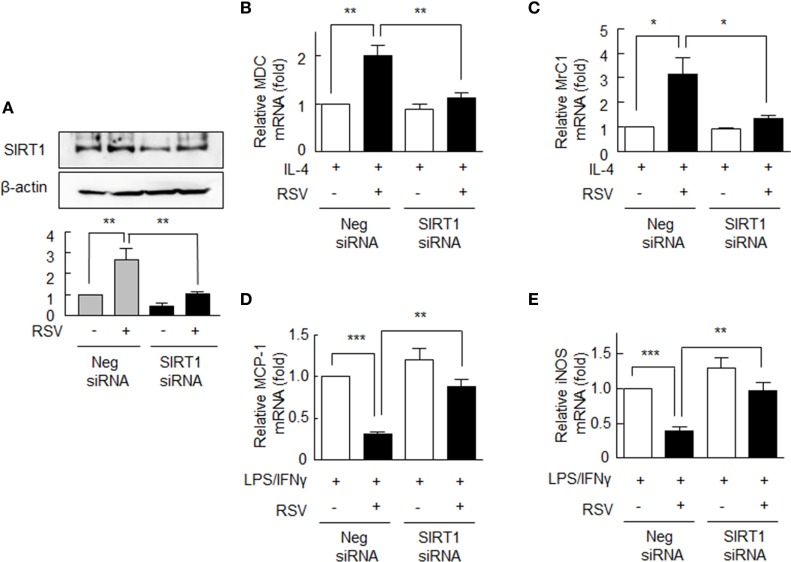
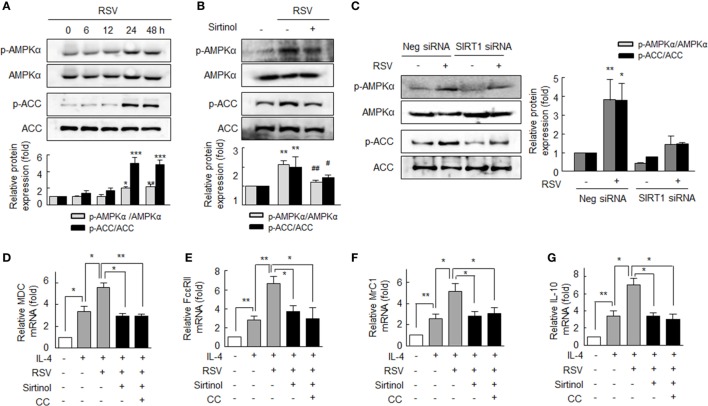
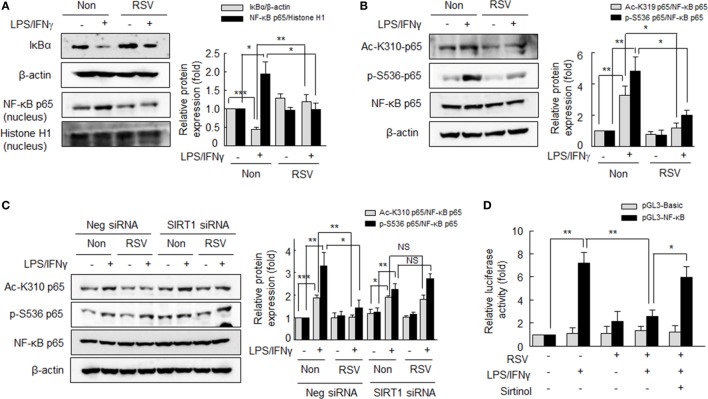
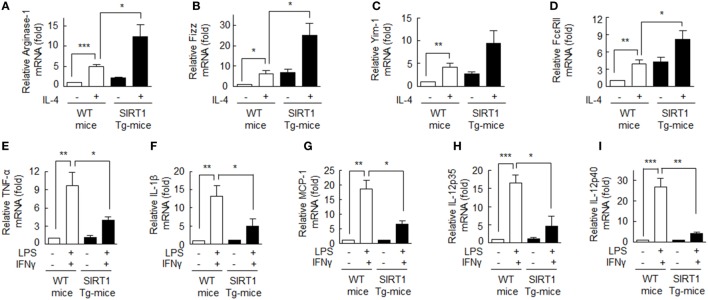
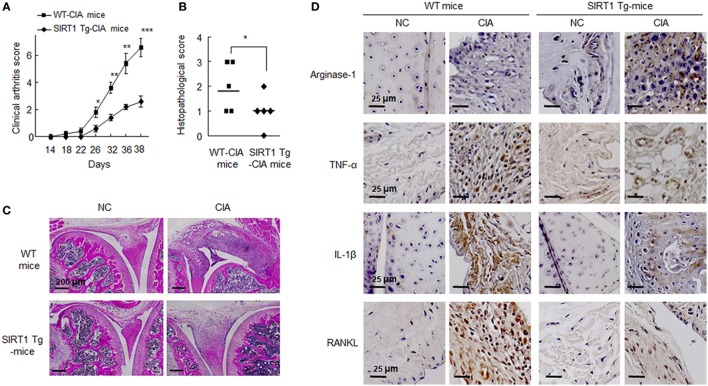
Macrophages are crucially involved in the pathogenesis of rheumatoid arthritis (RA). Macrophages of the M1 phenotype act as pro-inflammatory mediators in synovium, whereas those of the M2 phenotype suppress inflammation and promote tissue repair. SIRT1 is a class 3 histone deacetylase with anti-inflammatory characteristics. However, the role played by SIRT1 in macrophage polarization has not been defined in RA. We investigated whether SIRT1 exerts anti-inflammatory effects by modulating M1/M2 polarization in macrophages from RA patients. In this study, SIRT1 activation promoted the phosphorylation of an adenosine monophosphate-activated protein kinase (AMPK) α/acetyl-CoA carboxylase in macrophages exposed to interleukin (IL)-4, and that this resulted in the expressions of M2 genes, including MDC, FcεRII, MrC1, and IL-10, at high levels. Furthermore, these expressions were inhibited by sirtinol (an inhibitor of SIRT1) and compound C (an inhibitor of AMPK). Moreover, SIRT1 activation downregulated LPS/interferon γ-mediated NF-κB activity by inhibiting p65 acetylation and the expression of M1 genes, such as CCL2, iNOS, IL-12 p35, and IL-12 p40. Macrophages from SIRT1 transgenic (Tg)-mice exhibited enhanced polarization of M2 phenotype macrophages and reduced polarization of M1 phenotype macrophages. In line with these observations, SIRT1-Tg mice showed less histological signs of arthritis, that is, lower TNFα and IL-1β expressions and less severe arthritis in the knee joints, compared to wild-type mice. Taken together, the study shows activation of SIRT1/AMPKα signaling exerts anti-inflammatory activities by regulating M1/M2 polarization, and thereby reduces inflammatory responses in RA. Furthermore, it suggests that SIRT1 signaling be viewed as a therapeutic target in RA.
Keywords: M1/M2 macrophages; SIRT1; adenosine monophosphate-activated protein kinase α; inflammation; macrophage polarization; rheumatoid arthritis.
Figures
Similar articles
-
SIRT1 inhibits differentiation of monocytes to macrophages: amelioration of synovial inflammation in rheumatoid arthritis.J Mol Med (Berl). 2016 Aug;94(8):921-31. doi: 10.1007/s00109-016-1402-7. Epub 2016 Mar 9. J Mol Med (Berl). 2016. PMID: 26956118
-
Glaucocalyxin B inhibits cartilage inflammatory injury in rheumatoid arthritis by regulating M1 polarization of synovial macrophages through NF-κB pathway.Aging (Albany NY). 2021 Sep 27;13(18):22544-22555. doi: 10.18632/aging.203567. Epub 2021 Sep 27. Aging (Albany NY). 2021. PMID: 34580236 Free PMC article.
-
Cannabinoid Receptor 1 Participates in Liver Inflammation by Promoting M1 Macrophage Polarization via RhoA/NF-κB p65 and ERK1/2 Pathways, Respectively, in Mouse Liver Fibrogenesis.Front Immunol. 2017 Sep 28;8:1214. doi: 10.3389/fimmu.2017.01214. eCollection 2017. Front Immunol. 2017. PMID: 29033935 Free PMC article.
-
Antagonistic crosstalk between NF-κB and SIRT1 in the regulation of inflammation and metabolic disorders.Cell Signal. 2013 Oct;25(10):1939-48. doi: 10.1016/j.cellsig.2013.06.007. Epub 2013 Jun 11. Cell Signal. 2013. PMID: 23770291 Review.
-
The Role of M1/M2 Macrophage Polarization in Rheumatoid Arthritis Synovitis.Front Immunol. 2022 May 19;13:867260. doi: 10.3389/fimmu.2022.867260. eCollection 2022. Front Immunol. 2022. PMID: 35663975 Free PMC article. Review.
Cited by
-
Role of SIRT1 in Chemoresistant Leukemia.Int J Mol Sci. 2023 Sep 23;24(19):14470. doi: 10.3390/ijms241914470. Int J Mol Sci. 2023. PMID: 37833921 Free PMC article. Review.
-
Hydrogen Sulfide: a Novel Immunoinflammatory Regulator in Rheumatoid Arthritis.Adv Exp Med Biol. 2021;1315:161-179. doi: 10.1007/978-981-16-0991-6_7. Adv Exp Med Biol. 2021. PMID: 34302692 Review.
-
Corticosterone Enhances the AMPK-Mediated Immunosuppressive Phenotype of Testicular Macrophages During Uropathogenic Escherichia coli Induced Orchitis.Front Immunol. 2020 Dec 8;11:583276. doi: 10.3389/fimmu.2020.583276. eCollection 2020. Front Immunol. 2020. PMID: 33363533 Free PMC article.
-
Impact of glucocorticoids on systemic sirtuin 1 expression and activity in rats with adjuvant-induced arthritis.Epigenetics. 2021 Jan-Feb;16(2):132-143. doi: 10.1080/15592294.2020.1790789. Epub 2020 Jul 13. Epigenetics. 2021. PMID: 32615849 Free PMC article.
-
Loganin inhibits macrophage M1 polarization and modulates sirt1/NF-κB signaling pathway to attenuate ulcerative colitis.Bioengineered. 2020 Dec;11(1):628-639. doi: 10.1080/21655979.2020.1774992. Bioengineered. 2020. PMID: 33034242 Free PMC article.
References
LinkOut - more resources
Full Text Sources
Other Literature Sources
Research Materials
Miscellaneous