

Changes in T Cell and Dendritic Cell Phenotype from Mid to Late Pregnancy Are Indicative of a Shift from Immune Tolerance to Immune Activation
- PMID: 28966619
- PMCID: PMC5605754
- DOI: 10.3389/fimmu.2017.01138
Changes in T Cell and Dendritic Cell Phenotype from Mid to Late Pregnancy Are Indicative of a Shift from Immune Tolerance to Immune Activation
Abstract
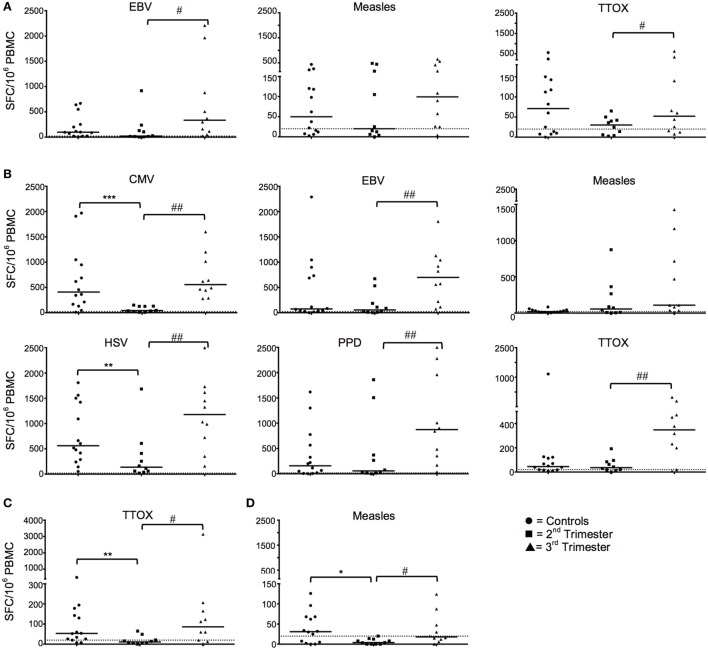
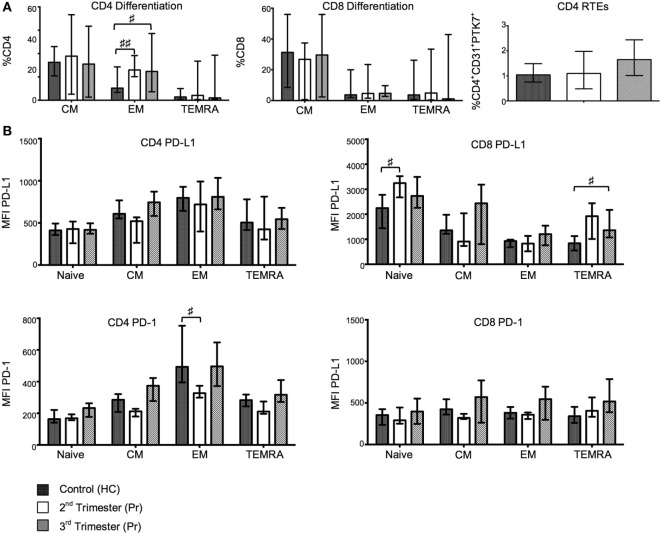
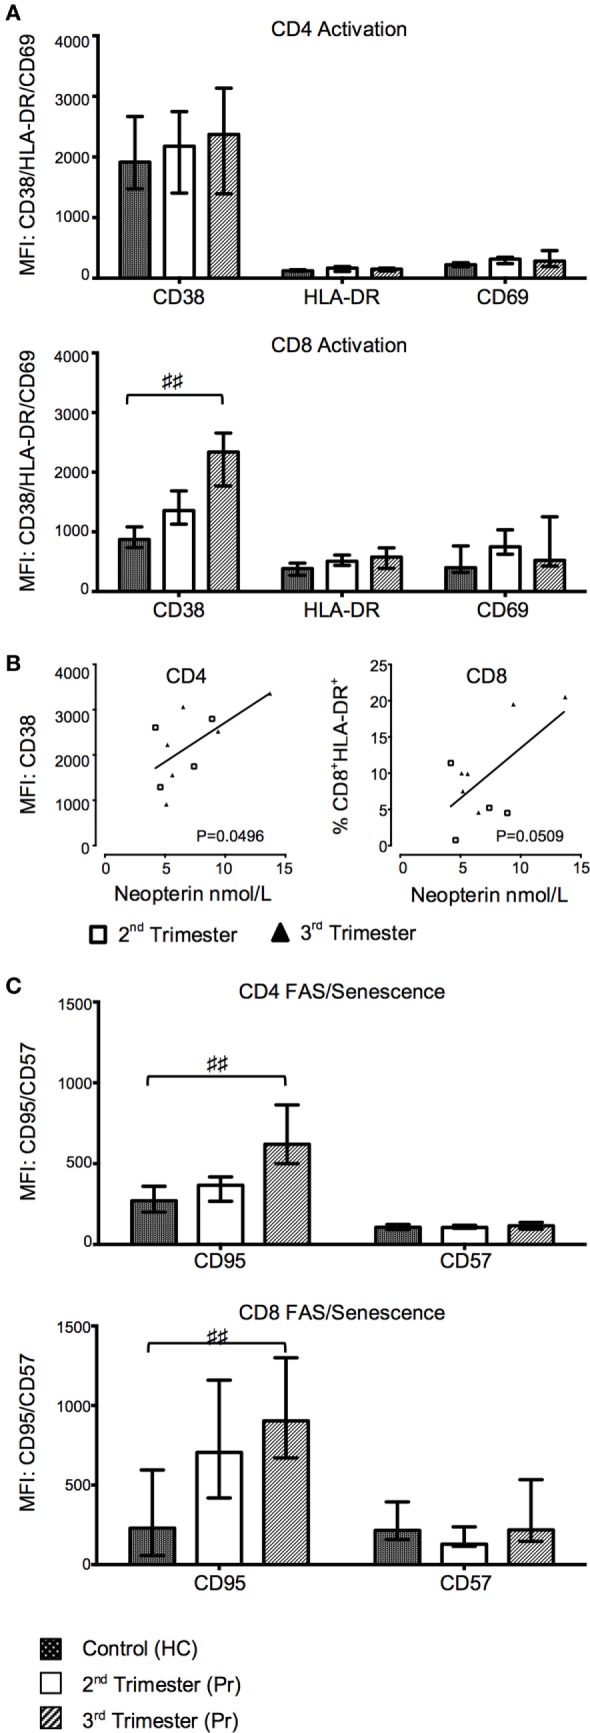
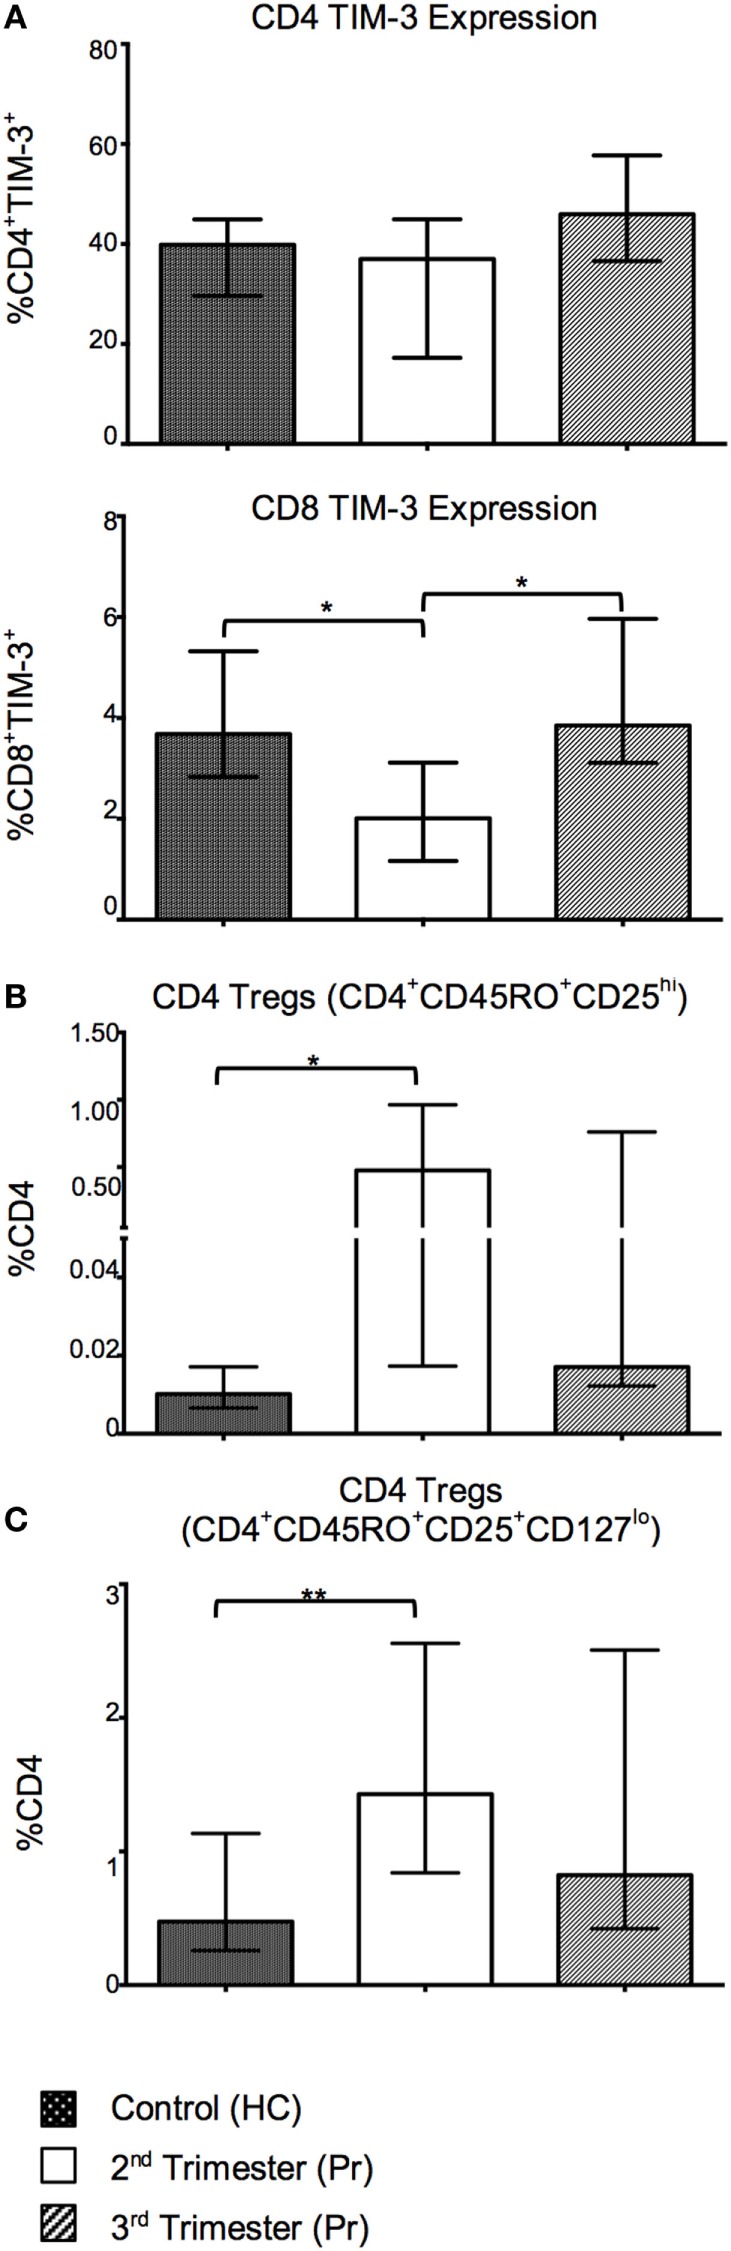
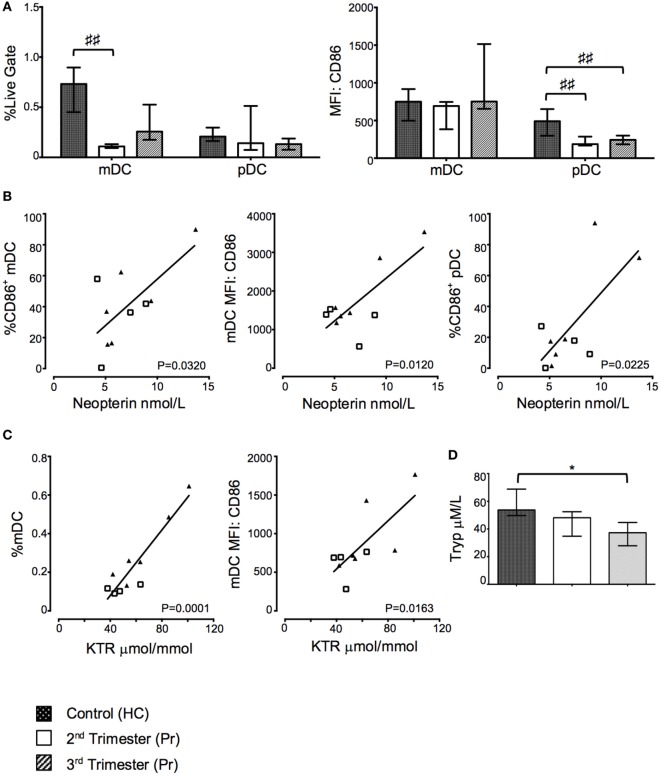
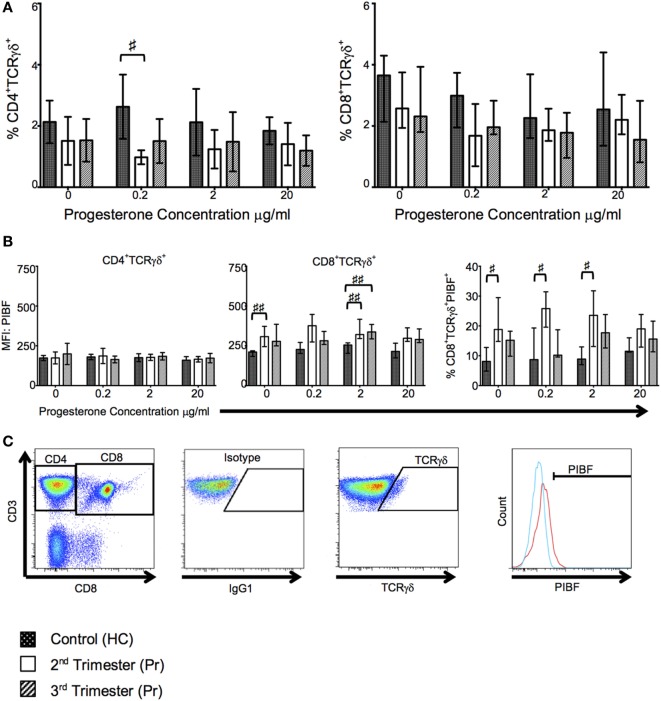
During pregnancy, the mother allows the immunologically distinct fetoplacental unit to develop and grow. Opinions are divided as to whether this represents a state of fetal-specific tolerance or of a generalized suppression of the maternal immune system. We hypothesized that antigen-specific T cell responses are modulated by an inhibitory T cell phenotype and modified dendritic cell (DC) phenotype in a gestation-dependent manner. We analyzed changes in surface markers of peripheral blood T cells, ex vivo antigen-specific T cell responses, indoleamine 2,3-dioxygenase (IDO) activity (kynurenine/tryptophan ratio, KTR), plasma neopterin concentration, and the in vitro expression of progesterone-induced blocking factor (PIBF) in response to peripheral blood mononuclear cell culture with progesterone. We found that mid gestation is characterized by reduced antigen-specific T cell responses associated with (1) predominance of effector memory over other T cell subsets; (2) upregulation of inhibitory markers (programmed death ligand 1); (3) heightened response to progesterone (PIBF); and (4) reduced proportions of myeloid DC and concurrent IDO activity (KTR). Conversely, antigen-specific T cell responses normalized in late pregnancy and were associated with increased markers of T cell activation (CD38, neopterin). However, these changes occur with a simultaneous upregulation of immune suppressive mechanisms including apoptosis (CD95), coinhibition (TIM-3), and immune regulation (IL-10) through the course of pregnancy. Together, our data suggest that immune tolerance dominates in the second trimester and that it is gradually reversed in the third trimester in association with immune activation as the end of pregnancy approaches.
Keywords: activation; immune modulation; immune response; pregnancy; tolerance.
Figures
Similar articles
-
Localisation of indoleamine 2,3-dioxygenase and kynurenine hydroxylase in the human placenta and decidua: implications for role of the kynurenine pathway in pregnancy.Placenta. 2005 Jul;26(6):498-504. doi: 10.1016/j.placenta.2004.08.009. Placenta. 2005. PMID: 15950064
-
Indoleamine 2,3-dioxygenase (IDO) expression in invasive extravillous trophoblast supports role of the enzyme for materno-fetal tolerance.J Reprod Immunol. 2004 Apr;61(2):79-86. doi: 10.1016/j.jri.2003.11.002. J Reprod Immunol. 2004. PMID: 15063631
-
Monocyte-derived dendritic cells from late gestation cows have an impaired ability to mature in response to E. coli stimulation in a receptor and cytokine-mediated fashion.Vet Immunol Immunopathol. 2015 Sep 15;167(1-2):22-9. doi: 10.1016/j.vetimm.2015.06.016. Epub 2015 Jul 2. Vet Immunol Immunopathol. 2015. PMID: 26163935
-
Tumor immune escape mediated by indoleamine 2,3-dioxygenase.Immunol Lett. 2007 Aug 15;111(2):69-75. doi: 10.1016/j.imlet.2007.06.001. Epub 2007 Jul 2. Immunol Lett. 2007. PMID: 17644189 Review.
-
Extinguishing maternal immune responses during pregnancy: implications for immunosuppression.Semin Immunol. 2001 Aug;13(4):213-8. doi: 10.1006/smim.2000.0317. Semin Immunol. 2001. PMID: 11437628 Review.
Cited by
-
Estradiol Attenuates the Severity of Primary Toxoplasma gondii Infection-Induced Adverse Pregnancy Outcomes Through the Regulation of Tregs in a Dose-Dependent Manner.Front Immunol. 2018 May 18;9:1102. doi: 10.3389/fimmu.2018.01102. eCollection 2018. Front Immunol. 2018. PMID: 29868037 Free PMC article.
-
Progesterone Modulation of Pregnancy-Related Immune Responses.Front Immunol. 2018 Jun 20;9:1293. doi: 10.3389/fimmu.2018.01293. eCollection 2018. Front Immunol. 2018. PMID: 29973928 Free PMC article.
-
Immunobiology of Acute Chorioamnionitis.Front Immunol. 2020 Apr 16;11:649. doi: 10.3389/fimmu.2020.00649. eCollection 2020. Front Immunol. 2020. PMID: 32373122 Free PMC article. Review.
-
Uterine Dendritic Cells Modulation by Mesenchymal Stem Cells Provides A Protective Microenvironment at The Feto-Maternal Interface: Improved Pregnancy Outcome in Abortion-Prone Mice.Cell J. 2019 Oct;21(3):274-280. doi: 10.22074/cellj.2019.6239. Epub 2019 Jun 15. Cell J. 2019. PMID: 31210433 Free PMC article.
-
The metabolic and immunological characteristics of pregnant women with COVID-19 and their neonates.Eur J Clin Microbiol Infect Dis. 2021 Mar;40(3):565-574. doi: 10.1007/s10096-020-04033-0. Epub 2020 Oct 2. Eur J Clin Microbiol Infect Dis. 2021. PMID: 33006691 Free PMC article.
References
LinkOut - more resources
Full Text Sources
Other Literature Sources
Research Materials