

Motility-driven glass and jamming transitions in biological tissues
- PMID: 28966874
- PMCID: PMC5619672
- DOI: 10.1103/PhysRevX.6.021011
Motility-driven glass and jamming transitions in biological tissues
Abstract
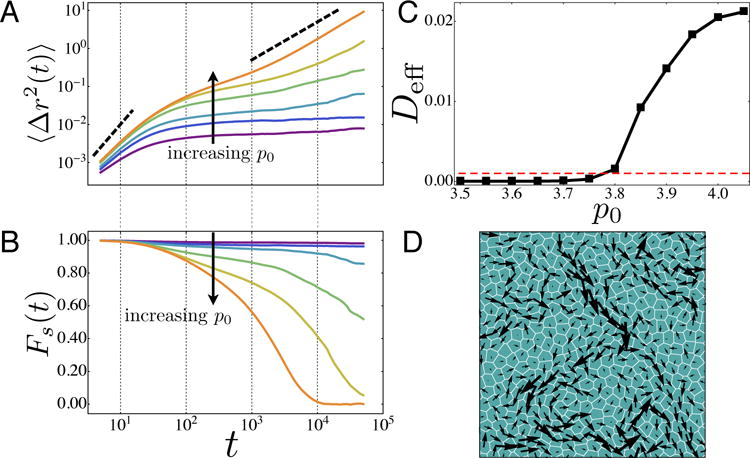
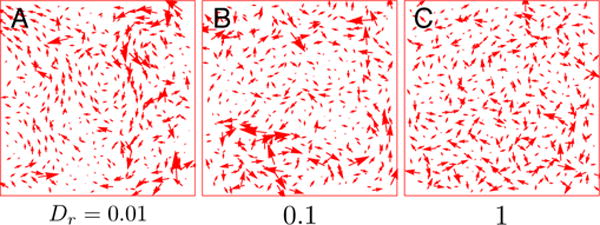
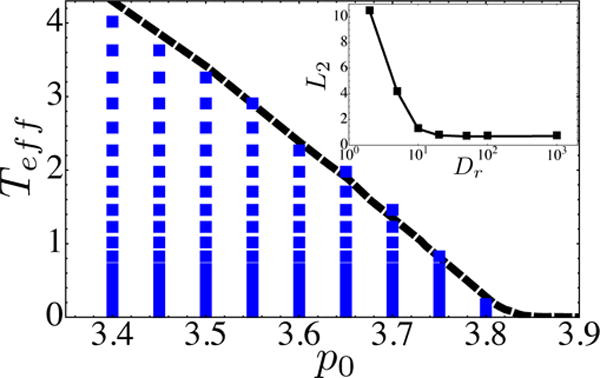
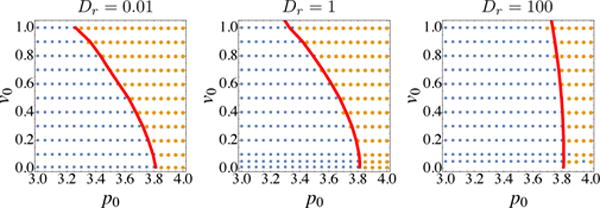
Cell motion inside dense tissues governs many biological processes, including embryonic development and cancer metastasis, and recent experiments suggest that these tissues exhibit collective glassy behavior. To make quantitative predictions about glass transitions in tissues, we study a self-propelled Voronoi (SPV) model that simultaneously captures polarized cell motility and multi-body cell-cell interactions in a confluent tissue, where there are no gaps between cells. We demonstrate that the model exhibits a jamming transition from a solid-like state to a fluid-like state that is controlled by three parameters: the single-cell motile speed, the persistence time of single-cell tracks, and a target shape index that characterizes the competition between cell-cell adhesion and cortical tension. In contrast to traditional particulate glasses, we are able to identify an experimentally accessible structural order parameter that specifies the entire jamming surface as a function of model parameters. We demonstrate that a continuum Soft Glassy Rheology model precisely captures this transition in the limit of small persistence times, and explain how it fails in the limit of large persistence times. These results provide a framework for understanding the collective solid-to-liquid transitions that have been observed in embryonic development and cancer progression, which may be associated with Epithelial-to-Mesenchymal transition in these tissues.
Figures


Similar articles
-
A shape-driven reentrant jamming transition in confluent monolayers of synthetic cell-mimics.Nat Commun. 2024 Jul 5;15(1):5645. doi: 10.1038/s41467-024-49044-z. Nat Commun. 2024. PMID: 38969629 Free PMC article.
-
Flocking transitions in confluent tissues.Soft Matter. 2018 May 9;14(18):3471-3477. doi: 10.1039/c8sm00126j. Soft Matter. 2018. PMID: 29693694 Free PMC article.
-
Correlating cell shape and cellular stress in motile confluent tissues.Proc Natl Acad Sci U S A. 2017 Nov 28;114(48):12663-12668. doi: 10.1073/pnas.1705921114. Epub 2017 Nov 14. Proc Natl Acad Sci U S A. 2017. PMID: 29138312 Free PMC article.
-
Cell jamming-to-unjamming transitions and vice versa in development: Physical aspects.Biosystems. 2023 Dec;234:105045. doi: 10.1016/j.biosystems.2023.105045. Epub 2023 Oct 7. Biosystems. 2023. PMID: 37813238 Review.
-
Jamming and arrest of cell motion in biological tissues.Curr Opin Cell Biol. 2021 Oct;72:146-155. doi: 10.1016/j.ceb.2021.07.011. Epub 2021 Aug 27. Curr Opin Cell Biol. 2021. PMID: 34461581 Review.
Cited by
-
A shape-driven reentrant jamming transition in confluent monolayers of synthetic cell-mimics.Nat Commun. 2024 Jul 5;15(1):5645. doi: 10.1038/s41467-024-49044-z. Nat Commun. 2024. PMID: 38969629 Free PMC article.
-
Area and Geometry Dependence of Cell Migration in Asymmetric Two-State Micropatterns.Biophys J. 2020 Feb 4;118(3):552-564. doi: 10.1016/j.bpj.2019.11.3389. Epub 2019 Nov 29. Biophys J. 2020. PMID: 31864660 Free PMC article.
-
Unleashing shear: Role of intercellular traction and cellular moments in collective cell migration.Biochem Biophys Res Commun. 2020 Feb 5;522(2):279-285. doi: 10.1016/j.bbrc.2019.11.048. Epub 2019 Dec 24. Biochem Biophys Res Commun. 2020. PMID: 31879014 Free PMC article.
-
A multiscale computational model of YAP signaling in epithelial fingering behavior.Biophys J. 2022 May 17;121(10):1940-1948. doi: 10.1016/j.bpj.2022.04.010. Epub 2022 Apr 14. Biophys J. 2022. PMID: 35422412 Free PMC article.
-
Collective motion of epithelial cells along a wrinkled 3D-buckled hydrogel.RSC Adv. 2022 Jul 12;12(31):20174-20181. doi: 10.1039/d2ra01768g. eCollection 2022 Jul 6. RSC Adv. 2022. PMID: 35919621 Free PMC article.
References
-
- Abate AR, Durian DJ. Effective temperatures and activated dynamics for a two-dimensional air-driven granular system on two approaches to jamming. Phys Rev Lett. 2008 Dec;101:245701. - PubMed
-
- Belmonte Julio M, Thomas Gilberto L, Brunnet Leonardo G, de Almeida Rita M C, Chaté Hugues. Self-propelled particle model for cell-sorting phenomena. Phys Rev Lett. 2008 Jun;100:248702. - PubMed
-
- Ben-Isaac E, Fodor É, Visco P, van Wijland F, Gov Nir S. Modeling the dynamics of a tracer particle in an elastic active gel. Phys Rev E. 2015 Jul;92:012716. - PubMed
Grants and funding
LinkOut - more resources
Full Text Sources
Other Literature Sources