. 2017 Sep 22;4(5):ENEURO.0013-17.2017.
doi: 10.1523/ENEURO.0013-17.2017. eCollection 2017 Sep-Oct.

Neurochemical Heterogeneity Among Lateral Hypothalamic Hypocretin/Orexin and Melanin-Concentrating Hormone Neurons Identified Through Single-Cell Gene Expression Analysis

Affiliations

Neurochemical Heterogeneity Among Lateral Hypothalamic Hypocretin/Orexin and Melanin-Concentrating Hormone Neurons Identified Through Single-Cell Gene Expression Analysis

Laura E Mickelsen et al. eNeuro. .

Abstract

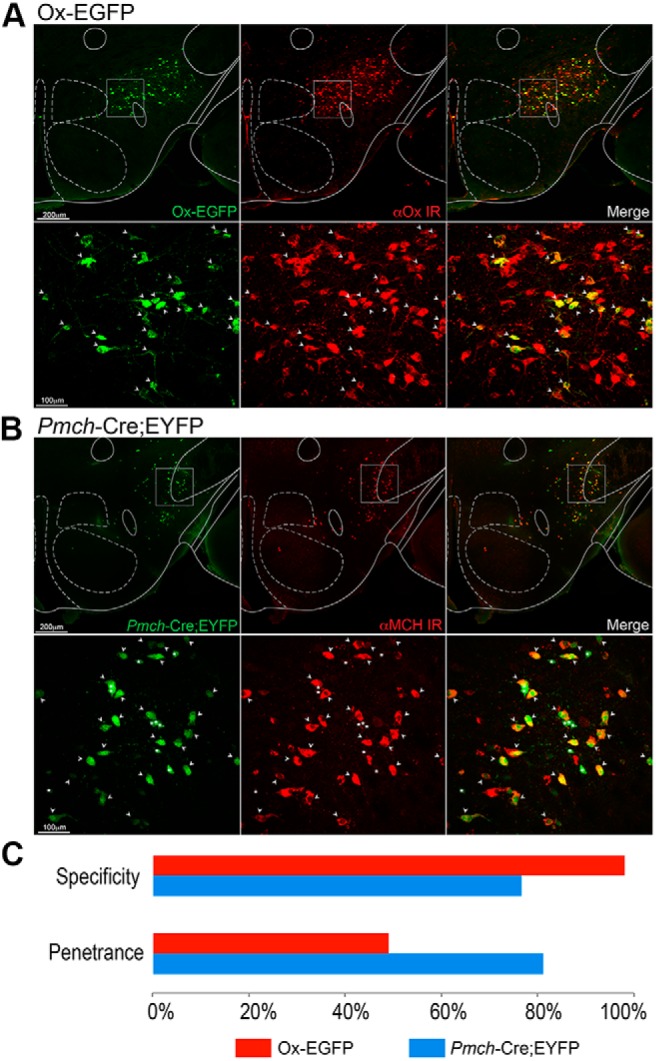
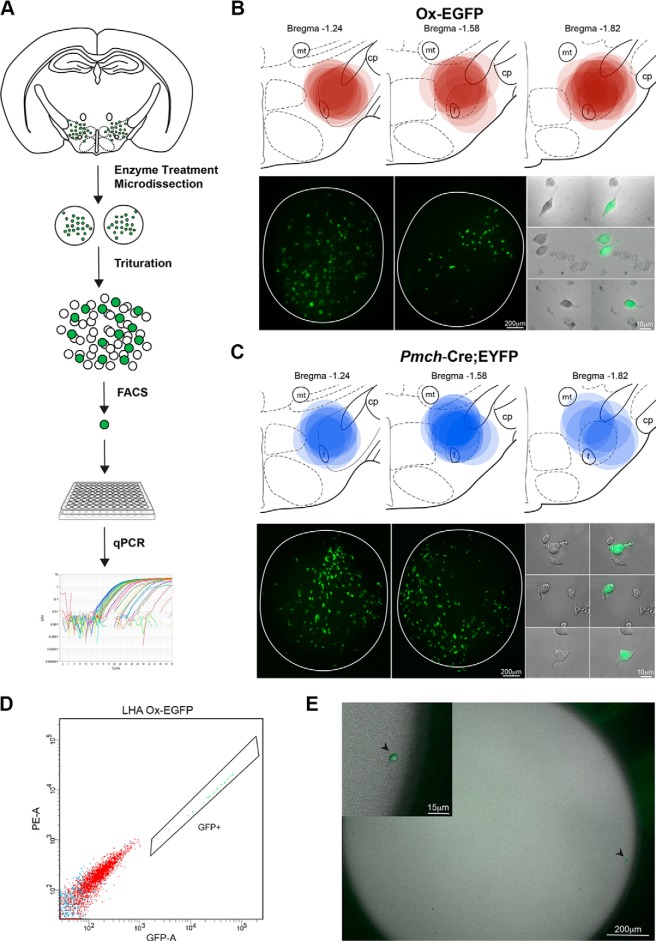
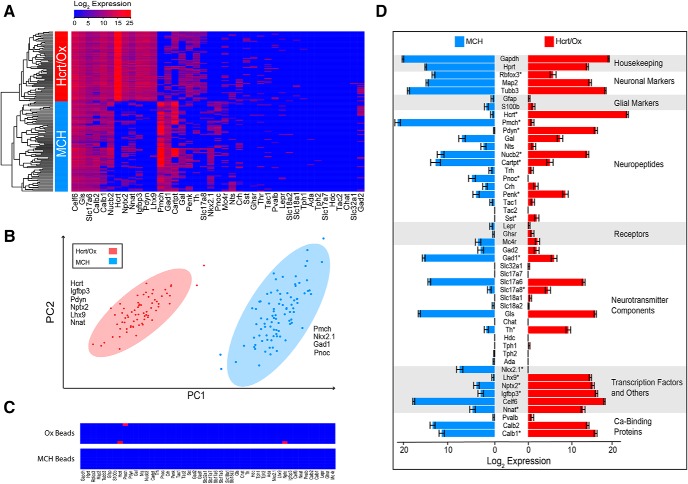
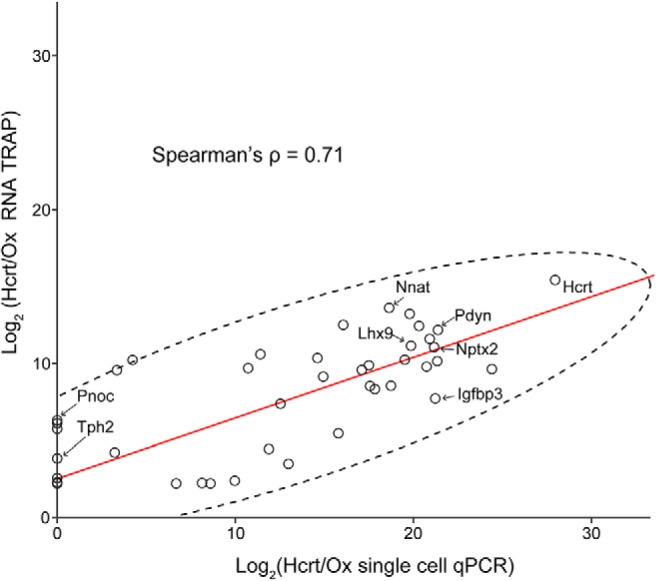
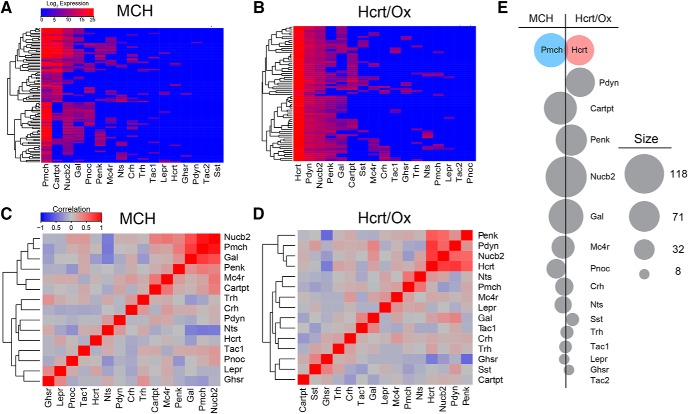
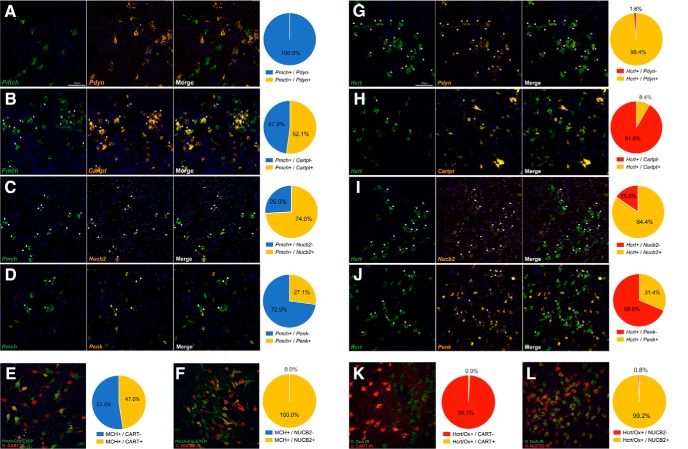
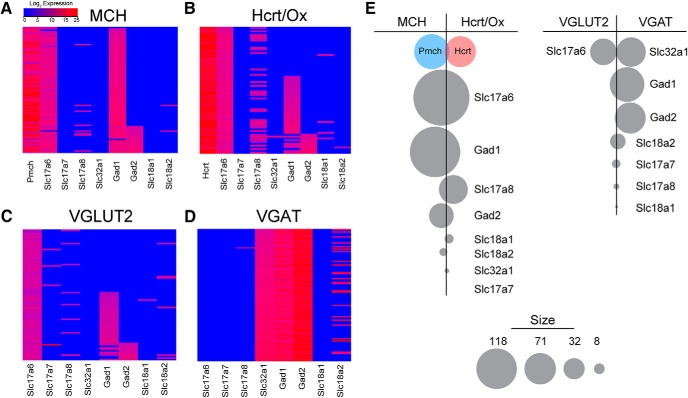
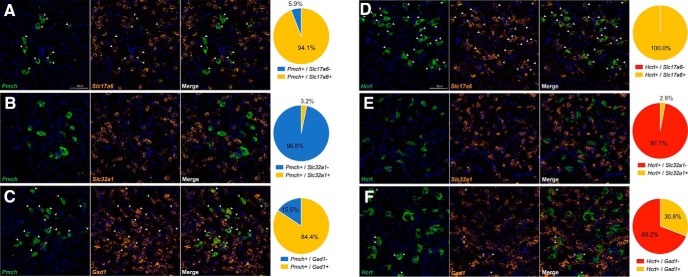
The lateral hypothalamic area (LHA) lies at the intersection of multiple neural and humoral systems and orchestrates fundamental aspects of behavior. Two neuronal cell types found in the LHA are defined by their expression of hypocretin/orexin (Hcrt/Ox) and melanin-concentrating hormone (MCH) and are both important regulators of arousal, feeding, and metabolism. Conflicting evidence suggests that these cell populations have a more complex signaling repertoire than previously appreciated, particularly in regard to their coexpression of other neuropeptides and the machinery for the synthesis and release of GABA and glutamate. Here, we undertook a single-cell expression profiling approach to decipher the neurochemical phenotype, and heterogeneity therein, of Hcrt/Ox and MCH neurons. In transgenic mouse lines, we used single-cell quantitative polymerase chain reaction (qPCR) to quantify the expression of 48 key genes, which include neuropeptides, fast neurotransmitter components, and other key markers, which revealed unexpected neurochemical diversity. We found that single MCH and Hcrt/Ox neurons express transcripts for multiple neuropeptides and markers of both excitatory and inhibitory fast neurotransmission. Virtually all MCH and approximately half of the Hcrt/Ox neurons sampled express both the machinery for glutamate release and GABA synthesis in the absence of a vesicular GABA release pathway. Furthermore, we found that this profile is characteristic of a subpopulation of LHA glutamatergic neurons but contrasts with a broad population of LHA GABAergic neurons. Identifying the neurochemical diversity of Hcrt/Ox and MCH neurons will further our understanding of how these populations modulate postsynaptic excitability through multiple signaling mechanisms and coordinate diverse behavioral outputs.

Keywords: cotransmission; hypocretin/orexin; lateral hypothalamic area; melanin-concentrating hormone; neuropeptide; neurotransmitter.


Figures

Figure 1.
Figure 1.
Characterization of Ox-EGFP and Pmch-Cre;EYFP mouse lines. A, Fluorescent micrographs (top) of coronal sections of Ox-EGFP mouse brains counterstained for anti-OxA and confocal micrographs of the boxed region (bottom). White arrows indicate co-localization. B, Fluorescent micrographs (top) of coronal sections of Pmch-Cre;EYFP mouse brains counterstained for anti-MCH and corresponding confocal micrographs (bottom). White arrows indicate co-localization. C, Bar graph representing specificity and penetrance of Ox-EGFP mice (red, n = 3) and Pmch-Cre;EYFP (blue, n = 3).
Figure 2.
Figure 2.
Microdissection of the LHA and isolation of single Ox-EGFP and Pmch-Cre;EYFP neurons. A, Schematic representation of microdissection and cell isolation procedure. B, Schematic of the location of tissue punches from Ox-EGFP microdissections mapped onto serial mouse brain atlas images of the hypothalamus (top), representative bilateral tissue punches and isolated EGFP+ and EGFP- neurons (bottom). C, Schematic of tissue punches from Pmch-Cre;EYFP microdissections (top), representative tissue punches and isolated EYFP+ and EYFP- neurons (bottom). D, Representative FACS sort of Ox-EGFP neurons showing fluorescence gates for PE-A versus GFP-A showing GFP gate. E, Brightfield and fluorescent micrograph of a representative single Ox-EGFP neuron isolated via FACS in a single well of a Terasaki plate. Higher magnification image of the same Ox-EGFP neuron in the upper left corner inset.
Figure 3.
Figure 3.
Single-cell qPCR of 48 genes in Hcrt/Ox and MCH neurons. A, Unsupervised hierarchical clustering heatmap of 89 MCH and 69 Hcrt/Ox single cells measured for the expression of 41 genes by qPCR. Genes not represented in this heatmap are housekeeping genes, neuronal and glial markers (Gapdh, Hprt, Rbfox3, Map2, Tubb3, Gfap, and S100b). Heatmap colors depict expression levels on a log2 scale from low (blue) to high (red). B, Principal component analysis (PCA) using the same cells and genes as in A. Ellipses denote 95% coverage for the populations indicated. Gene names represent transcripts enriched in each population based on the top loading scores from the first principal component. C, Manually ordered heatmap showing 48 gene qPCR of APC bead negative controls from Hcrt/Ox and MCH cell preparations. D, Bar chart of averaged log2 expression values for 48 genes in Hcrt/Ox and MCH cells organized by molecular function. Error bars represent standard error of the mean (s.e.m.) for each sample/gene. Asterisks (*) denote statistically significant proportional difference using Fisher’s exact test, adjusted p < 0.05 (from Table 2) and the Benjamini-Hochberg procedure to control false discovery rate (FDR) at 5%. In all panels, red denotes Hcrt/Ox neurons and blue denotes MCH neurons.
Figure 4.
Figure 4.
Comparison of single-cell qPCR data to previously published RNA-TRAP dataset. Scatterplot showing expression of all 41 genes measured in both our single-cell qPCR dataset (x-axis) and in a previously published bulk RNA TRAP experiment (y-axis; Dalal et al., 2013). The two datasets show strong correlation (Spearman's ρ = 0.71; p = 1.2 × 10⁻⁸), the red line depicts the Spearman's correlation, dotted ellipse denotes 95% coverage of the data points.
Figure 5.
Figure 5.
Analysis of neuropeptide and receptor coexpression patterns. A, B, Unsupervised hierarchical clustering heatmap of neuropeptide gene expression in MCH (A) and Hcrt/Ox (B) neurons. C, D, Clustered heatmap of pairwise Pearson correlations between neuropeptides in MCH (C) and Hcrt/Ox (D) neurons. E, Bubble plot depicts the net difference in expression frequency for the neuropeptides indicated. Neuropeptides with a higher frequency of detection in MCH cells are shown to the left of the black line, higher frequency of detection in Hcrt/Ox cells to the right. Area of the circles represents the total number of cells from both populations expressing a given neuropeptide.
Figure 6.
Figure 6.
In situ hybridization and immunohistochemical validation of neuropeptide expression in Hcrt/Ox and MCH neurons. A–D, Confocal micrographs (40×) of coronal sections from wild type mice and corresponding pie charts representing coexpression of mRNA for Pmch and Pdyn, n = 47 cells (A), Pmch and Cartpt, n = 190 cells (B), Pmch and Nucb2, n = 77 cells (C), and Pmch and Penk, n = 75 cells (D); all counterstained with DAPI (blue). White arrows indicate coexpression. E, F, Confocal micrographs (40×) of coronal sections from Pmch-cre;EYFP mice counterstained for anti-GFP (green), anti-CART (red), n = 134 cells (E), and anti-NUCB2 (red), n = 134 (F); all counterstained for DAPI (blue). G–J, Confocal micrographs (40×) of coronal sections from wild type mice and corresponding pie charts representing coexpression of mRNA for Hcrt and Pdyn, n = 125 cells (G), Hcrt and Cartpt, n = 154 cells (H), Hcrt and Nucb2, n = 90 cells (I), and Hcrt and Penk, n = 169 cells (J); all counterstained with DAPI (blue). White arrows indicate coexpression. K, L, Confocal micrographs (40×) of coronal sections from wild type mice counterstained for anti-OxA (green) and anti-CART (red), n = 115 (K), and anti-NUCB2 (red), n = 115 (M); all counterstained with DAPI (blue).
Figure 7.
Figure 7.
Analysis of fast amino acid neurotransmitter phenotypes. A, B, Manually ordered heatmaps of neurotransmitter expression in MCH (A) and Hcrt/Ox (B) neurons, arranged by function in glutamatergic or GABAergic release pathways. C, D, Manually ordered heatmaps of neurotransmitter expression in VGLUT2+ (C) and VGAT+ (D) neurons isolated from Vglut2-Cre;EYFP and Vgat-Cre;EYFP mice, respectively, arranged by function in glutamatergic or GABAergic release pathways. E, Bubble plot depicts the net difference of detection in expression frequency of the neurotransmitter component indicated. Left, Neurotransmitters with higher frequency of detection in MCH neurons are to the left of the black line, higher frequency in Hcrt/Ox neurons to the right. Right, Neurotransmitters with higher frequency of detection in VGLUT2 neurons are to the left of the black line, higher frequency in VGAT neurons to the right.
Figure 8.
Figure 8.
In situ hybridization validation of fast amino acid neurotransmitter expression in Hcrt/Ox and MCH neurons. A–C, Confocal micrographs (40×) of coronal sections from wild type mice and corresponding pie charts representing coexpression of mRNA for Pmch and Slc17a6, n = 51 cells (A), Pmch and Slc32a1, n = 63 cells (B), and Pmch and Gad1, n = 224 cells (C); all sections counterstained with DAPI (blue). D–F, Confocal micrographs (40×) of coronal sections from wild type mice and corresponding pie charts representing coexpression of mRNA for Hcrt and Slc17a6, n = 45 cells (D), Hcrt and Slc32a1, n = 170 cells (E), and Hcrt and Gad1, n = 237 (F); all sections counterstained with DAPI (blue). White arrows indicate coexpression.
Figure 9.
Figure 9.
Manual (patch) harvest of mRNA from Hcrt/Ox neurons and correlation between neurochemcial phenotype and membrane properties. A, Representative current-clamp recordings of two Hcrt/Ox neurons responding to +40 pA (gray) and −40 pA (black) current injections, identifying H-type (left) and D-type (right) signatures. In all panels, green denotes H-type while orange denotes D-type. B, Latency to first spike after a 1 s hyperpolarizing step of −120 pA, threshold for H-type set at 100 ms (n = 16 cells; 6 H-type, 10 D-type). C, Schematic of a representative LHA slice with the approximate location of recorded H-type and D-type Hcrt/Ox neurons. D, Unsupervised hierarchical clustering heatmap of 16 Hcrt/Ox neurons measured for the expression of 48 genes by qPCR, along with their electrical signature. Asterisks indicate the two individual cells corresponding to traces in A. E, Scatterplot showing expression of all 48 genes measured in both our single-cell Hcrt/Ox qPCR dataset (x-axis) and patch harvested Hcrt/Ox qPCR dataset (y-axis). The two datasets show strong correlation (Spearman's ρ = 0.89; p = 2.2 × 10⁻¹⁶).

Similar articles

Cited by

References

    1. Abrahamson EE, Moore RY (2001) The posterior hypothalamic area: chemoarchitecture and afferent connections. Brain Res 889:1–22. - PubMed
    1. Adamantidis AR, Zhang F, Aravanis AM, Deisseroth K, de Lecea L (2007) Neural substrates of awakening probed with optogenetic control of hypocretin neurons. Nature 450:420–424. 10.1038/nature06310 - DOI - PMC - PubMed
    1. Agresti A (1992) A survey of exact inference for contingency tables. Stat Sci 7:131–153. 10.1214/ss/1177011454 - DOI
    1. Alexandre C, Andermann ML, Scammell TE (2013) Control of arousal by the orexin neurons. Curr Opin Neurobiol 23:752–759. 10.1016/j.conb.2013.04.008 - DOI - PMC - PubMed
    1. Apergis-Schoute J, Iordanidou P, Faure C, Jego S, Schöne C, Aitta-Aho T, Adamantidis A, Burdakov D (2015) Optogenetic Evidence for Inhibitory Signaling from Orexin to MCH Neurons via Local Microcircuits. J Neurosci 35:5435–5441. 10.1523/JNEUROSCI.5269-14.2015 - DOI - PMC - PubMed

Publication types

MeSH terms

LinkOut - more resources