

T cells responding to Trypanosoma cruzi detected by membrane TNF-α and CD154 in chagasic patients
- PMID: 28967229
- PMCID: PMC5818450
- DOI: 10.1002/iid3.197
T cells responding to Trypanosoma cruzi detected by membrane TNF-α and CD154 in chagasic patients
Abstract
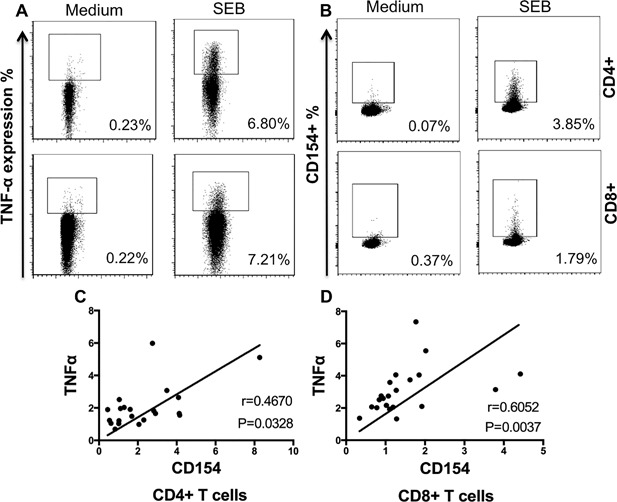
Introduction: Chagas disease is a parasitic infection whose pathogenesis is related to parasite persistence and a dysfunctional cellular immune response. Variability in cytokine secretion among chronic Trypanosoma cruzi-infected patients might preclude the identification of the pool of antigen specific T cells. The goal of this study was to determine the fraction of T cells responding to T. cruzi antigen measured by the expression of membrane TNF-α and CD154.
Methods: A total of 21 chagasic patients, 11 healthy and 5 non-chagasic cardiomyopathy controls were analyzed. PBMCs were short-term cultured in the presence of anti-CD28, anti-CD49d, anti-TNF-α, and TACE (TNF-α converting enzyme) inhibitor either under T. cruzi-lysate or polyclonal stimuli. Cells were stained with anti-CD3, anti-CD4, anti-CD8, and anti-CD154, and analyzed with flow cytometry.
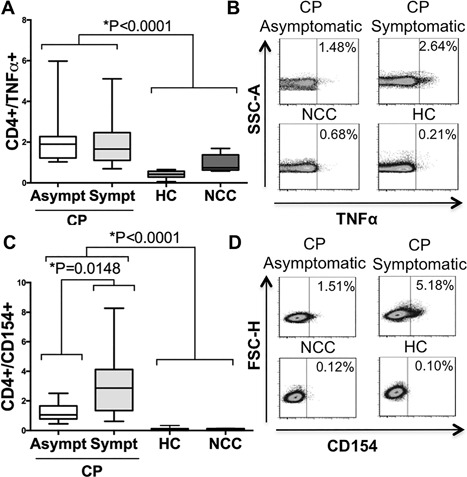
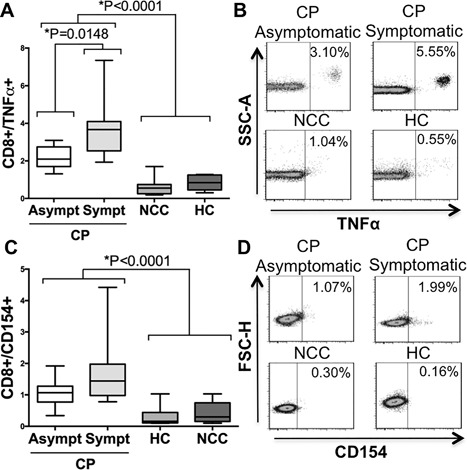
Results: CD4+ and CD8+ T cells in chagasic patients displayed higher percentages of membrane-bound TNF-α+ and CD154+ compared with controls after T. cruzi-antigen stimulation. Both markers displayed a positive correlation in the T cell subpopulations analyzed. Symptomatic chagasic patients were differentiated from asymptomatic patients based on the expression of CD154 and membrane TNF-α in TCD4+ and TCD8+ compartments, respectively.
Conclusions: These results show that both markers could be useful for assessing the pool of antigen-specific T cells in chronic chagasic patients.
Keywords: CD4+ T lymphocytes; CD8+ T lymphocytes; T lymphocyte; chagas disease; flow cytometry.
© 2017 The Authors. Immunity, Inflammation and Disease Published by John Wiley & Sons Ltd.
Figures
Similar articles
-
Trypanosoma cruzi-specific CD8+ T cells and other immunological hallmarks in chronic Chagas cardiomyopathy: Two decades of research.Front Cell Infect Microbiol. 2023 Jan 4;12:1075717. doi: 10.3389/fcimb.2022.1075717. eCollection 2022. Front Cell Infect Microbiol. 2023. PMID: 36683674 Free PMC article. Review.
-
Impact of benznidazole treatment on the functional response of Trypanosoma cruzi antigen-specific CD4+CD8+ T cells in chronic Chagas disease patients.PLoS Negl Trop Dis. 2018 May 11;12(5):e0006480. doi: 10.1371/journal.pntd.0006480. eCollection 2018 May. PLoS Negl Trop Dis. 2018. PMID: 29750791 Free PMC article.
-
Immunoregulatory mechanisms in Chagas disease: modulation of apoptosis in T-cell mediated immune responses.BMC Infect Dis. 2016 Apr 30;16:191. doi: 10.1186/s12879-016-1523-1. BMC Infect Dis. 2016. PMID: 27138039 Free PMC article.
-
TNF-α is involved in the abnormal thymocyte migration during experimental Trypanosoma cruzi infection and favors the export of immature cells.PLoS One. 2012;7(3):e34360. doi: 10.1371/journal.pone.0034360. Epub 2012 Mar 26. PLoS One. 2012. PMID: 22461911 Free PMC article.
-
Generation, specificity, and function of CD8+ T cells in Trypanosoma cruzi infection.Immunol Rev. 2004 Oct;201:304-17. doi: 10.1111/j.0105-2896.2004.00183.x. Immunol Rev. 2004. PMID: 15361249 Review.
Cited by
-
The Unsolved Jigsaw Puzzle of the Immune Response in Chagas Disease.Front Immunol. 2018 Aug 24;9:1929. doi: 10.3389/fimmu.2018.01929. eCollection 2018. Front Immunol. 2018. PMID: 30197647 Free PMC article. Review.
-
Risk Factors for Progression to Chronic Chagas Cardiomyopathy: A Systematic Review and Meta-Analysis.Am J Trop Med Hyg. 2023 Feb 27;108(4):791-800. doi: 10.4269/ajtmh.22-0630. Print 2023 Apr 5. Am J Trop Med Hyg. 2023. PMID: 36848894 Free PMC article.
-
Trypanosoma cruzi-specific CD8+ T cells and other immunological hallmarks in chronic Chagas cardiomyopathy: Two decades of research.Front Cell Infect Microbiol. 2023 Jan 4;12:1075717. doi: 10.3389/fcimb.2022.1075717. eCollection 2022. Front Cell Infect Microbiol. 2023. PMID: 36683674 Free PMC article. Review.
-
Genome-wide association study for Chagas Cardiomyopathy identify a new risk locus on chromosome 18 associated with an immune-related protein and transcriptional signature.PLoS Negl Trop Dis. 2022 Oct 10;16(10):e0010725. doi: 10.1371/journal.pntd.0010725. eCollection 2022 Oct. PLoS Negl Trop Dis. 2022. PMID: 36215317 Free PMC article.
-
Percentages of CD4+CD8+ Double-positive T Lymphocytes in the Peripheral Blood of Adults from a Blood Bank in Bogotá, Colombia.Turk J Haematol. 2020 Feb 20;37(1):36-41. doi: 10.4274/tjh.galenos.2019.2019.0256. Epub 2019 Oct 15. Turk J Haematol. 2020. PMID: 31612695 Free PMC article.
References
-
- Valitutti, S., S. Muller, M. Cella, E. Padovan, and A. Lanzavecchia. 1995. Serial triggering of many T‐cell receptors by a few peptide‐MHC complexes. Nature 375:148–151. - PubMed
-
- Moskophidis, D. , Battegay M., van den Broek M., Laine E., Hoffmann‐Rohrer U., and Zinkernagel R. M.. 1995. Role of virus and host variables in virus persistence or immunopathological disease caused by a non‐cytolytic virus. J. Gen. Virol. 76(Pt 2):381–391. - PubMed
-
- Li Pira, G. , Kern F., Gratama J., Roederer M., and Manca F.. 2007. Measurement of antigen specific immune responses: 2006 update. Cytometry B Clin. Cytom. 72:77–85. - PubMed
Publication types
MeSH terms
Substances
LinkOut - more resources
Full Text Sources
Other Literature Sources
Medical
Research Materials
Miscellaneous
