. 2017 Oct 27;35(45):6112-6121.
doi: 10.1016/j.vaccine.2017.09.058. Epub 2017 Sep 28.

Evaluation of the innate immune responses to influenza and live-attenuated influenza vaccine infection in primary differentiated human nasal epithelial cells

Affiliations

Evaluation of the innate immune responses to influenza and live-attenuated influenza vaccine infection in primary differentiated human nasal epithelial cells

Adriana Forero et al. Vaccine. .

Abstract

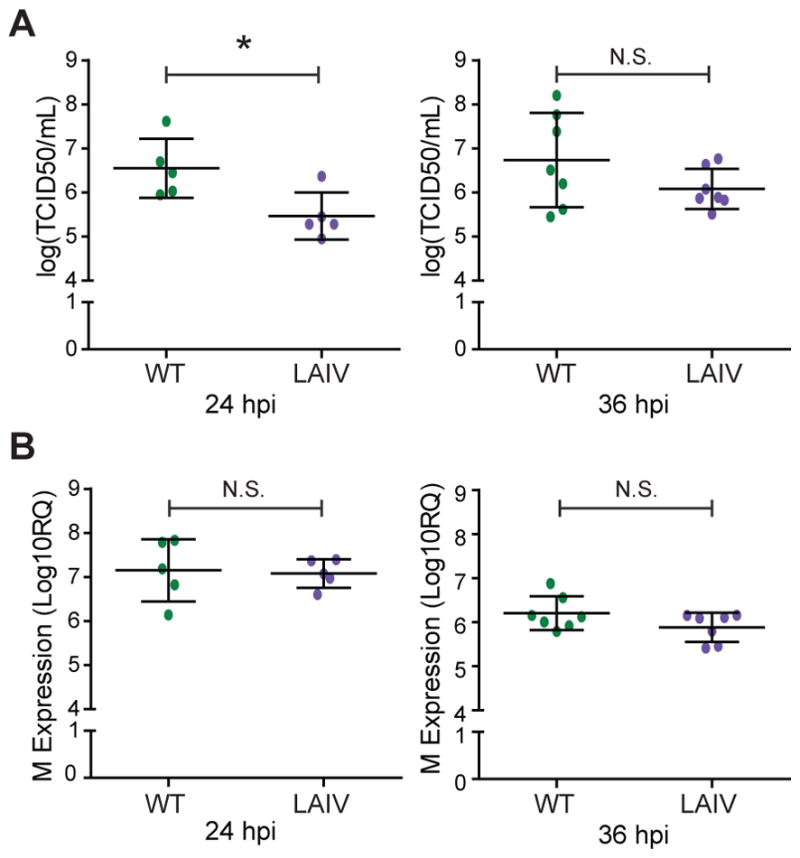
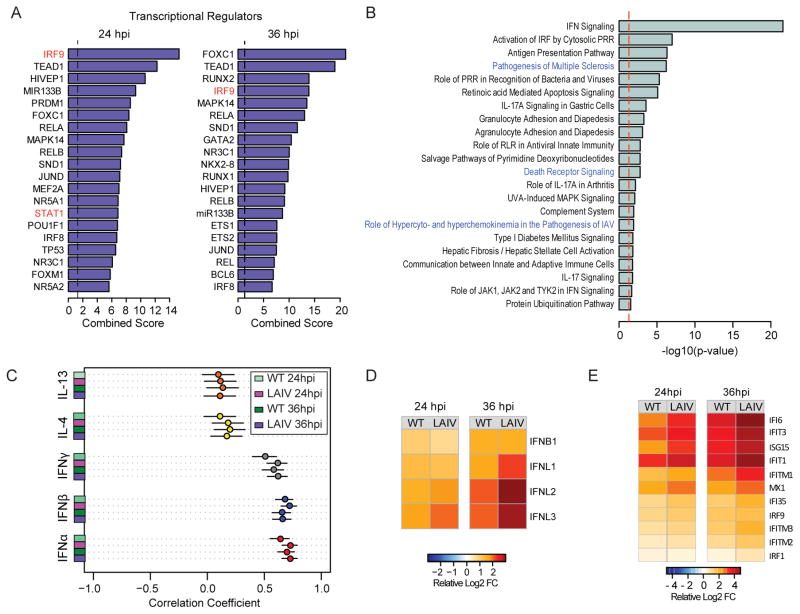
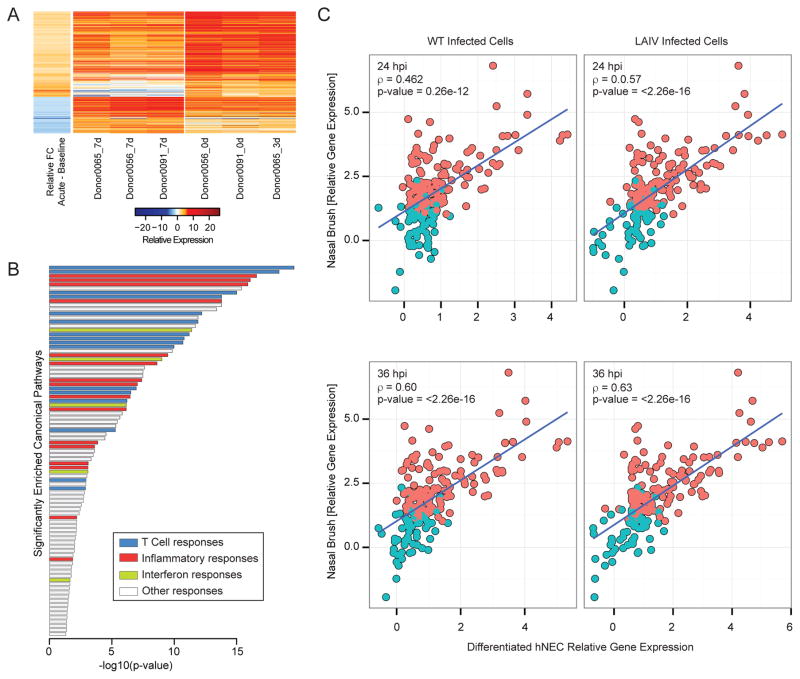
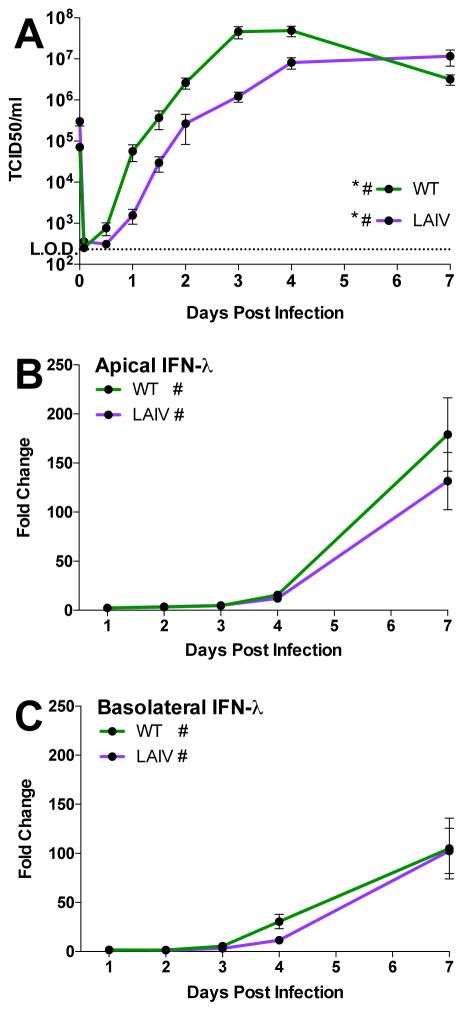
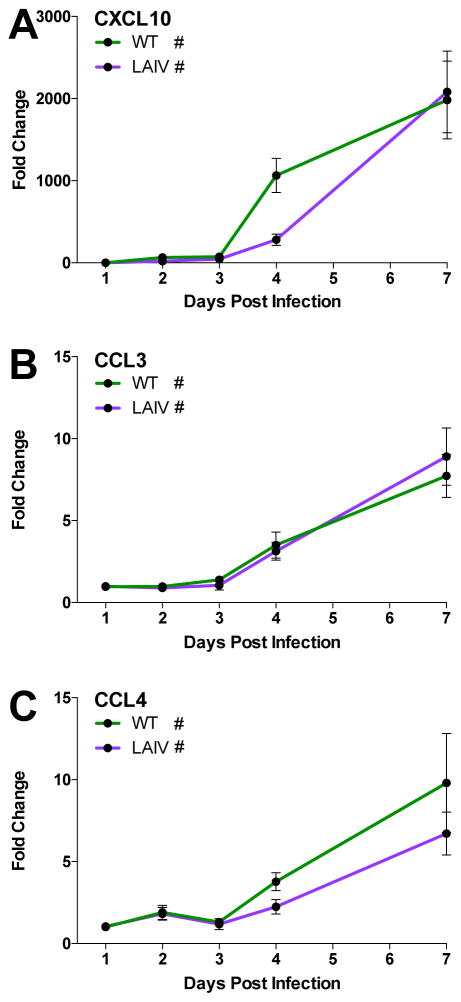
The host innate immune response to influenza virus is a key determinant of pathogenic outcomes and long-term protective immune responses against subsequent exposures. Here, we present a direct contrast of the host responses in primary differentiated human nasal epithelial cell (hNEC) cultures following infection with either a seasonal H3N2 influenza virus (WT) or the antigenically-matched live-attenuated vaccine (LAIV) strain. Comparison of the transcriptional profiles obtained 24 and 36h post-infection showed that the magnitude of gene expression was greater in LAIV infected relative to that observed in WT infected hNEC cultures. Functional enrichment analysis revealed that the antiviral and inflammatory responses were largely driven by type III IFN induction in both WT and LAIV infected cells. However, the enrichment of biological pathways involved in the recruitment of mononuclear leukocytes, antigen-presenting cells, and T lymphocytes was uniquely observed in LAIV infected cells. These observations were reflective of the host innate immune responses observed in individuals acutely infected with influenza viruses. These findings indicate that cell-intrinsic type III IFN-mediated innate immune responses in the nasal epithelium are not only crucial for viral clearance and attenuation, but may also play an important role in the induction of protective immune responses with live-attenuated vaccines.

Keywords: Epithelial cells; Host response; Inflammation; Influenza virus; Interferon; Live-attenuated vaccine.


Figures

Figure 1
Figure 1. Gene expression and replication of WT H3N2 and antigenically-matched live-attenuated viruses in differentiated hNEC cultures
Differentiated human nasal epithelial cell cultures were infected at a multiplicity of infection (MOI) of 1 and incubated at 32°C. (A) Measurement of infectious virus particle production in apical supernatant of infected hNEC cells. (B) Expression of cell-associated viral M2 mRNA expression was determined by quantitative RT-PCR. * indicates p>0.05. Three to four infected wells were averaged for the data points shown and each data point represents one donor with 5–7 donors were used for each time point.
Figure 2
Figure 2. Global analysis of the transcriptional responses to WT and antigenically-matched LAIV in differentiated hNEC cultures
(A and B) Venn Diagrams of overlap in the response to infection with WT and LAIV in hNEC cultures. Number of differentially expressed (DE) genes following virus infection relative to time-matched mocks. Differential gene expression cutoff was set to fold change >1.5 and a q-value < 0.05 calculated using a moderated t-test with subsequent Benjamini-Hochberg correction. Multidimensional scaling (MDS) representation of the similarities in the differential transcriptional profiles elicited by viral infection at (C) 24 hpi (D) and 36 hpi. Each donor is represented by a distinct shape. Biological replicates are represented as single points and unique color distinguishes infectious conditions. The quality of the representation is provided by the Kruskal Stress value, with the low percentage of Kruskal stress suggesting a faithful 2D representation of global transcriptional differences between viral strains. (E) Average ratio of gene expression between LAIV and WT infected cells. Heatmap represents the log2 fold expression changes of 253 genes displaying a 1.2 fold-change of expression in LAIV- over WT-infected cells relative to donor-matched, mock-infected cells.
Figure 3
Figure 3. The host response to influenza is regulated by type I and III interferon responses in hNEC cultures
(A) Prediction of upstream regulatory transcription factors that control the enhanced LAIV response following infection in hNEC cultures. ChEA was utilized to predict transcription factors previously found to be associated with the regulation of gene expression of the 253 genes showing enhanced differential expression following LAIV infection. Bar graphs represent combined enrichment scores for each factor. (B) Gene set enrichment of canonical pathways of the 253 genes showing enhanced differential expression following LAIV infection derived using IPA. Bar graph represents pathways with significant enrichment scores (enrichment score > 1.3) Bar length represents the enrichment scores, which are based on the −log10 p-value as determined by Fisher’s exact test. (C) Meta-analysis of hNEC transcriptional responses following cytokine stimulation. Responses to WT and LAIV infection were correlated to those observed following treatment with type I IFN (IFNα and IFNβ; red and blue circles, respectively), type II IFN (IFNγ; grey) and Th2-polarizing cytokines, IL-4 and IL-13 (yellow and orange circles, respectively). Each bubble represents the Spearman correlation coefficient, and the confidence interval is represented by the black bar. (D) Relative RNA expression of type I and type III IFN genes. Heatmaps represent the average ratio of differential expression (log2 fold change) relative to donor-matched, mock-infected samples. (E) Relative RNA expression of interferon responsive genes. Heatmap represent the average ratio of differential expression (log2 fold change) relative to donor-matched, mock-infected samples.
Figure 4
Figure 4. LAIV infection is associated with enhanced cytokine and chemokine induction in hNEC cultures
(A) Gene set enrichment of biological functions pertaining to immune cell recruitment and regulation derived from IPA. Bubble plot representation of significant enrichment scores (activation z-score >2) in at least one timepoint in cells infected with LAIV. Significant enrichment is denoted by red color. Activation z-scores < 2 are denoted in white and grey. Crosses signify a lack of enrichment. Bubble diameter represents the −log10 p-value as determined by Fisher’s exact test. (B) Measurement of CXCL10 production in the basolateral medium in infected hNEC cells at 36 hpi. Graphs represent the log2 fold change in cytokine expression relative to donor-matched, mock-infected cells (left). Ratio of CXCL10 expression in LAIV-infected cells relative to WT- infected cells (right). Values greater than zero denote increased cytokine production in LAIV-infected cells relative to WT-infected cells. (C) Differential expression of cytokine and chemokine genes. Heatmap represent the average ratio of differential expression (log2 fold change) relative to donor-matched, mock-infected samples.
Figure 5
Figure 5. Host transcriptional profiling in nasal swabs of patients infected with H3N2 influenza virus
Gene expression profile in nasal washes derived from H3N2-infected donors. (A) Heatmap represents the log2-transformed gene expression at baseline (7 days post-visit) or during acute infection (time of visit or 3 days post initial visit, as indicated) across three donors (2 male and 1 female). The average ratio of differential expression (donor-matched acute infection samples vs. baseline samples) is presented in the first column. Columns 2–7 represent the log2-transformed gene expression at baseline (columns 2–4) or at time of initial clinical visit (columns 5–7). (B) Gene set enrichment of canonical pathways of the 577 genes differentially expressed early during acute infection relative to baseline using IPA. Bar graph represents pathways with significant enrichment scores (enrichment score > 1.3). Bar length represents the enrichment scores, which are based on the −log10 p-value as determined by Fisher’s exact test. Bar color determines the distinct biological functions that the enriched canonical pathways are predicted to affect. (C) Correlation of hNEC and nasal epithelium-derived transcriptional responses following IAV infection. Responses to WT and LAIV infection in hNEC cultures (x-axis) were correlated to those observed during acute infection with H3 IAV (y-axis). Each bubble in the graph represents a DE gene in hNEC cultures. Pink color represents genes that were determined to be DE in the nasal brush, while blue color represents genes that did not pass statistical cut-off for differential expression in the nasal brush. The Spearman correlation coefficient, r, is depicted for each contrast.
Figure 6
Figure 6. LAIV- and WT-infected hNEC cultures produce similar amounts of type III IFNs despite different levels of infectious virus production
Apical and basolateral media from hNEC cultures infected with a low MOI of WT or LAIV were harvested and assessed for viral replication (A) or interferon lambda production (B, C). During exponential replication (until 4 days post infection), LAIV replication is significantly reduced relative to WT (p<0.0001, MANOVA). (B) Apical and (C) basolateral type III IFN secretion is significantly elevated relative to donor-matched mock-infected cells but is similar between the two viral infections. Cultures from 6 donors (3 males and 3 females) were used with n=3–4 wells per timepoint per culture. Data represented as fold change over mock. (* = p≤0.05 for WT to LAIV comparison, # = p<0.05 compared to mock-infected samples, MANOVA)
Figure 7
Figure 7. Chemokine secretion into the basolateral media of WT- and LAIV-infected hNEC cultures
(A) CXCL10, (B) CCL3, and (C) CCL4 secretion is significantly greater than in donor-matched mock infected cells for both WT and LAIV infections, however there is no significant difference in the fold change of production induced between the two viruses. Basolateral supernatants from hNEC cultures infected with the indicated viruses were harvested at the indicated times and assessed for chemokine production using the MSD chemokine analysis platform. Cultures from 6 donors (3 males and 3 females) were used with n=3–4 wells per timepoint per culture. Data represented as fold change over mock. (* = p≤0.05 for WT to LAIV comparison, # = p<0.05 compared to mock-infected samples, MANOVA)

Similar articles

Cited by

References

    1. Anders S, Pyl PT, Huber W. HTSeq--a Python framework to work with high-throughput sequencing data. Bioinformatics. 2015;31:166–169. - PMC - PubMed
    1. Ank N, Iversen MB, Bartholdy C, Staeheli P, Hartmann R, Jensen UB, Dagnaes-Hansen F, Thomsen AR, Chen Z, Haugen H, Klucher K, Paludan SR. An important role for type III interferon (IFN-lambda/IL-28) in TLR-induced antiviral activity. J Immunol. 2008;180:2474–2485. - PubMed
    1. Benjamini Y, Hochberg Y. Controlling the False Discovery Rate - a Practical and Powerful Approach to Multiple Testing. J Roy Stat Soc B Met. 1995;57:289–300.
    1. Chan W, Zhou H, Kemble G, Jin H. The cold adapted and temperature sensitive influenza A/Ann Arbor/6/60 virus, the master donor virus for live attenuated influenza vaccines, has multiple defects in replication at the restrictive temperature. Virology. 2008;380:304–311. - PubMed
    1. Chen GL, Lamirande EW, Jin H, Kemble G, Subbarao K. Safety, immunogencity, and efficacy of a cold-adapted A/Ann Arbor/6/60 (H2N2) vaccine in mice and ferrets. Virology. 2010;398:109–114. - PMC - PubMed

Publication types