. 2017 Nov;35(11):1077-1086.
doi: 10.1038/nbt.3981. Epub 2017 Oct 2.

Assessment of variation in microbial community amplicon sequencing by the Microbiome Quality Control (MBQC) project consortium

Affiliations

Assessment of variation in microbial community amplicon sequencing by the Microbiome Quality Control (MBQC) project consortium

Rashmi Sinha et al. Nat Biotechnol. 2017 Nov.

Abstract

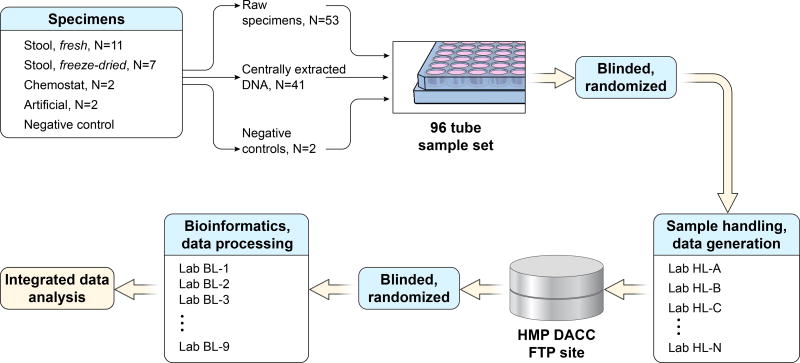
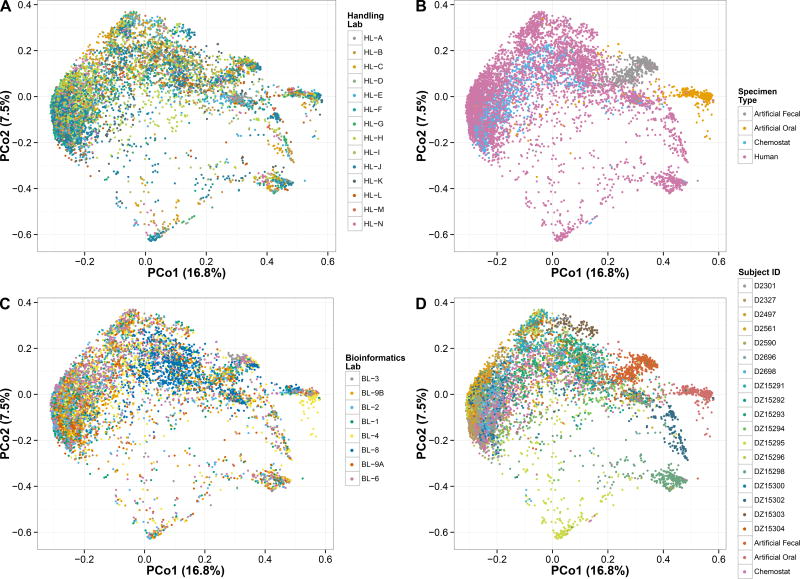
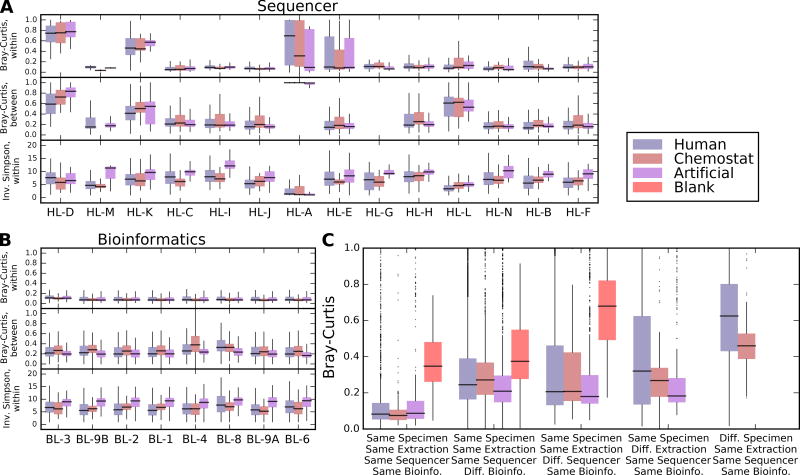
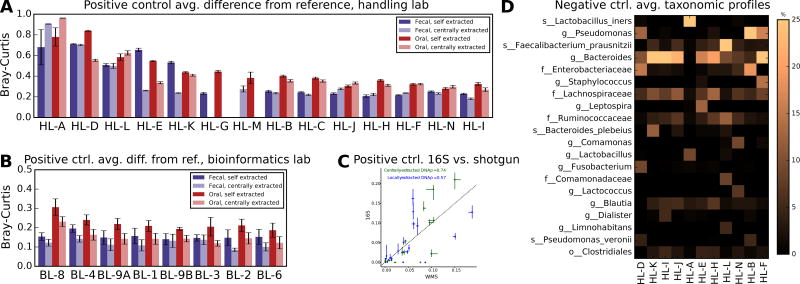
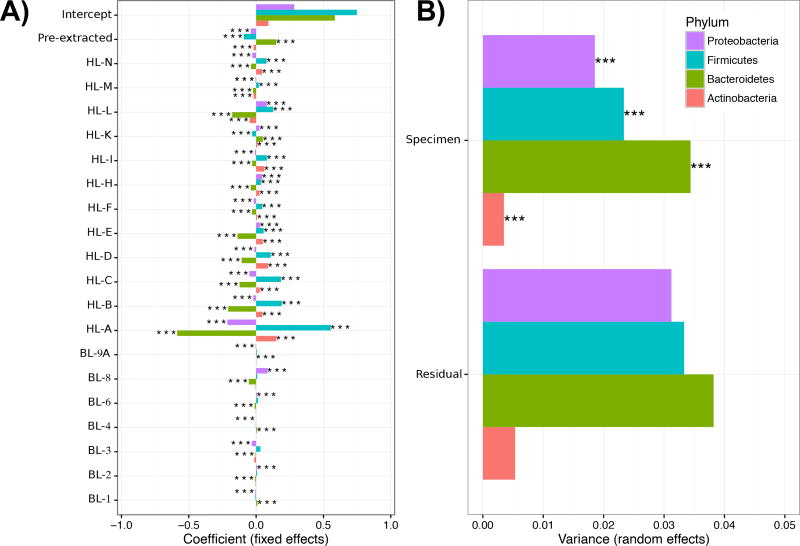
In order for human microbiome studies to translate into actionable outcomes for health, meta-analysis of reproducible data from population-scale cohorts is needed. Achieving sufficient reproducibility in microbiome research has proven challenging. We report a baseline investigation of variability in taxonomic profiling for the Microbiome Quality Control (MBQC) project baseline study (MBQC-base). Blinded specimen sets from human stool, chemostats, and artificial microbial communities were sequenced by 15 laboratories and analyzed using nine bioinformatics protocols. Variability depended most on biospecimen type and origin, followed by DNA extraction, sample handling environment, and bioinformatics. Analysis of artificial community specimens revealed differences in extraction efficiency and bioinformatic classification. These results may guide researchers in experimental design choices for gut microbiome studies.


Figures

Figure 1
Figure 1. Microbiome Quality Control Project study design
MBQC laboratories were provided with at least one blinded set of 96 aliquots including extracted DNA, raw fecal (frozen or freeze-dried) aliquots, and positive and negative control aliquots (22 specimens with replication). Each lab extracted DNA from the raw fecal aliquots, which was then amplified and sequenced DNA samples in tandem with pre-extracted aliquots using Illumina platforms targeting the 16S rRNA gene. Sequencing datasets were re-blinded and distributed for bioinformatic analysis, resulting in an integrated table of operational taxonomic units (OTUs) that were called against the Greengenes 13.5 database and made publicly available through the Human Microbiome Project Data Analysis and Coordinating Center at http://mbqc.org/ and PRJNA260846).
Figure 2
Figure 2. Beta-diversity of MBQC-base microbial community analyses
Ordination of 16,554 samples corresponding to 2,237 replicated sequencing results on 22 originating physical specimens (human-derived, chemostat, and oral and gut artificial communities) using multidimensional scaling of Bray-Curtis dissimilarities. Labels indicate stratification by A) sample handling laboratory, B) specimen type, C) bioinformatics laboratory, or D) subject. Major contributors to between-sample diversity thus include biological origin, handling protocol differences, and bioinformatics protocol variables (Supplementary Fig. 1).
Figure 3
Figure 3. Individual and aggregate effects of sample handling and bioinformatics labs on microbial profiles
A) Distributions of within- and between-sample alpha and beta diversities, respectively, stratified by sample type (n=2,033 for artificial communities, n=11,991 for human-derived samples, and n=1,725 for chemostat samples) and by handling or B) bioinformatics lab. Raw data, including sample sizes, are included in Supplementary Dataset 7. Bray-Curtis dissimilarities within labs are computed only between technical replicates handled and extracted identically; between lab distributions compare only replicates from the same originating specimen as processed by one lab to all others. Outlier values outside 1.5 times the interquartile range are omitted for clarity. Within-lab comparisons thus assess the consistency of each lab between replicates; between-lab comparisons assess how (dis)similar each lab’s results are to all others. C) Effect size distributions of technical variation (between identically handled replicate samples), differences only due to bioinformatics lab, sequencing lab, extraction (local vs. central), and between different biological specimens. In general, biological differences were largest, followed by extraction (particularly for heterogeneous human-derived samples), sequencing protocol, and computational protocol effects were smallest. Omnibus tests for differences among specimen type, handling laboratory, and bioinformatics laboratory are all significant at Kruskal-Wallis p<0.05; pairwise Wilcoxon tests for the effects of most individual handling laboratories are significant, while most bioinformatics laboratories are not (Supplementary Table 6).
Figure 4
Figure 4. Detection of abundant taxa in positive and negative control samples is affected by sample handling
Average distance (genus-level Bray-Curtis beta-diversity) from two reference positive control communities (20 fecal and 22 oral isolates, respectively), stratified between centrally and locally extracted samples and by A) sample handling laboratory (averaging each over all bioinformatics) and by B) bioinformatics lab (averaging over each over all sample handlers). Error bars show standard error; no data were provided by combinations that are missing bars. Raw data, including sample sizes, are included in Supplementary Dataset 8. Sample handling had a greater overall effect on distance from truth, and showed greater variation, than did bioinformatics; some effects were specific only to locally or centrally extracted samples and appeared to be driven by contamination of only these respective sample subsets (see Supplementary Fig. 9–10). C) Spearman correlation between whole metagenome shotgun (WMS) and 16S amplicon sequence data on centrally and locally extracted gut-derived artificial communities. Points indicate each of 17 species that were jointly identifiable in both data types, due to uniquely identifiable species-level agreement between the Greengenes and MetaPhlAn taxonomies (see Methods, Supplementary Fig. 11). Error bars represent interquartile ranges (IQRs) across 43 and 36 artificial community 16S amplicon samples for gut centrally and locally extracted DNA samples, respectively, intersecting at medians; three WMS samples were used in each comparison (six total). Dashed line indicates the diagonal. D) Mean taxa observed in negative control samples containing only Tris-HCl buffer (see Methods). Most apparent contamination was handling lab-specific (see Supplementary Fig. 9–10), thus averages are per handling lab over all bioinformatics.
Figure 5
Figure 5. Variation in community profiling analyzed using a multivariate model of experimental and bioinformatic protocol variables
Significant A) fixed and B) random effects on phylum-level variation in taxonomic abundance, derived from a simplified model of handling and bioinformatics laboratory variables for which there were sufficient data available for evaluation (see Supplementary Table 8, Supplementary Fig. 15 for full model). Variability in taxonomic profiling is dominated by systematic differences between handling laboratory protocols in addition to choice of DNA extraction kit, while bioinformatics protocol choices were much smaller at the phylum level (see Results). Bar length indicates the magnitude of A) average differences in abundance contributed by each lab or B) variation contributed by different specimens or by noise, while stars indicate significance at p<0.001. All parameters were tested using a likelihood ratio test with Benjamini-Hochberg-Yekutieli FDR correction across all outcomes.

References

    1. Structure, function and diversity of the healthy human microbiome. Nature. 2012;486:207–214. - PMC - PubMed
    1. Qin J, et al. A human gut microbial gene catalogue established by metagenomic sequencing. Nature. 2010;464:59–65. - PMC - PubMed
    1. Yatsunenko T, et al. Human gut microbiome viewed across age and geography. Nature. 2012;486:222–227. - PMC - PubMed
    1. Integrative H.M.P.R.N.C. The Integrative Human Microbiome Project: dynamic analysis of microbiome-host omics profiles during periods of human health and disease. Cell Host Microbe. 2014;16:276–289. - PMC - PubMed
    1. Vatanen T, et al. Variation in Microbiome LPS Immunogenicity Contributes to Autoimmunity in Humans. Cell. 2016;165:842–853. - PMC - PubMed

MeSH terms