. 2017 Nov;14(11):1063-1071.
doi: 10.1038/nmeth.4458. Epub 2017 Oct 2.

Critical Assessment of Metagenome Interpretation-a benchmark of metagenomics software

Alexander Sczyrba  1   2 Peter Hofmann  3   4   5 Peter Belmann  1   2   4   5 David Koslicki  6 Stefan Janssen  4   7   8 Johannes Dröge  3   4   5 Ivan Gregor  3   4   5 Stephan Majda  3 Jessika Fiedler  3   4 Eik Dahms  3   4   5 Andreas Bremges  1   2   4   5   9 Adrian Fritz  4   5 Ruben Garrido-Oter  3   4   5   10   11 Tue Sparholt Jørgensen  12   13   14 Nicole Shapiro  15 Philip D Blood  16 Alexey Gurevich  17 Yang Bai  10 Dmitrij Turaev  18 Matthew Z DeMaere  19 Rayan Chikhi  20   21 Niranjan Nagarajan  22 Christopher Quince  23 Fernando Meyer  4   5 Monika Balvočiūtė  24 Lars Hestbjerg Hansen  12 Søren J Sørensen  13 Burton K H Chia  22 Bertrand Denis  22 Jeff L Froula  15 Zhong Wang  15 Robert Egan  15 Dongwan Don Kang  15 Jeffrey J Cook  25 Charles Deltel  26   27 Michael Beckstette  28 Claire Lemaitre  26   27 Pierre Peterlongo  26   27 Guillaume Rizk  27   29 Dominique Lavenier  21   27 Yu-Wei Wu  30   31 Steven W Singer  30   32 Chirag Jain  33 Marc Strous  34 Heiner Klingenberg  35 Peter Meinicke  35 Michael D Barton  15 Thomas Lingner  36 Hsin-Hung Lin  37 Yu-Chieh Liao  37 Genivaldo Gueiros Z Silva  38 Daniel A Cuevas  38 Robert A Edwards  38 Surya Saha  39 Vitor C Piro  40   41 Bernhard Y Renard  40 Mihai Pop  42   43 Hans-Peter Klenk  44 Markus Göker  45 Nikos C Kyrpides  15 Tanja Woyke  15 Julia A Vorholt  46 Paul Schulze-Lefert  10   11 Edward M Rubin  15 Aaron E Darling  19 Thomas Rattei  18 Alice C McHardy  3   4   5   11
Affiliations

Critical Assessment of Metagenome Interpretation-a benchmark of metagenomics software

Alexander Sczyrba et al. Nat Methods. 2017 Nov.

Abstract

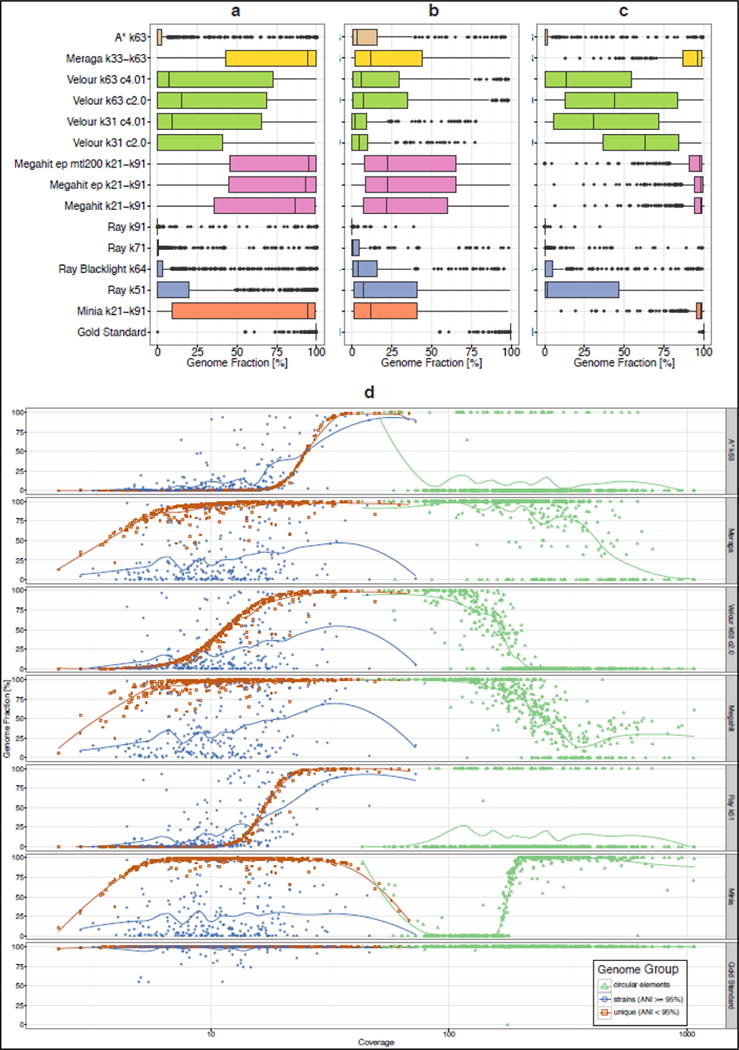
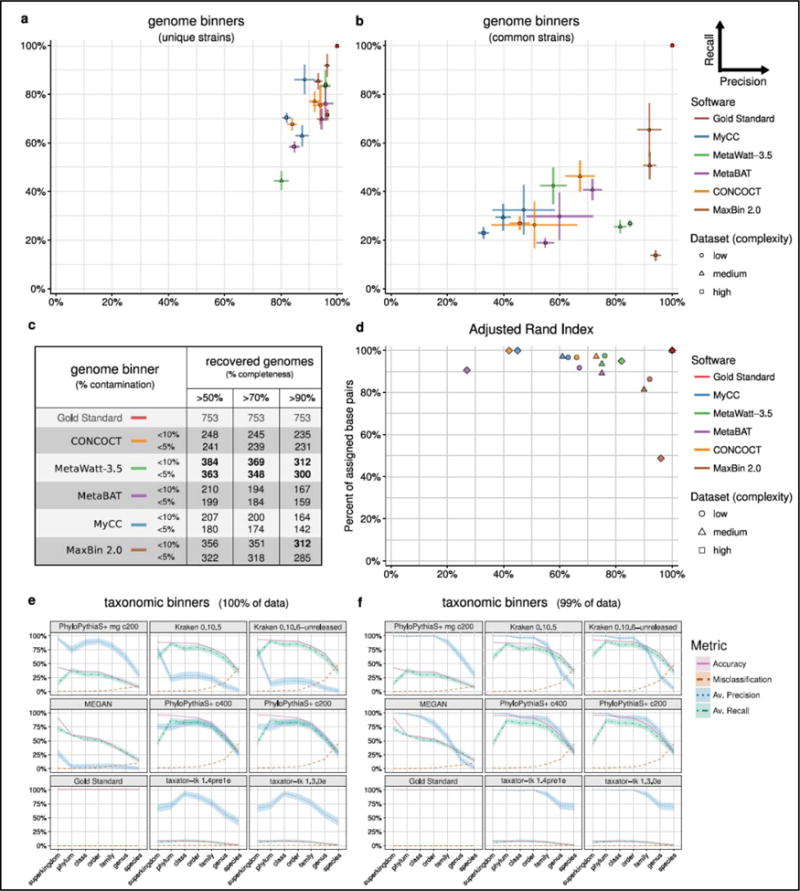
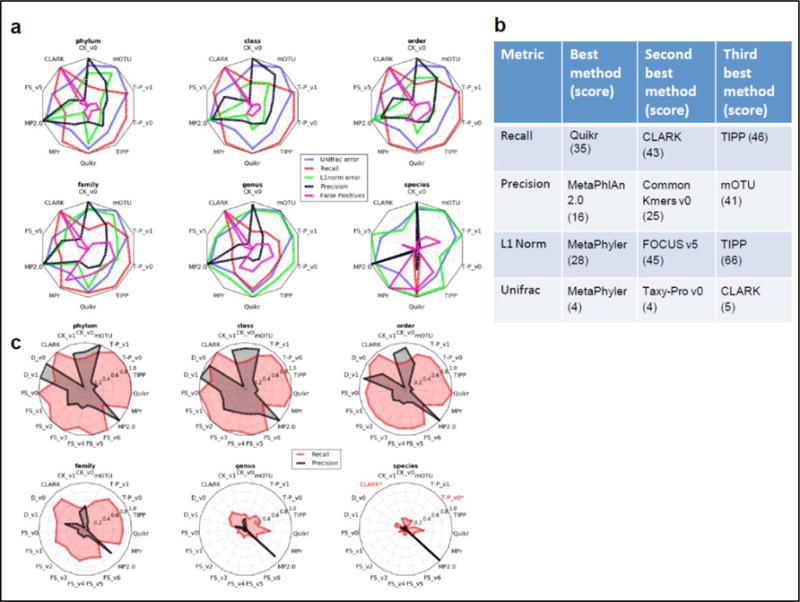
Methods for assembly, taxonomic profiling and binning are key to interpreting metagenome data, but a lack of consensus about benchmarking complicates performance assessment. The Critical Assessment of Metagenome Interpretation (CAMI) challenge has engaged the global developer community to benchmark their programs on highly complex and realistic data sets, generated from ∼700 newly sequenced microorganisms and ∼600 novel viruses and plasmids and representing common experimental setups. Assembly and genome binning programs performed well for species represented by individual genomes but were substantially affected by the presence of related strains. Taxonomic profiling and binning programs were proficient at high taxonomic ranks, with a notable performance decrease below family level. Parameter settings markedly affected performance, underscoring their importance for program reproducibility. The CAMI results highlight current challenges but also provide a roadmap for software selection to answer specific research questions.


Figures

Figure 1
Figure 1
Boxplots representing the fraction of reference genomes assembled by each assembler for the high complexity data set. (a): all genomes, (b): genomes with ANI >=95%, (c): genomes with ANI < 95%. Coloring indicates the results from the same assembler incorporated in different pipelines or with other parameter settings. (d): genome recovery fraction versus genome sequencing depth (coverage) for the high complexity data set. Data were classified as unique genomes (ANI < 95%, brown color), genomes with related strains present (ANI >= 95%, blue color) and high copy circular elements (green color). The gold standard includes all genomic regions covered by at least one read in the metagenome dataset, therefore the genome fraction for low abundance genomes can be less than 100%.
Figure 2
Figure 2
Average purity (x-axis) and completeness (y-axis) and their standard errors (bars) for genomes reconstructed by genome binners; for genomes of unique strains with equal to or less than 95% ANI to others (a) and common strains with more than 90% ANI to each other (b). For each program and complexity dataset, the submission with the largest sum of purity and completeness is shown (Supplementary Tables 1, 10, 12). In each case, small bins adding up to 1% of the data set size were removed. (c) Number of genomes recovered with varying completeness and contamination (1-purity, Supplementary Table S17). (d) The Adjusted Rand Index (ARI, x-axis) in relation to fraction of the sample assigned (in basepairs) by the genome binners (y-axis). The ARI was calculated excluding unassigned sequences, thus reflects the assignment accuracy for the portion of the data assigned. (e,f) Taxonomic binning performance metrics across ranks for the medium complexity data set, with (e) results for the complete data set and (f) with smallest predicted bins summing up to 1% of the data set removed. Shaded areas indicate the standard error of the mean in precision (purity) and recall (completeness) across taxon bins.
Figure 3
Figure 3
(a) Relative performance of profilers for different ranks and with different error metrics (weighted Unifrac, L1 norm, recall, precision, and false positives), shown here exemplarily for the microbial portion of the first high complexity sample. Each error metric was divided by its maximal value to facilitate viewing on the same scale and relative performance comparisons. A method’s name is given in red (with two asterisks) if it returned no predictions at the corresponding taxonomic rank. (b) Best scoring profilers using different performance metrics summed over all samples and taxonomic ranks to the genus level. A lower score indicates that a method was more frequently ranked highly for a particular metric. The maximum (worst) score for the Unifrac metric is 38 = (18 + 11 + 9) profiling submissions for the low, medium and high complexity datasets respectively), while the maximum score is 190 for all other metrics (= 5 taxonomic ranks * (18 + 11 + 9) profiling submissions for the low, medium and high complexity datasets respectively). (c) Absolute recall and precision for each profiler on the microbial (filtered) portion of the low complexity data set across six taxonomic ranks. Abbreviations are FS (FOCUS), T-P (Taxy-Pro), MP2.0 (MetaPhlAn 2.0), MPr (Metaphyler), CK (Common Kmers) and D (DUDes).

References

    1. Turaev D, Rattei T. High definition for systems biology of microbial communities: metagenomics gets genome-centric and strain-resolved. Curr Opin Biotechnol. 2016;39:174–181. doi: 10.1016/j.copbio.2016.04.011. - DOI - PubMed
    1. Marx V. Microbiology: the road to strain-level identification. Nat Methods. 2016;13:401–404. doi: 10.1038/nmeth.3837. - DOI - PubMed
    1. Mavromatis K, et al. Use of simulated data sets to evaluate the fidelity of metagenomic processing methods. Nat Methods. 2007;4:495–500. doi: 10.1038/nmeth1043. - DOI - PubMed
    1. Lindgreen S, Adair KL, Gardner PP. An evaluation of the accuracy and speed of metagenome analysis tools. Sci Rep. 2016;6:19233. doi: 10.1038/srepl9233. - DOI - PMC - PubMed
    1. Sangwan N, Xia F, Gilbert JA. Recovering complete and draft population genomes from metagenome datasets. Microbiome. 2016;4:8. doi: 10.1186/s40168-016-0154-5. - DOI - PMC - PubMed