. 2017 Dec;16(12):1243-1251.
doi: 10.1038/nmat4993. Epub 2017 Oct 2.

Mechanical confinement regulates cartilage matrix formation by chondrocytes

Affiliations

Mechanical confinement regulates cartilage matrix formation by chondrocytes

Hong-Pyo Lee et al. Nat Mater. 2017 Dec.

Abstract

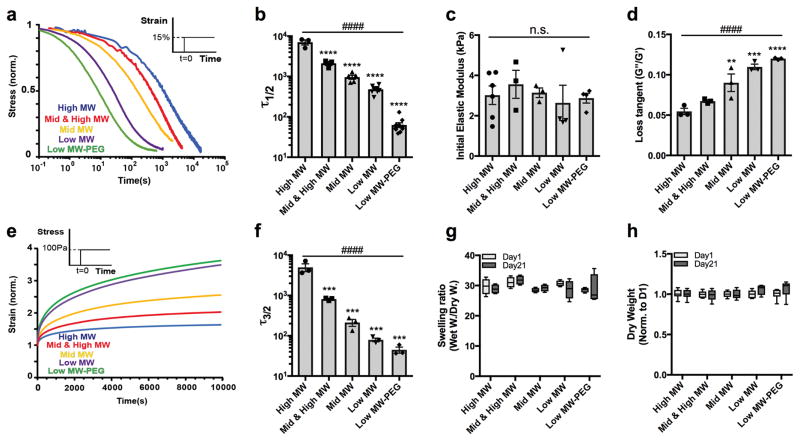
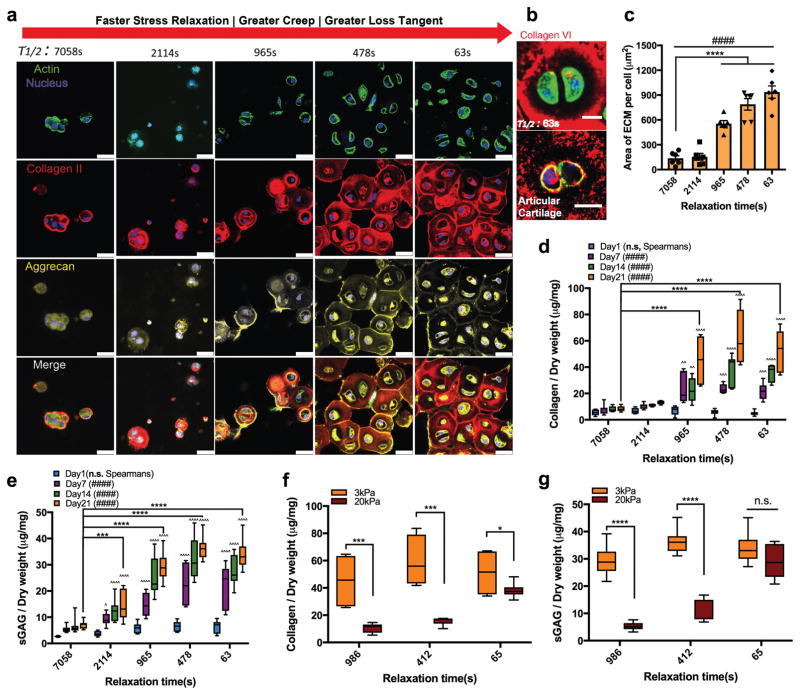
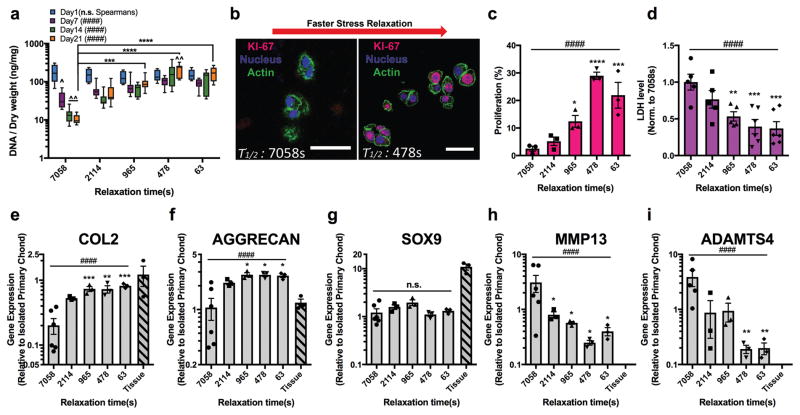
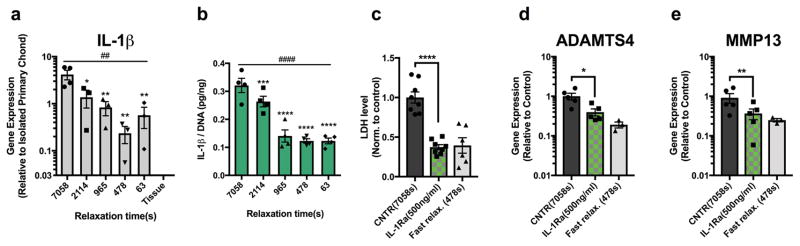
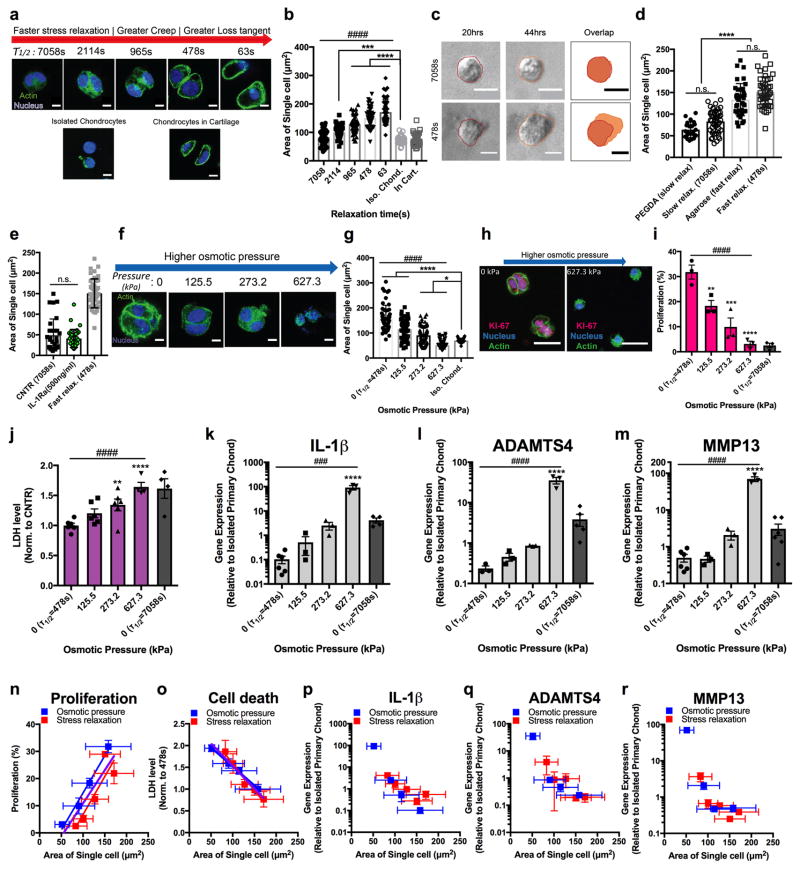
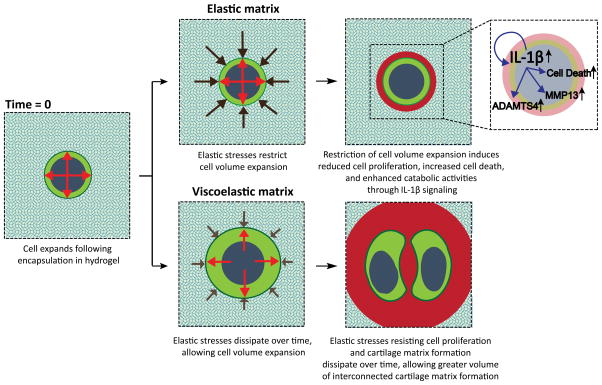
Cartilage tissue equivalents formed from hydrogels containing chondrocytes could provide a solution for replacing damaged cartilage. Previous approaches have often utilized elastic hydrogels. However, elastic stresses may restrict cartilage matrix formation and alter the chondrocyte phenotype. Here we investigated the use of viscoelastic hydrogels, in which stresses are relaxed over time and which exhibit creep, for three-dimensional (3D) culture of chondrocytes. We found that faster relaxation promoted a striking increase in the volume of interconnected cartilage matrix formed by chondrocytes. In slower relaxing gels, restriction of cell volume expansion by elastic stresses led to increased secretion of IL-1β, which in turn drove strong up-regulation of genes associated with cartilage degradation and cell death. As no cell-adhesion ligands are presented by the hydrogels, these results reveal cell sensing of cell volume confinement as an adhesion-independent mechanism of mechanotransduction in 3D culture, and highlight stress relaxation as a key design parameter for cartilage tissue engineering.


Conflict of interest statement

COMPETING FINANCIAL INTERESTS

The authors declare no competing financial interests.

Figures

Figure 1
Figure 1. Modulating the rate of stress relaxation or creep of alginate hydrogels independent of initial elastic modulus, swelling, and degradation
a, Representative stress relaxation profiles of alginate hydrogels composed of alginate of varying molecular weights, or modified with a short PEG spacer. b, Time scale of stress relaxation, τ1/2, for the different alginate hydrogels. c, Initial elastic modulus of the different alginate hydrogels. (p=0.2818 by Spearman’s rank correlation, and p > 0.7407 by one-way ANOVA test). d, Quantification of the loss tangent for the different alginate hydrogel formulations. e, Representative creep profiles of the different alginate hydrogels. f, Time scale of creep response, τ3/2, for the different alginate hydrogels. g, Swelling ratio of alginate hydrogels were measured after 1 day or 21 days in culture. (p > 0.9999 for both time points by two-way ANOVA test, and p > 0.2 for each hydrogel at different time points by Student’s t test). h, Dry mass of alginate hydrogels after 1 day or 21 days in culture normalized by the value at day 1. (p > 0.9999 for both time points by two-way ANOVA test, and p > 0.2661 for each hydrogel at different time points by student’s t test). #### located on the top indicates p < 0.0001 by Spearman’s rank correlation. **, ***, and **** indicate a statistically significant difference when compared to high MW alginate condition with p < 0.01, 0.001, and 0.0001 by one-way ANOVA test. All data are shown as mean ± s.e.m, n≥ 3 replicates per conditions, except for g and h, which show 25/50/75th percentiles as box plots and whiskers as minimum/maximum.
Figure 2
Figure 2. Faster stress relaxation in the hydrogels promotes increased cartilage matrix production and formation of a wider volume of interconnected cartilage matrix
a, Immunohistochemical stains of chondrocytes cultured in 3kPa hydrogels for 21 days. Scale bar, 25 μm. b, Immunohistochemical stains of pericellular matrix and bean-shaped chondrocytes cultured in fast relaxing gel (τ1/2 = 63s) for 21 days and in hyaline cartilage. Scale bar, 10 μm. c, Quantification of area of type II collagen per cell constructed by chondrocytes for 21 days. (n = 6 images from 3 hydrogels per each condition, #### p < 0.0001 by Spearman’s rank correlation, **** p < 0.0001 compared to the slow relaxing gel (τ1/2 = 7058s) condition by one-way ANOVA test, mean ± s.e.m.). d–e, Quantification of accumulated (d) collagen and (e) sulfated glycosaminoglycan (sGAG) produced by chondrocytes cultured for 21 days (#### p < 0.0001 by Spearman’s rank correlation; *** p < 0.001, and **** p < 0.0001 compared to slow relaxing gel (τ1/2 =7058s) condition by one-way ANOVA test). f–g, Quantification of the accumulated (f) collagen and (g) sGAG after 21 days in 3 kPa or 20 kPa alginate gels (*p < 0.05, *** p < 0.001 and **** p < 0.0001 by student’s t-test). The box plots show 25/50/75th percentiles and whiskers show minimum/maximum. Biological replicates (n = 4) are represented in dg.
Figure 3
Figure 3. Faster relaxation promotes proliferation and anabolic, or matrix forming, gene expression in chondrocytes, while slower stress relaxation induces cell death and catabolic, or matrix degrading, gene expression in chondrocytes
a, Quantification of DNA content in constructs consisting of chondrocytes cultured in 3 kPa hydrogels over 21 days (n=4 biological replicates, ^ p <0.05, and ^^ p <0.01 compared to value at Day 1 by two-way ANOVA test). The box plots show 25/50/75th percentiles and whiskers show minimum/maximum. b, Immunohistochemical stains for Ki-67 in nucleus of chondrocytes cultured for 7 days. Scale bar, 25 μm. c, Quantification of chondrocyte proliferation (n=3 biological replicates, measured in 200+ cells per replicate). d, Quantification of LDH levels after 7 days of culture, normalized by the value in the slowest relaxing gel condition (n=5 replicates per conditions). e–g, Quantification of gene expression of (e) type II collagen (COL2), (f) aggrecan (AGGRECAN), (g) the transcription factor Sox9 (SOX9), (h) a collagenase (MMP13), and (i) an aggrecanase (ADAMTS4) after 7 days of culture (n=3 replicates per conditions). Values are normalized by gene expression levels measured in isolated primary chondrocytes, and gene expression of chondrocytes in articular cartilage are indicated by the label “tissue”. *, **, ***, and **** indicate statistical significant difference when value compared to that in the slowest relaxing gel condition with p <0.05, 0.01, 0.001, and 0.0001 respectively (two-way ANOVA test in a and one-way ANOVA test in ci). ### and #### on the top in each figure indicate p <0.001 and 0.0001 respectively (Spearman’s rank correlation). Data are shown as mean ± s.e.m. in ci.
Figure 4
Figure 4. Slower stress relaxation induces secretion of IL-1β, which mediates strong up-regulation of catabolic activities of chondrocytes and cell death
a, Quantification of gene expression of IL-1β for chondrocytes after 7 days. Values are normalized by the gene expression level measured in isolated primary chondrocytes, and gene expression of chondrocytes in articular cartilage are indicated by the label “tissue”. (n≥ 3 replicates per conditions, ## p < 0.01 by Spearman’s rank correlation). b, Quantification of the amount of IL-1β secreted into the hydrogels after 7 days of culture in the indicated conditions, normalized to DNA amounts (n=4 replicates per conditions, #### p < 0.0001 by Spearman’s rank correlation). From a to b, *, **, ***, and **** indicate a statistically significant difference when compared to slowest relaxing gel condition (τ1/2=7058s) with p < 0.05, 0.01, 0.001 and 0.0001 respectively (one-way ANOVA test). c, LDH levels in media for chondrocytes cultured in the slowest relaxing gel in the presence (IL-1Ra) or absence (CNTR) of IL-1Ra, normalized by the value for the control group (n=8 replicates per conditions). LDH level in media for chondrocytes cultured in faster relaxing gels (τ1/2=478s) is shown for comparison. d–e, Relative gene expression of MMP13 and ADAMTS4 in the presence (IL-1Ra) or absence (CNTR) of IL-1Ra (n=3 replicates per conditions). Gene expression levels for chondrocytes cultured in faster relaxing gels (478s) are shown for comparison. From c to e, *, ** and **** indicate statistical significant difference when compared to control (7058s) with p < 0.05, 0.01 and 0.0001 respectively (Student’s t-test). All data are shown as mean ± s.e.m.
Figure 5
Figure 5. Spatial confinement against cell expansion in hydrogels with slow stress relaxation induces decreased proliferation and increases in IL-1β secretion, cell death and catabolic activities of cells
a, Chondrocytes after 7 days. Scale bar, 5μm. b, Chondrocyte size (n > 50, #### p < 0.0001, Spearman’s correlation, *** p < 0.001, and **** p < 0.0001, one-way ANOVA). c, Timelapse images of chondrocytes. Scale bar, 10 μm. d, Chondrocyte size in PEG and agarose hydrogels (n > 25 cells, p < 0.0001, one-way ANOVA), compared to alginate hydrogels (n.s. p > 0.09, one-way ANOVA). e, Chondrocyte size in slow relaxing hydrogels in absence (CNTR) or presence of IL-1Ra (n > 30, p=0.27, t-test). f, Chondrocytes in fast relaxing gels after 7 days. Scale bar, 5μm. g, Chondrocyte size (n > 50 cells, #### p <0.0001, Spearman’s correlation, * and **** indicate p < 0.05 or 0.0001, one-way ANOVA). h, Ki-67 stainings. Scale bar, 25 μm. i, Chondrocyte proliferation (n=3, 200+ cells per replicate, #### p < 0.0001, Spearman’s correlation). j, Normalized LDH levels (n=5, Spearman’s rank correlation, p <0.0001). k–m, Normalized gene expression of (k) IL-1β, (l) MMP13, and (m) ADAMTS4 after 7 days of culture (n=3, ### p <0.001, and #### p <0.0001, Spearman’s correlation). From k to m, *, **, ***, and **** indicate statistical significant difference against control with p <0.05, 0.01, 0.001, and 0.0001 respectively (one-way ANOVA). n–r, Scatter plots of (n) proliferation, (o) LDH levels, and gene expression of (p) IL-1β, (q) MMP13, and (r) ADAMTS4 with cell area for varying stress relaxation or osmotic pressure. For n and o, linear regression analysis showed a global trend (purple line) of proliferation or cell death with area of single cells. Data are shown as mean ± s.e.m.
Figure 6
Figure 6. Hydrogel stress relaxation regulates chondrocyte phenotype through restricting cell volume expansion and cartilage matrix formation
Primary chondrocytes initially expand their volume following encapsulation in a hydrogel. In an elastic hydrogel, elastic stresses from the solid matrix resist the expansion and confine cell volume. Spatial confinement of cell volume inhibits proliferation of the cell and stimulates production of IL-1β, which in turn drives catabolic activities of chondrocytes and cell death. In a viscoelastic hydrogel with fast stress relaxation, elastic stresses are dissipated over time, allowing cell volume expansion. Over longer times, elastic stresses resisting cell proliferation and cartilage matrix deposition are also relaxed, allowing formation of a greater volume of interconnected cartilage matrix.

Similar articles

Cited by

References

    1. Getgood A, Brooks R, Fortier L, Rushton N. Articular cartilage tissue engineering: today’s research, tomorrow’s practice? J Bone Joint Surg Br. 2009;91:565–576. - PubMed
    1. Guettler JH. Osteochondral Defects in the Human Knee: Influence of Defect Size on Cartilage Rim Stress and Load Redistribution to Surrounding Cartilage. Am J Sports Med. 2004;32:1451–1458. - PubMed
    1. Brittberg M, Lindahl A, Nilsson A, Ohlsson C, Isaksson O, Peterson L. Treatment of deep cartilage defects in the knee with autologous chondrocyte transplantation. J Med. 1994;331:889–895. - PubMed
    1. Gibson AJ, McDonnell SM, Price AJ. Matrix-Induced Autologous Chondrocyte Implantation. Oper Tech Orthop. 2006;16:262–265.
    1. Steadman JR, Rodkey WG, Briggs KK, Rodrigo JJ. The microfracture technic in the management of complete cartilage defects in the knee joint. Orthopade. 1999;28:26–32. - PubMed

Publication types