. 2017 Nov;23(11):1362-1368.
doi: 10.1038/nm.4407. Epub 2017 Oct 2.

Keap1 loss promotes Kras-driven lung cancer and results in dependence on glutaminolysis

Affiliations

Keap1 loss promotes Kras-driven lung cancer and results in dependence on glutaminolysis

Rodrigo Romero et al. Nat Med. 2017 Nov.

Abstract

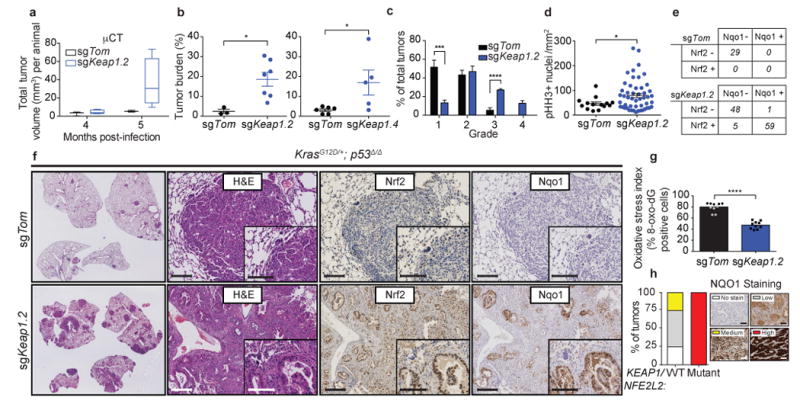
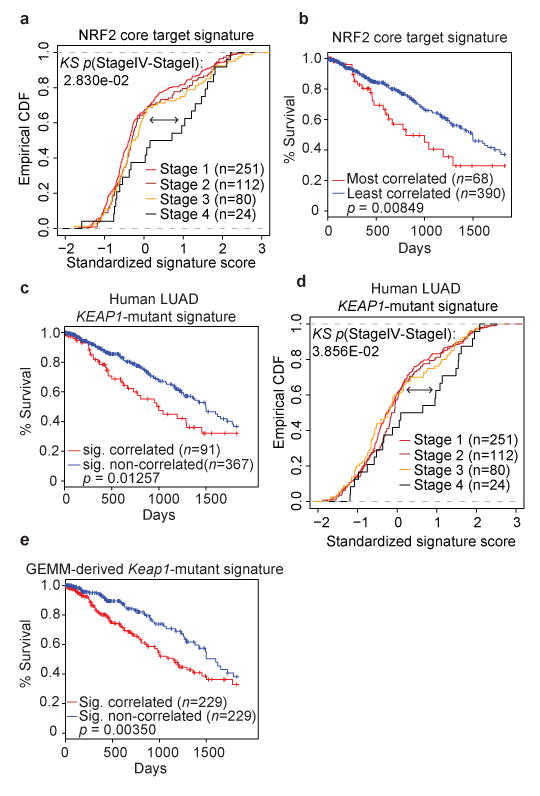
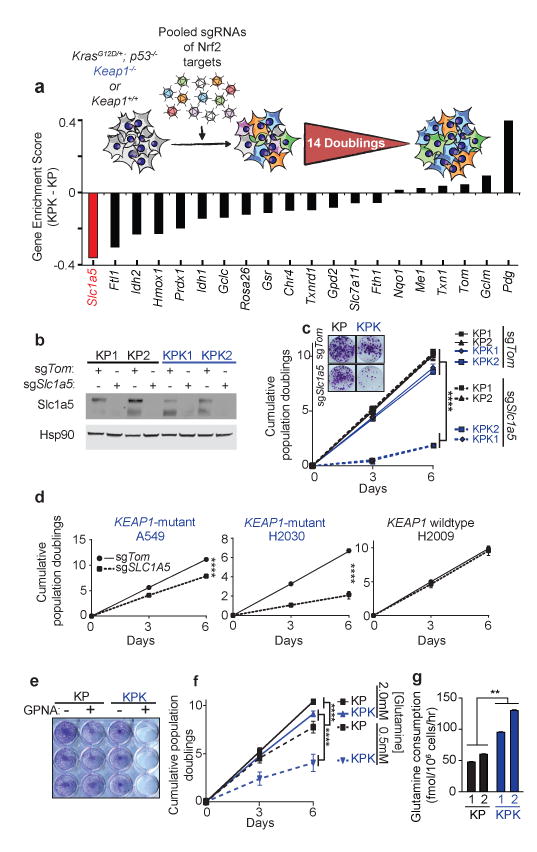
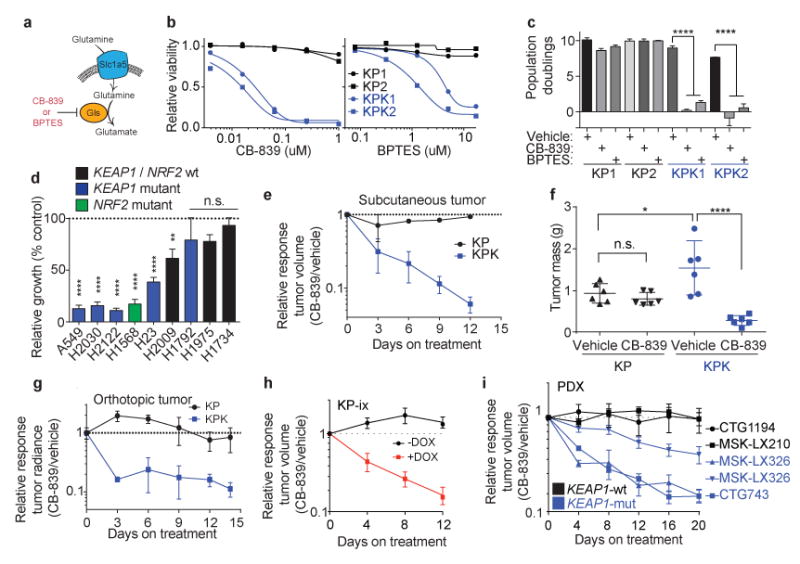
Treating KRAS-mutant lung adenocarcinoma (LUAD) remains a major challenge in cancer treatment given the difficulties associated with directly inhibiting the KRAS oncoprotein. One approach to addressing this challenge is to define mutations that frequently co-occur with those in KRAS, which themselves may lead to therapeutic vulnerabilities in tumors. Approximately 20% of KRAS-mutant LUAD tumors carry loss-of-function mutations in the KEAP1 gene encoding Kelch-like ECH-associated protein 1 (refs. 2, 3, 4), a negative regulator of nuclear factor erythroid 2-like 2 (NFE2L2; hereafter NRF2), which is the master transcriptional regulator of the endogenous antioxidant response. The high frequency of mutations in KEAP1 suggests an important role for the oxidative stress response in lung tumorigenesis. Using a CRISPR-Cas9-based approach in a mouse model of KRAS-driven LUAD, we examined the effects of Keap1 loss in lung cancer progression. We show that loss of Keap1 hyperactivates NRF2 and promotes KRAS-driven LUAD in mice. Through a combination of CRISPR-Cas9-based genetic screening and metabolomic analyses, we show that Keap1- or Nrf2-mutant cancers are dependent on increased glutaminolysis, and this property can be therapeutically exploited through the pharmacological inhibition of glutaminase. Finally, we provide a rationale for stratification of human patients with lung cancer harboring KRAS/KEAP1- or KRAS/NRF2-mutant lung tumors as likely to respond to glutaminase inhibition.


Figures

Figure 1
Figure 1. Loss of Keap1 stabilizes Nrf2 and accelerates lung tumorigenesis
a) Micro-computed tomography (micro-CT) quantification of total tumor volume (mm3) of tumors from sgKeap1.4 (n = 5) or sgTom (n = 3) infected animals at 4 and 5 months post infection. b) Combined quantification of tumor burden (total tumor area/total lung area) in KrasLSL-G12D/+; p53fl/fl (KP) animals after infection with pSECC lentiviruses. Left panel: tumor burden 21 weeks post infection of animals infected with control sgTom (n = 3) or sgKeap1.2 (n = 7). Right panel: tumor burden 21 weeks post infection of animals infected with control sgTom (n = 6) or sgKeap1.4 (n = 5). The asterisks indicate statistical significance obtained from comparing KP-sgKeap1 samples to KP-sgTom samples. c) Distribution of histological tumor grades in KP animals 21 weeks after infection with pSECC lentiviruses expressing: control (sgTom, KP; n = 7 mice), sgKeap1.2 (KP; n = 3 mice). d) Quantification of phospho-Histone H3 (pHH3) positive nuclei per mm2 to assess the mitotic index of tumor cells from lung tumors in KP animals 21 weeks after infection with pSECC lentiviruses expressing: control (sgTom, n = 14 tumors), or sgKeap1.2 (n = 50 tumors). e) Contingency tables demonstrating correlation between nuclear Nrf2 expression and Nqo1 expression. Top panel: quantified tumors obtained from control sgTom infected mice. Bottom panel: quantified tumors obtained from sgKeap1.2 infected mice (two-sided Fisher's exact test, ****p < 0.0001). f) Representative hematoxylin and eosin (H&E) and immunohistochemistry (IHC) staining of serial sections from lung tumors of mice 21 weeks after infection with pSECC-sgTom (top panel) or pSECC-sgKeap1.2 (bottom panel). First panels: representative overall lung tumor burden. Second panel: higher magnification H&E of representative tumors. Third panel: Nuclear Nrf2 IHC. Fourth panel: Nqo1 IHC. Note the accumulation of Nrf2 and Nqo1 occurs only in tumors from pSECC-sgKeap1.2 mice. Inset represents higher magnification. Scale bars are 100um. g) Oxidative stress index as judged by % 8-oxo-dG positive nuclei (n = 10 per genotype). All error bars denote s.e.m. Obtained from two-sided Student's t-test unless otherwise noted. *p < 0.05, ***p < 0.001, ****p < 0.0001. h) KEAP1/NRF2-mutant versus WT human LUAD biopsy IHC for NQO1. All tumor samples were confirmed to be KEAP1/NRF2 mutant via targeted exome sequencing (See Supplementary Table 1). Right legend depicts examples of staining criteria.
Figure 2
Figure 2. A NRF2 target gene signature and a human derived KEAP1-mutant and predict human LUAD patient survival
a) Empirical cumulative distribution function (CDF) plot showing correlation of individual tumors with the NRF2 core target signature across various clinical stages within the TCGA LUAD cohort. Each curve in the plot represents a unique clinical stage as depicted in the figure legend. Clinical stage IV tumors (n = 24) are highly correlated with the NRF2 core target signature and are significantly different compared to lower stage I tumors (n = 251; p = 0.028; KS = Kolmogorov-Smirnov test). b) Kaplan-Meier (KM) survival curves comparing LUAD TCGA patients stratified by their correlation with the NRF2 core target signature. Patient tumor samples were binned according to their gene expression correlation with the NRF2 signature. The top 15% (n = 68) correlated tumors exhibit significantly decreased survival compared to the rest (n = 390) of the TCGA LUAD cohort (p = 0.008, log-rank test). c) KM survival curves comparing TCGA LUAD patients stratified by their correlation with the KEAP1-mutant signature derived from TCGA patient expression profiles. The top 20% correlated patients (n = 91) exhibit decreased survival compared to the rest (n = 367) of the TCGA LUAD cohort (p = 0.012, log-rank test). d) Empirical cumulative distribution function (CDF) plot showing expression correlation of individual tumors with the KEAP1-mutant signature across various clinical stages within the TCGA LUAD cohort. Each curve represents a unique clinical stage as depicted in the figure legend. Clinical stage IV tumors (n = 24) are highly correlated with the KEAP1-mutant signature and are significantly different compared to stage I tumors (n = 251; p = 0.038, KS=Kolmogorov-Smirnov test). e) KM survival curves comparing TCGA LUAD patients stratified by their correlation with the murine-derived Keap1-mutant signature. The top 50% correlated tumors (n = 229) exhibit significantly decreased survival compared to the rest (n = 229) of the TCGA LUAD cohort (p < 0.003, log-rank test).
Figure 3
Figure 3. CRISPR screen reveals that Keap1-mutant cells are glycolytic and sensitive to reduced levels of glutamine
a) Pooled sgRNA library screen. Figure inlet; schematic of experiment. Cells were passaged for 14 doublings before collection. Bars represent the median differential genescore. Full representation in Supplementary Fig 7a. b) Western blot analysis of Slc1a5 in KP and KPK cells post selection infected with sgTom or sgSlc1a5. Hsp90 was used as a loading control. c) Cumulative population doublings of KP and KPK cells after transduction with sgTom or sgSlc1a5 (n = 4). Picture inlet; colony formation assay in KP and KPK cells transduced with sgTom or sgSlc1a5. ****p < 0.0001 obtained from 2-way ANOVA. d) Cumulative population doublings of KRAS-mutant human lung cancer cell line either KEAP1-WT (H2009) or KEAP1-mutant (A549 and H2030) after selection with sgTom or sgSLC1A5 (n = 4). ****p < 0.0001 obtained from 2-way ANOVA. e) Crystal violet stain of KP and KPK cells treated with 1mM GPNA or Vehicle for 72 hrs. f) Cumulative population doublings of KP and KPK cells cultured in 2.0mM or 0.5mM glutamine (n = 4). ****p < 0.0001 obtained from 2-way ANOVA. g) Glutamine consumption in KP and KPK cells measured (n = 3). All samples were normalized to their respective vehicle treated control. **p < 0.01 obtained from 1-way ANOVA with Tukey's post hoc test. All error bars depict s.e.m.
Figure 4
Figure 4. Keap1-mutant cells display a robust sensitivity to glutaminase inhibition
a) Schematic of glutamine uptake by Slc1a5 and hydrolysis of glutamine to glutamate by Gls. Inhibitors of Gls are shown in red. b) Relative viability assayed by cell-titer glo (relative luminescent units) on KP and KPK cells after treatment with CB-839 (left) or BPTES (right) for 72 hrs. All data points are relative to vehicle treated controls (n = 4 technical replicates/data point). c) Cumulative population doublings of KP and KPK cells in the presence of vehicle, CB-839 or BPTES (n = 4 technical replicates/data point) after 6 days in culture. d) Trypan blue exclusion viability counts of indicated human lung cancer cell lines. Each cell line was cultured in the presence of vehicle or 500nM CB-839 (n = 4 technical replicates/cell line). Displayed results are normalized against vehicle treated cell lines after 72 hrs of treatment. A549 and H1975 are TP53-wild type, all others are TP53-mutant. e) Subcutaneous tumor volumes of KP and KPK treated with vehicle or CB-839 starting from day 13 measured over time for 25 days (n = 6 tumors/genotype/treatment). Related to Fig 4f. f) Final tumor masses related to Supplementary Data Fig 11b. *p < 0.05, ****p < 0.0001 obtained from 1-way ANOVA with Tukey's post hoc test. g) Orthotopic growth measurements of KP and KPK cells treated with vehicle or CB-839 starting from day 13 (n = 4 mice/genotype/treatment). Quantitation of luminescence (photon flux) in mice orthotopically transplanted with KP or KPK cells transduced with a vector expressing Luciferase. Relative photon flux calculated by normalizing all time points per animal to initial measurements at 10 days post transplantation. Individual groups depicted in Supplementary Data Fig 11c. ***p < 0.001 obtained from 2-way ANOVA. h) Subcutaneous tumor volumes of KP-ix (inducible GOF-Nrf2) treated with vehicle or CB-839 in the presence or absence of doxycycline (DOX) (n = 6 mice/DOX treatment). Individual groups and full experiment depicted in Supplementary Data Fig 11d. i) Five patient-derived xenograft (PDX) models treated with vehicle or CB-839 for the indicated amount of days. Individual groups and full experiments depicted in Supplementary Data Fig 11g and h. All error bars depict s.e.m.

References

    1. Cox AD, Fesik SW, Kimmelman AC, Luo J, Der CJ. Drugging the undruggable RAS: Mission possible? Nat Rev Drug Discov. 2014;13:828–851. doi: 10.1038/nrd4389. - DOI - PMC - PubMed
    1. Berger AH, et al. High-throughput Phenotyping of Lung Cancer Somatic Mutations. Cancer Cell. 2016;30:214–228. doi: 10.1016/j.ccell.2016.06.022. - DOI - PMC - PubMed
    1. Cancer Genome Atlas Research, N. Comprehensive molecular profiling of lung adenocarcinoma. Nature. 2014;511:543–550. doi: 10.1038/nature13385. - DOI - PMC - PubMed
    1. Singh A, et al. Dysfunctional KEAP1-NRF2 interaction in non-small-cell lung cancer. PLoS medicine. 2006;3:e420. doi: 10.1371/journal.pmed.0030420. - DOI - PMC - PubMed
    1. Itoh K, et al. An Nrf2/small Maf heterodimer mediates the induction of phase II detoxifying enzyme genes through antioxidant response elements. Biochem Biophys Res Commun. 1997;236:313–322. - PubMed