. 2017 Nov;23(11):1271-1276.
doi: 10.1038/nm.4411. Epub 2017 Oct 2.

Defining total-body AIDS-virus burden with implications for curative strategies

Affiliations

Defining total-body AIDS-virus burden with implications for curative strategies

Jacob D Estes et al. Nat Med. 2017 Nov.

Abstract

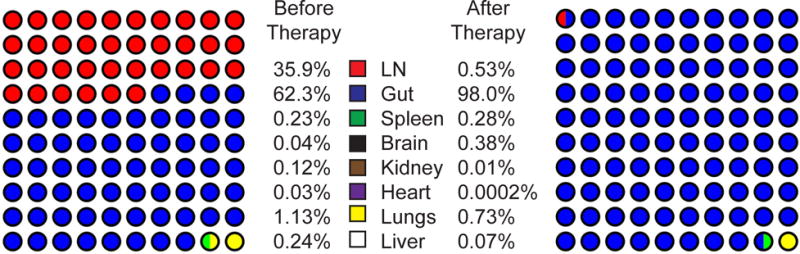
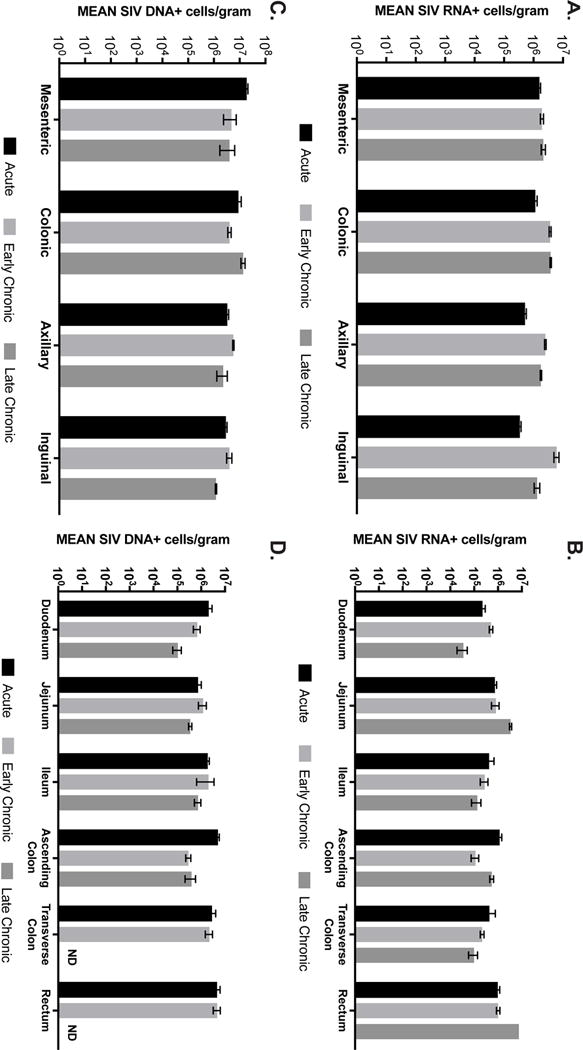
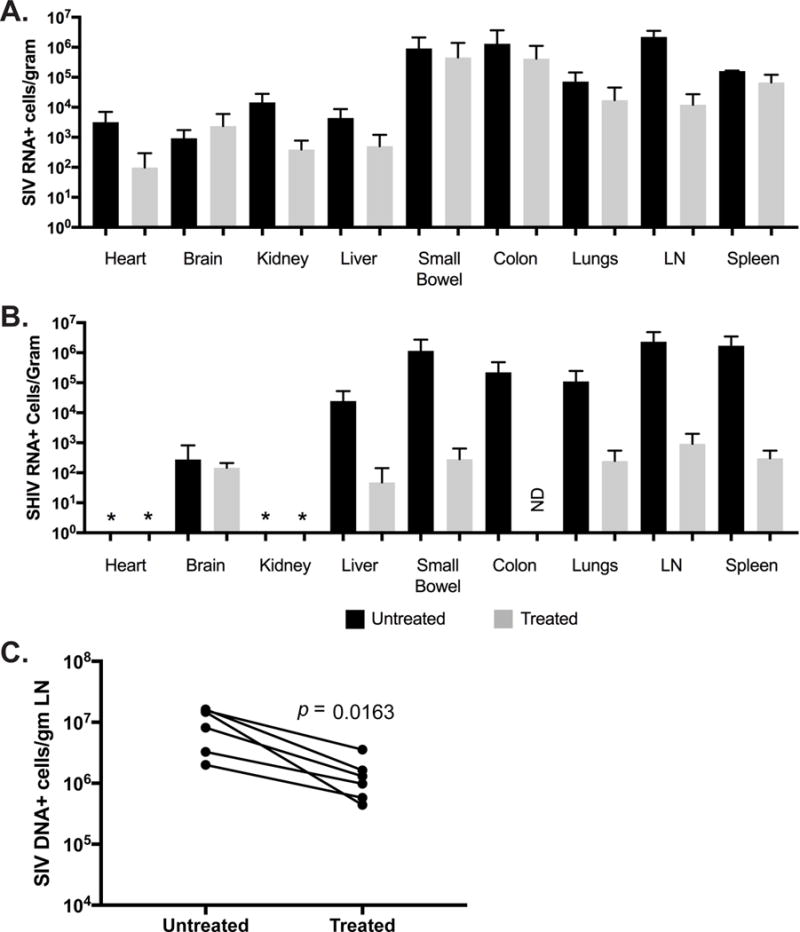
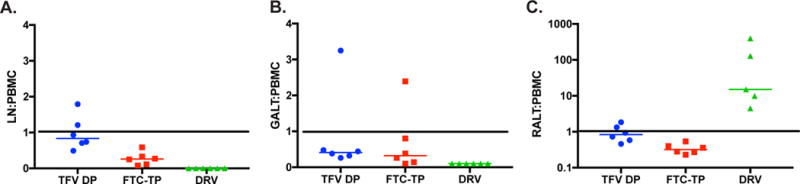
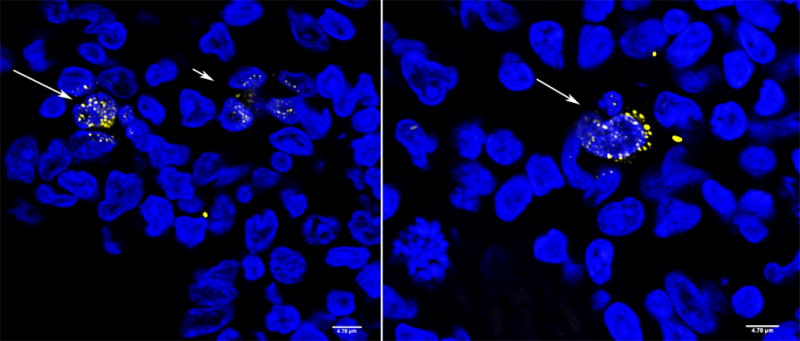
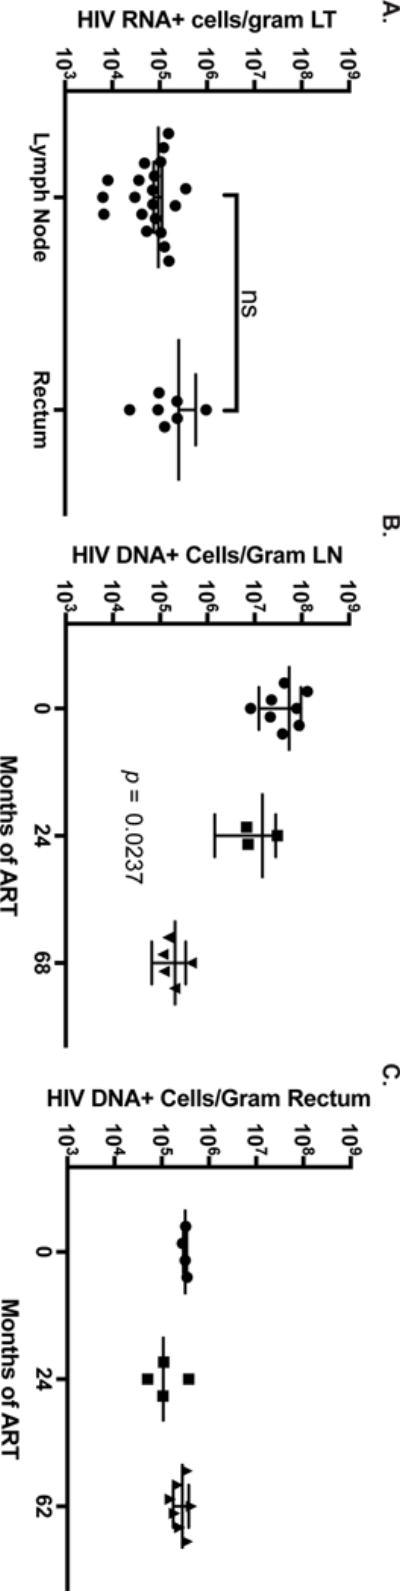
In the quest for a functional cure or the eradication of HIV infection, it is necessary to know the sizes of the reservoirs from which infection rebounds after treatment interruption. Thus, we quantified SIV and HIV tissue burdens in tissues of infected nonhuman primates and lymphoid tissue (LT) biopsies from infected humans. Before antiretroviral therapy (ART), LTs contained >98% of the SIV RNA+ and DNA+ cells. With ART, the numbers of virus (v) RNA+ cells substantially decreased but remained detectable, and their persistence was associated with relatively lower drug concentrations in LT than in peripheral blood. Prolonged ART also decreased the levels of SIV- and HIV-DNA+ cells, but the estimated size of the residual tissue burden of 108 vDNA+ cells potentially containing replication-competent proviruses, along with evidence of continuing virus production in LT despite ART, indicated two important sources for rebound following treatment interruption. The large sizes of these tissue reservoirs underscore challenges in developing 'HIV cure' strategies targeting multiple sources of virus production.


Conflict of interest statement

Competing Interests

There is NO Competing Interest.

Figures

Figure 1
Figure 1
Graphical representation of proportion of vRNA+ cells in each organ system before and during suppressive ART.
Figure 2
Figure 2
Quantitative image analysis of SIV vRNA+ cells in untreated SIV infection. A, B. Estimated frequency of vRNA+ cells/gram tissue in LN and gut associated LT in an animal sampled during acute, early chronic and late chronic stage of infection. C, D. Estimated frequency of SIV DNA+ cells in 4 different LN and 7 sites in GALT at each stage of SIV infection from the same animals. Each value is from a single LN from a single animal where an average of 5 sections is made. The error bars represent the SEM of the 5 measures.
Figure 3
Figure 3
Quantitative image analysis of vRNA+ and vDNA+ cells in groups of untreated and treated SIV and SHIV infection. A. Frequency (mean frequency and s.d.) of SIVmac251 RNA+ cells in untreated RM (animals euthanized at 14, 43, and 90 dpi) and RM after receiving 20-22 weeks of ART started at 56 dpi. B. Frequency of vRNA+ cells in RT-SHIV infected animals after 26 weeks of ART C. Frequency of SIV DNA+ cells in paired lymph nodes of 5 SIVmac239 infected macaques before and after 26 weeks of ART (comparison by paired t test). * means the tissue was not available and ND means none detected.
Figure 4
Figure 4
Intracellular concentrations of TFV-DP, FTC-TP, and DRV in LN, gut, and rectum compared with simultaneous measures in PBMC in six macaques. A. LN:PBMC. B. Gut:PBMC. Rectum:PBMC. Median concentration is indicated.
Figure 5
Figure 5
Virus-producing cells in two SIV-infected rhesus macaques during ART detected by ISH/TSA. In the left panel, the long arrow points to two virus-producing cells; the short arrow points to a cluster of four productively infected cells. In the right panel, the arrow points to two productively infected cells. Virus particles appear yellow; cell nuclei are blue. Multiphoton Images obtained at z steps of 0.1 microns and subsequently filtered to reduce the intracellular viral RNA staining so that virus particles were visible. The sizes of virions depend on the plane of focus; larger virions are in focus.
Figure 6
Figure 6
Frequency of vRNA and vDNA+ /gram in HIV+ Ugandans before and during ART in LN and rectal biopsies. A. Frequency of HIV RNA+ cell/gram LN compared to the frequency in rectum (unpaired t test). B, C. Frequency of DNA+ cells in LN and rectum versus months of ART (One-way ANOVA).

Similar articles

Cited by

References

    1. Yukl SA, et al. Challenges in detecting HIV persistence during potentially curative interventions: a study of the Berlin patient. PLoS Pathog. 2013;9:e1003347. - PMC - PubMed
    1. Embretson J, et al. Analysis of human immunodeficiency virus-infected tissues by amplification and in situ hybridization reveals latent and permissive infections at single-cell resolution. Proceedings of the National Academy of Sciences of the United States of America. 1993;90:357–361. - PMC - PubMed
    1. Embretson J, et al. Massive covert infection of helper T lymphocytes and macrophages by HIV during the incubation period of AIDS [see comments] Nature. 1993;362:359–362. - PubMed
    1. Faust RA, et al. Outpatient biopsies of the palatine tonsil: access to lymphoid tissue for assessment of human immunodeficiency virus RNA titers. Otolaryngology Head & Neck Surgery. 1996;114:593–598. - PubMed
    1. Fletcher CV, et al. Persistent HIV-1 replication is associated with lower antiretroviral drug concentrations in lymphatic tissues. Proc Natl Acad Sci U S A. 2014;111:2307–2312. - PMC - PubMed