. 2017 Oct 2;13(10):e1006663.
doi: 10.1371/journal.ppat.1006663. eCollection 2017 Oct.

Effects of glutamate and ivermectin on single glutamate-gated chloride channels of the parasitic nematode H. contortus

Affiliations

Effects of glutamate and ivermectin on single glutamate-gated chloride channels of the parasitic nematode H. contortus

Mohammed Atif et al. PLoS Pathog. .

Abstract

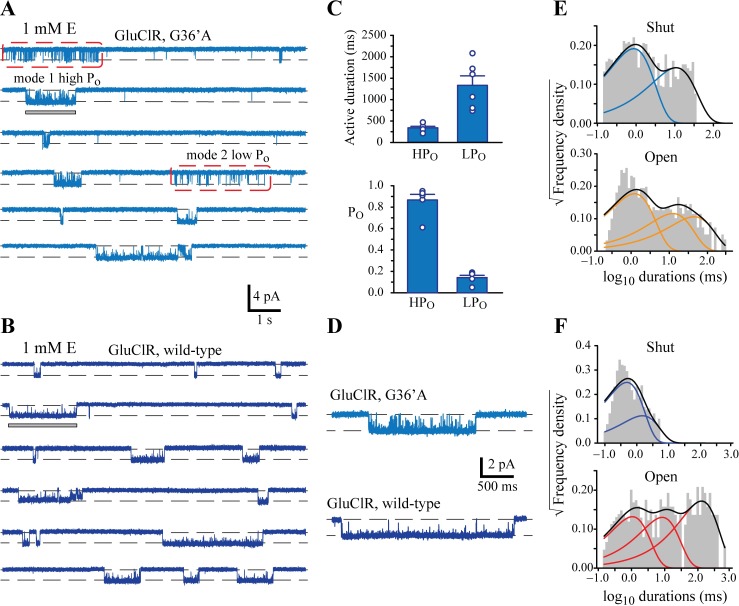
Ivermectin (IVM) is a widely-used anthelmintic that works by binding to and activating glutamate-gated chloride channel receptors (GluClRs) in nematodes. The resulting chloride flux inhibits the pharyngeal muscle cells and motor neurons of nematodes, causing death by paralysis or starvation. IVM resistance is an emerging problem in many pest species, necessitating the development of novel drugs. However, drug optimisation requires a quantitative understanding of GluClR activation and modulation mechanisms. Here we investigated the biophysical properties of homomeric α (avr-14b) GluClRs from the parasitic nematode, H. contortus, in the presence of glutamate and IVM. The receptor proved to be highly responsive to low nanomolar concentrations of both compounds. Analysis of single receptor activations demonstrated that the GluClR oscillates between multiple functional states upon the binding of either ligand. The G36'A mutation in the third transmembrane domain, which was previously thought to hinder access of IVM to its binding site, was found to decrease the duration of active periods and increase receptor desensitisation. On an ensemble macropatch level the mutation gave rise to enhanced current decay and desensitisation rates. Because these responses were common to both glutamate and IVM, and were observed under conditions where agonist binding sites were likely saturated, we infer that G36'A affects the intrinsic properties of the receptor with no specific effect on IVM binding mechanisms. These unexpected results provide new insights into the activation and modulatory mechanisms of the H. contortus GluClRs and provide a mechanistic framework upon which the actions of drugs can be reliably interpreted.


Conflict of interest statement

The authors have declared that no competing interests exist.

Figures

Fig 1
Fig 1. Single channel conductance and kinetic properties of GluClRs in response to glutamate activation.
A) Sample traces of single channel activity recorded in outside-out patches at indicated holding potentials. Channels were activated by 10 μM glutamate. B) Mean current-voltage relationship averaged from 6 patches. Error bars were smaller than symbol size. Vrev = reversal potential (4.0 mV). C) Examples of single channel activity in response to 200 μM glutamate. In this and all subsequent figures, recordings were performed at ‒70 mV and channel openings are downward deflections from the baseline. D) Shut and open dwell histograms for data obtained at 200 μM glutamate. The histograms show that the receptors have two shut and three open components. E) Examples of single channel activity recorded in response to 30 μM glutamate, indicating the presence of shorter activations. F) Shut and open dwell histograms for data obtained at 30 μM glutamate, again revealing the presence of two shut and three open components, but the longest shut component is slightly increased.
Fig 2
Fig 2. Kinetic properties of GluClRs at low glutamate concentrations.
A) Examples of continuous single channel activity recorded from an outside-out patch in response to 2 μM glutamate. B) Shut and open dwell histograms for data obtained at 2 μM glutamate. The histograms show that despite the reduced length of active periods, the receptors have two shut and three open components, but the longest shut component is increasing with decreasing concentration. C) Examples of single channel activity recorded in response to 30 nM glutamate, indicating the presence of mostly brief activations. D) Shut and open dwell histograms for data obtained at 30 nM glutamate, revealing the presence of two shut and two open components.
Fig 3
Fig 3. Concentration-dependence of glutamate effects on GluClRs.
A) Examples of how intra-activation open probability (PO) increased as glutamate concentration was increased. In the absence of glutamate single receptor activity was negligible. Activations of similar duration were selected to facilitate comparison. B) Effect of glutamate concentration on the time constants of the long (red symbols) and short (black symbols) shut-state dwell components. C) Effect of glutamate concentration on time constants of the open-state dwell components. The symbols denote the long (green symbols), intermediate (red symbols) and short (black symbols) time constants Note the disappearance of the longest open component and the reduction in length of the shorter open components at nanomolar glutamate. D) Mean intra-activation open probability (PO) plotted as a function of glutamate concentration. The curve represents a Hill equation fit with an EC50 of 70 nM. E) Mean active period duration plotted as a function of glutamate concentration. The curve represents a Hill equation fit with an EC50 of 31.2 μM. The data in B-E are means from 3–12 patches (see S2 Table).
Fig 4
Fig 4. Ensemble glutamate-induced activation properties of GluClRs.
A) Superimposed recordings revealing the effects of 50 ms (above) or 500 ms (below) applications of indicated glutamate concentrations onto macropatches expressing multiple GluClRs. B) Mean glutamate concentration-response relationship of peak currents as determined by fast agonist application. The curve represents a Hill equation fit with an EC50 of 43 μM. C) Normalised currents showing the concentration dependence of the activation phase of the current. The activation phase of each current trace was fitted to Eq 2. D) Mean glutamate concentration-response relationship of the activation rate (kact). The curve represents a Hill equation fit with an EC50 of 0.95 μM. The numbers with arrows in A and C are the glutamate concentrations (in μM) that correspond to the currents. The arrows point to the peak current in A and the corresponding current onset in C. The data in B and D are means from 6–15 patches.
Fig 5
Fig 5. Comparison of the effect of 1 mM glutamate on wild-type and G36’A mutant GluClRs.
A) Examples of continuous single channel activity recorded from G36’A mutant GluClRs. Note the emergence of a ‘spiky’ activation mode (red boxes) that is not observed in wild-type GluClRs. Wild-type-like activations are termed ‘mode 1’ or ‘high Po’, whereas spiky activations are termed ‘mode 2’ or ‘low Po’. B) Examples of continuous single channel activity recorded from wild-type GluClRs included for comparison. C) Comparison of mean active durations (upper panel) and Po (lower panel) of low (LPO) and high (HPO) PO events recorded from G36’A mutant GluClRs (n = 6 patches). D) Examples of activations demarcated by a grey bar in A and B. These activations are of the high PO mode for the G36’A mutant (above) and normal mode for wild-type (below). The comparison indicates that there are more numerous open-shut events within the activations of G36’A compared to wild-type. E) Shut and open dwell histograms for data obtained from G36’A mutant GluClRs at 1 mM glutamate. This plot combined LPO and HPO activations of G36’A receptors at 1 mM glutamate. The histograms show that the mutant receptors have two shut and three open components. F) Shut and open dwell histograms for data obtained from wild-type GluClRs at 1 mM glutamate, revealing two shut and three open components.
Fig 6
Fig 6. Concentration-dependence of glutamate effects on G36’A mutant GluClRs.
A) Examples of continuous single channel activity recorded at 30 μM glutamate. Note the presence of mode 1 and 2 events. B) Examples of single channel activity recorded in response to 2 μM glutamate, indicating the presence of brief activations only. C) Upper panel: Mean PO plotted as a function of glutamate concentration. The corresponding curve for the wild-type receptor is included as a dashed line. Lower panel: Mean active period duration plotted as a function of glutamate concentration. The corresponding curve for the wild-type receptor is included as a dashed line. Data represent mean from 3–7 patches. D) Upper panel: Effect of glutamate concentration on long (red symbols) and short (black symbols) shut-state dwell components. Lower panel: Effect of glutamate concentration on long (green symbols), intermediate (red symbols) and short (black symbols) open-state dwell components. Data represent mean ± SEM from 4–8 patches. E) Shut and open dwell histograms for data obtained at 30 μM glutamate, revealing two shut and three open components. F) Shut and open dwell histograms for data obtained at 2 μM glutamate, revealing two shut and two open components.
Fig 7
Fig 7. Estimation of desensitisation rate in patches expressing a known number of wild-type or G36’A mutant channels.
A) Continuous recording from a patch expressing wild-type receptors in response to rapid application of 1 mM glutamate. 9 channels were present in this patch. B) Corresponding recording from a macropatch expressing G36’A receptors. 6 channels were present in this patch. C) Shut dwell histogram of the activity shown in A. The longer component represented a mean desensitised lifetime of 12780 ms and it was this component that was corrected for channel number (12780 x 9 = 115020 ms or 115 s). D) Shut dwell histogram of the recording shown in B, which yielded a desensitised lifetime of 70 s. E) Desensitisation scheme for calculating equilibrium constant (δ/ω) for desensitisation.
Fig 8
Fig 8. Outside-out macropatch recordings of currents mediated by the indicated receptors.
A) Sample recordings from macropatches expressing α (avr-14b) GluClRs, α1β GlyRs and α5β3γ2 GABAARs in response to ~1 ms applications of saturating (3 mM) agonist (glutamate, glycine or GABA). B) Mean weighted current deactivation time constants for the receptors indicated in A. The individual time constants and their relative magnitudes are summarised in Table 1. C) Sample recordings from macropatches expressing wild-type and G36’A mutant GluClRs in response to ~1 ms applications of saturating (3 mM) glutamate. Note the substantial decrease in deactivation time in the mutant. D) Mean activation rates reveal no significant difference between the four receptor isoforms (n = 6–12 patches). E) Sample recordings from macropatches expressing wild-type and G36’A mutant GluClRs in response to 500 ms applications of saturating (3 mM) glutamate. F) Mean desensitisation rates as calculated from n = 6–10 patches. The mutant plot represents a weighted mean of two components.
Fig 9
Fig 9. Direct activation by 5 nM IVM.
A) Four segments of recording illustrating the progressive increase (early, intermediate and late) in active durations upon first exposure to 5 nM IVM alone for wild-type GluClRs. B) Steady-state currents mediated by wild-type GluClRs in the continuous presence of 5 nM IVM. C) Four segments of record showing the progressive increase (early, intermediate and late) in active durations upon first exposure to 5 nM IVM alone for G36’A mutant GluClRs. The late phase precedes the steady-state phase. D) Steady-state currents mediated G36’A GluClRs in the continuous presence of 5 nM IVM alone. Note the much briefer activations compared to wild-type. E) Bar plots summarising the mean active durations for wild-type and G36’A mutant GluClRs (n = 6 patches each). F) Bar plots summarising the mean POs for wild-type and G36’A mutant GluClRs (n = 6 patches each). * p< 0.01.
Fig 10
Fig 10. Current potentiation in the presence of 2 μM glutamate and 5 nM IVM.
A) Three segments of record showing the progressive increase (early, intermediate and late) in active durations upon exposure to both ligands for wild-type GluClRs. The late phase precedes the steady-state phase. B) Continuous sweeps of recording showing the equilibrated or steady-state phase of the recordings for wild-type GluClRs. These segments were used to determine receptor desensitisation. C) Three segments of record showing the progressive increase (early, intermediate and late) in active durations upon exposure to both ligands for G36’A mutant GluClRs. D) The steady-state phase of currents mediated by G36’A mutant GluClRs mostly consisted of relatively brief activations, along with the occasional longer activations. E) Summary of the mean active durations for wild-type (n = 7 patches) and G36’A mutant (n = 6 patches) GluClRs. F) Summary of the mean POs for wild-type and G36’A mutant GluClRs. * p < 0.01.
Fig 11
Fig 11. Structural representations of TM3 domains in shut and IVM bound configurations.
A) TM3 domains of homomeric GluClRs and α1 GlyRs in shut configurations. B) TM3 domains of homomeric GluClRs and α1 GlyRs in IVM-bound configurations. C) TM3 domains of the GluClR in shut and IVM-bound configurations. D) TM3 domains of the α1 GlyRs in shut and IVM-bound configurations. In all cases residues between 29’ and 36’ were fixed as a reference and the extent of displacement (in Angstrom units) was measured at the 56’ position. The pdb files used in the figure were, the GluClR in a shut conformation (PDB, 4TNV), the GluClR in complex with ivermectin (PDB, 3RHW), the α1 GlyR in a shut conformation in complex with strychnine (PDB, 3JAD), and the structure of the α1 GlyR in complex with ivermectin (PDB, 3JAF). IVM is shown as a stick-ball structure in green.

References

    1. Cull-Candy SG. Two types of extrajunctional L-glutamate receptors in locust muscle fibres. J Physiol. 1976;255(2):449–64. Epub 1976/02/01. ; PubMed Central PMCID: PMC1309257. - PMC - PubMed
    1. Gration KA, Clark RB, Usherwood PN. Three types of L-glutamate receptor on junctional membrane of locust muscle fibres. Brain research. 1979;171(2):360–4. Epub 1979/08/03. . - PubMed
    1. Marder E, Paupardin-Tritsch D. The pharmacological properties of some crustacean neuronal acetylcholine, γ-aminobutyric acid, and L-glutamate responses. J Physiol. 1978;280:213–36. ; PubMed Central PMCID: PMC1282656. - PMC - PubMed
    1. Wolstenholme AJ. Glutamate-gated chloride channels. The Journal of biological chemistry. 2012;287(48):40232–8. Epub 2012/10/06. doi: 10.1074/jbc.R112.406280 ; PubMed Central PMCID: PMC3504739. - DOI - PMC - PubMed
    1. Cully DF, Vassilatis DK, Liu KK, Paress PS, Van der Ploeg LH, Schaeffer JM, et al. Cloning of an avermectin-sensitive glutamate-gated chloride channel from Caenorhabditis elegans. Nature. 1994;371(6499):707–11. Epub 1994/10/20. doi: 10.1038/371707a0 . - DOI - PubMed

LinkOut - more resources