

Three-dimensional cardiovascular imaging-genetics: a mass univariate framework
- PMID: 28968671
- PMCID: PMC5870605
- DOI: 10.1093/bioinformatics/btx552
Three-dimensional cardiovascular imaging-genetics: a mass univariate framework
Abstract
Motivation: Left ventricular (LV) hypertrophy is a strong predictor of cardiovascular outcomes, but its genetic regulation remains largely unexplained. Conventional phenotyping relies on manual calculation of LV mass and wall thickness, but advanced cardiac image analysis presents an opportunity for high-throughput mapping of genotype-phenotype associations in three dimensions (3D).
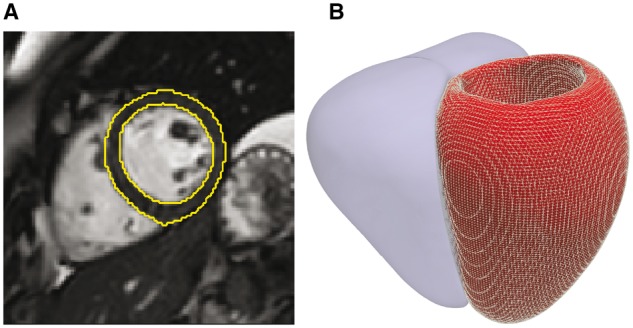
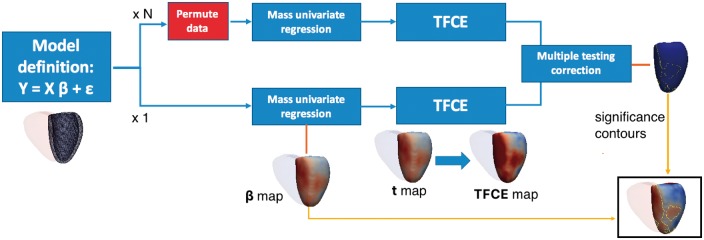
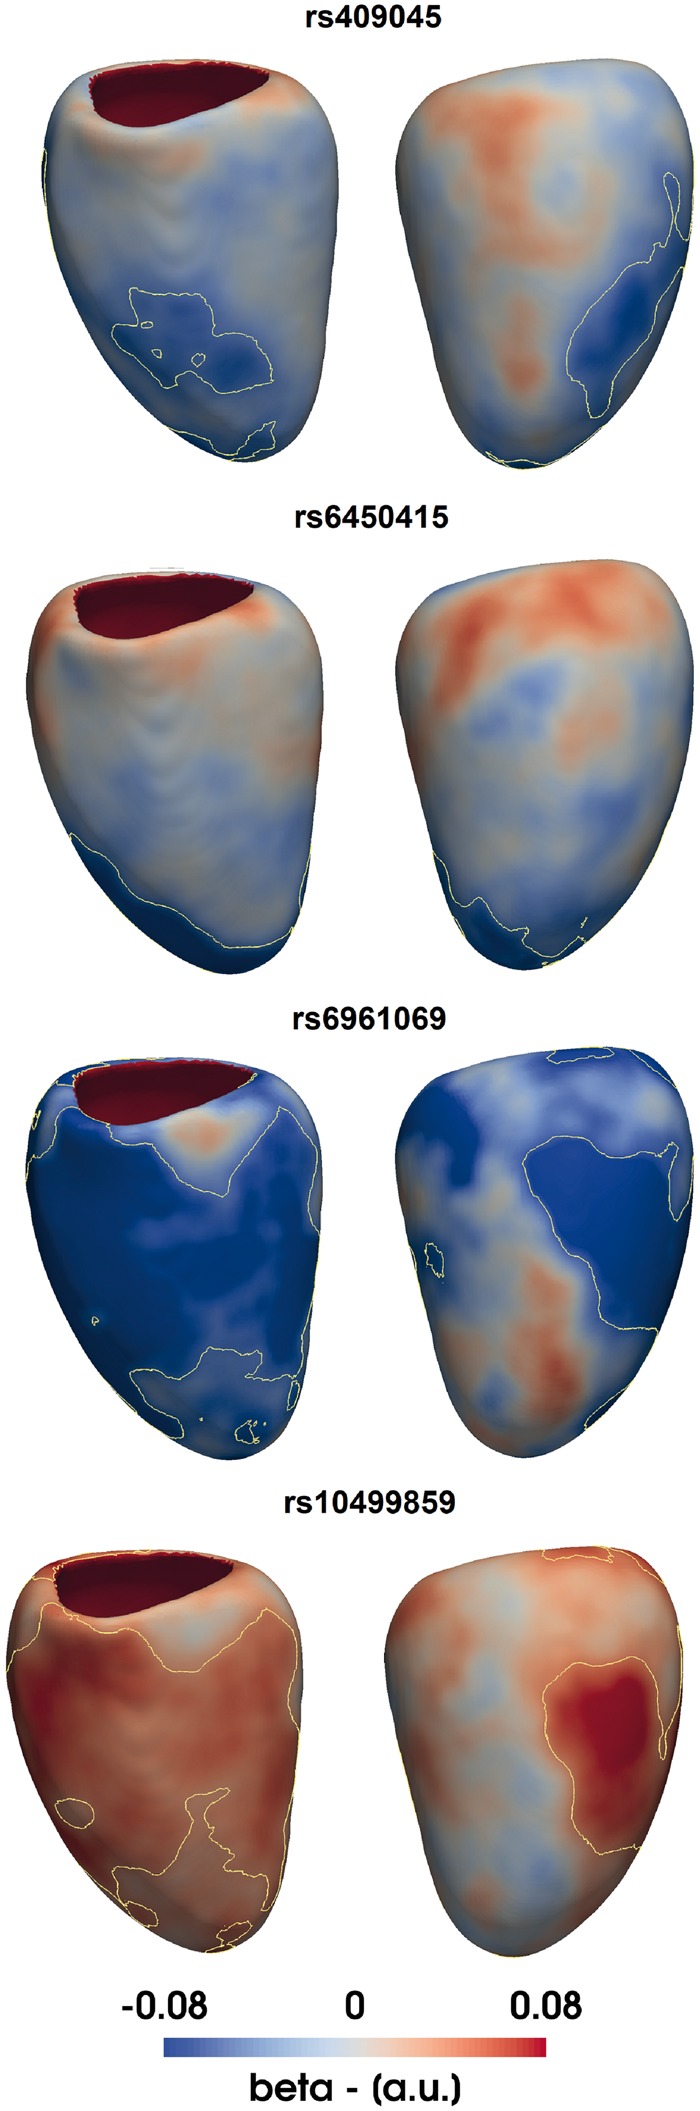
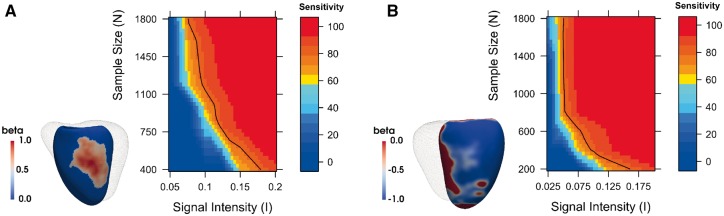
Results: High-resolution cardiac magnetic resonance images were automatically segmented in 1124 healthy volunteers to create a 3D shape model of the heart. Mass univariate regression was used to plot a 3D effect-size map for the association between wall thickness and a set of predictors at each vertex in the mesh. The vertices where a significant effect exists were determined by applying threshold-free cluster enhancement to boost areas of signal with spatial contiguity. Experiments on simulated phenotypic signals and SNP replication show that this approach offers a substantial gain in statistical power for cardiac genotype-phenotype associations while providing good control of the false discovery rate. This framework models the effects of genetic variation throughout the heart and can be automatically applied to large population cohorts.
Availability and implementation: The proposed approach has been coded in an R package freely available at https://doi.org/10.5281/zenodo.834610 together with the clinical data used in this work.
Contact: declan.oregan@imperial.ac.uk.
Supplementary information: Supplementary data are available at Bioinformatics online.
© The Author(s) 2017. Published by Oxford University Press.
Figures
References
-
- Bai W. et al. (2015) A bi-ventricular cardiac atlas built from 1000+ high resolution MR images of healthy subjects and an analysis of shape and motion. Med. Image Anal., 26, 133–145. - PubMed
-
- Benjamin Y., Hochberg Y. (1995) Controlling the false discovery rate: a practical and powerful approach to multiple testing. J. R. Stat. Soc. Ser. B, 57, 289–300.
-
- Benjamini Y. et al. (2006) Adaptive linear step-up procedures that control the false discovery rate. Biometrika, 93, 491–507.
-
- Benjamini Y., Yekutieli D. (2001) The control of the false discovery rate in multiple testing under dependency. Ann. Stat., 29, 1165–1188.
Publication types
MeSH terms
Grants and funding
LinkOut - more resources
Full Text Sources
Other Literature Sources
