. 2018 Sep 1;28(9):3129-3142.
doi: 10.1093/cercor/bhx181.

Neuronal Expression of Opioid Gene is Controlled by Dual Epigenetic and Transcriptional Mechanism in Human Brain

Affiliations

Neuronal Expression of Opioid Gene is Controlled by Dual Epigenetic and Transcriptional Mechanism in Human Brain

Igor Bazov et al. Cereb Cortex. .

Abstract

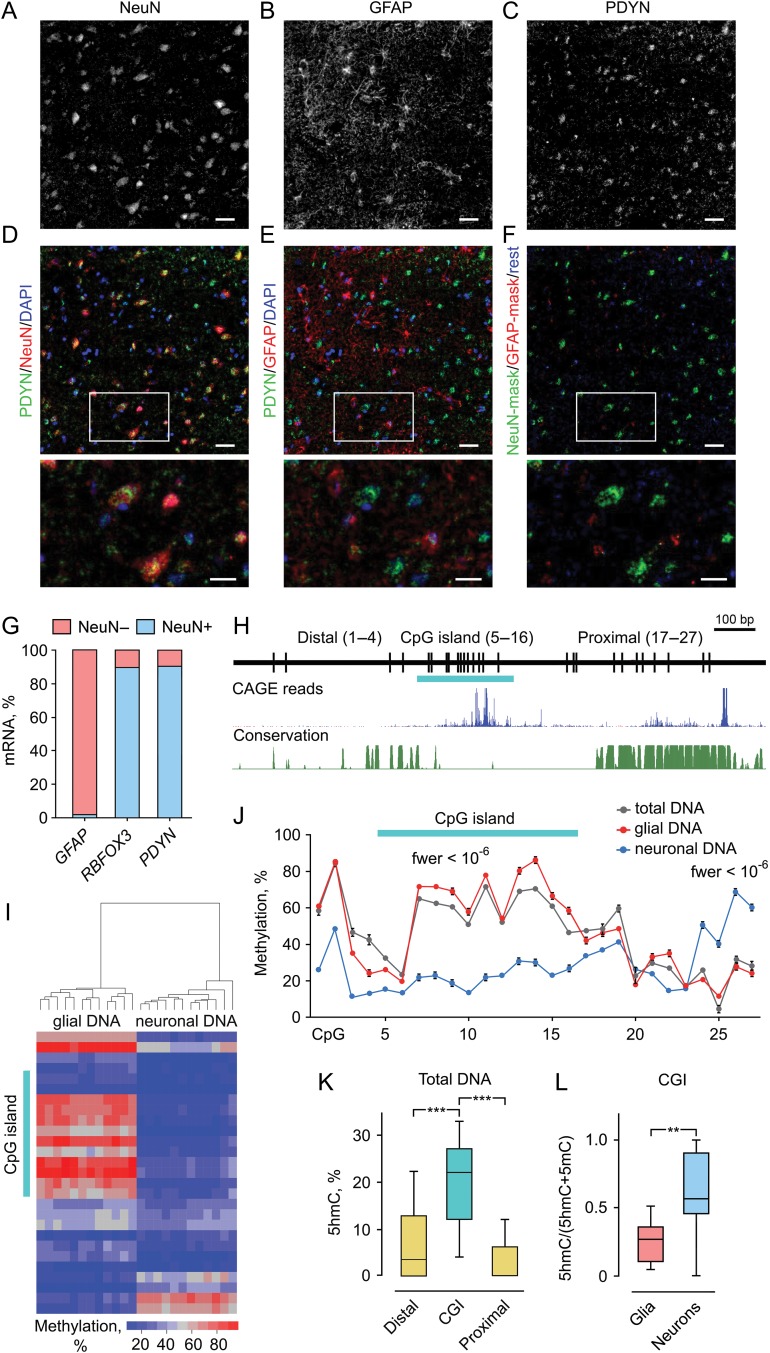
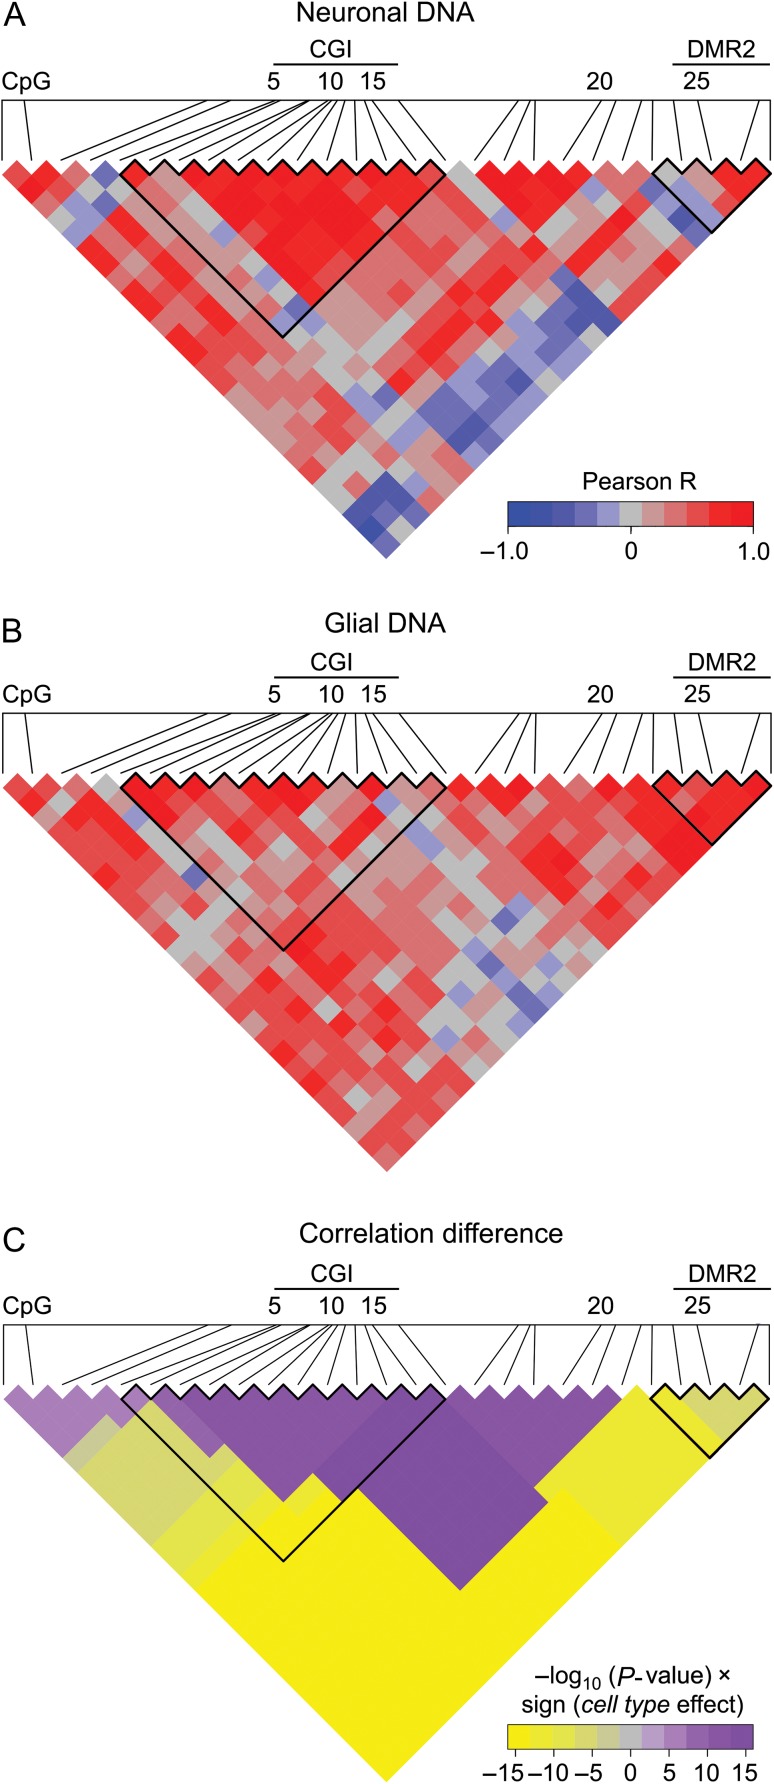
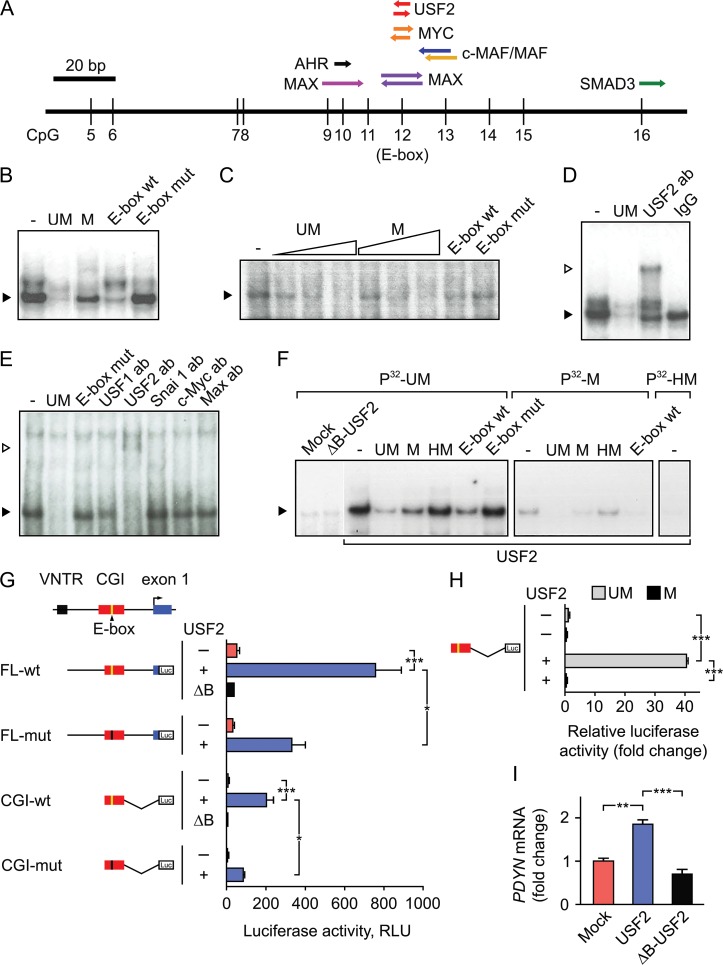
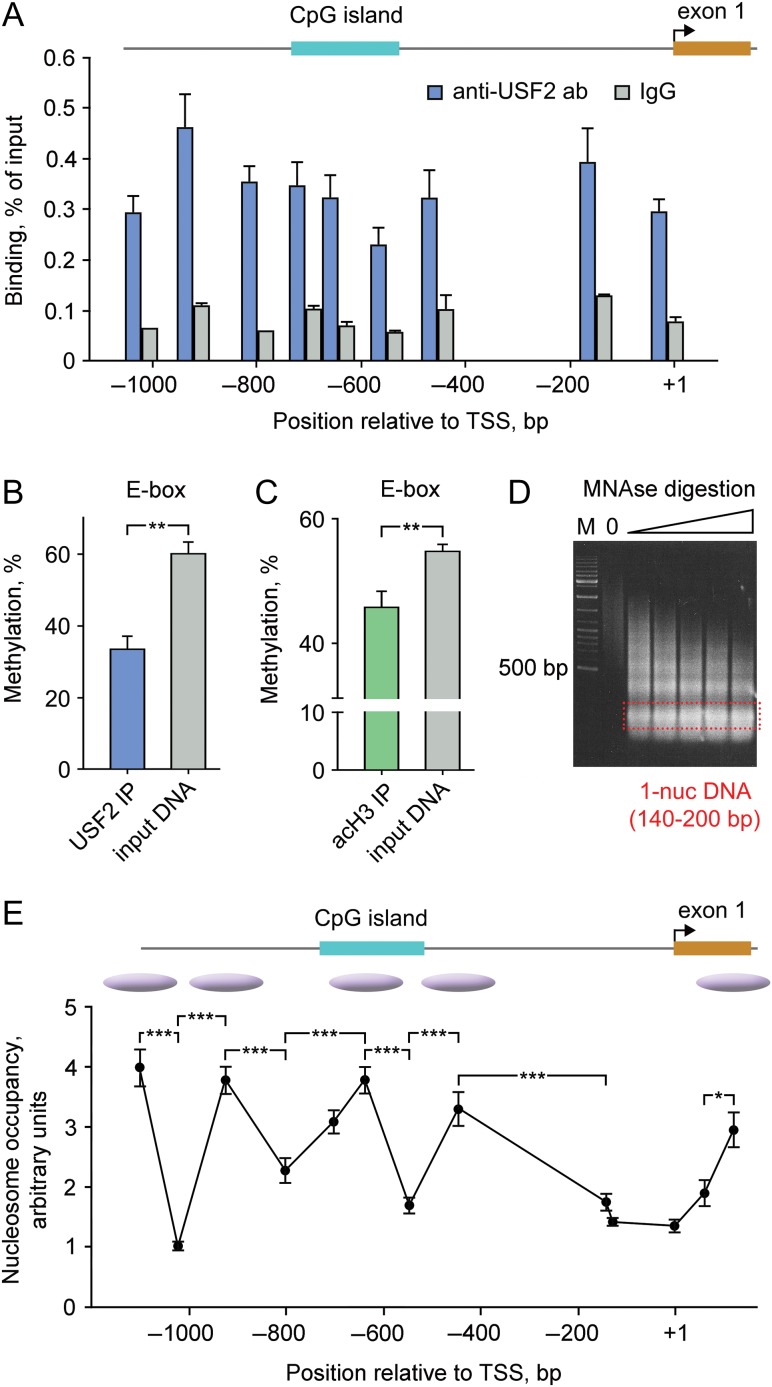
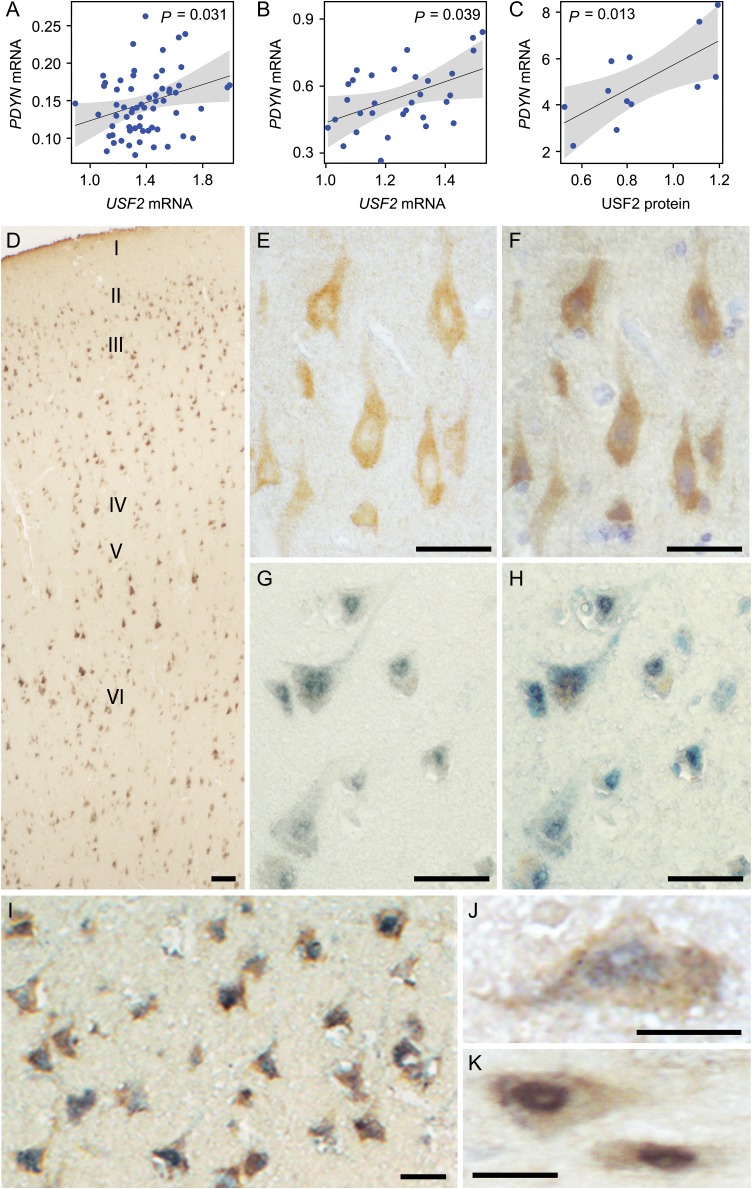
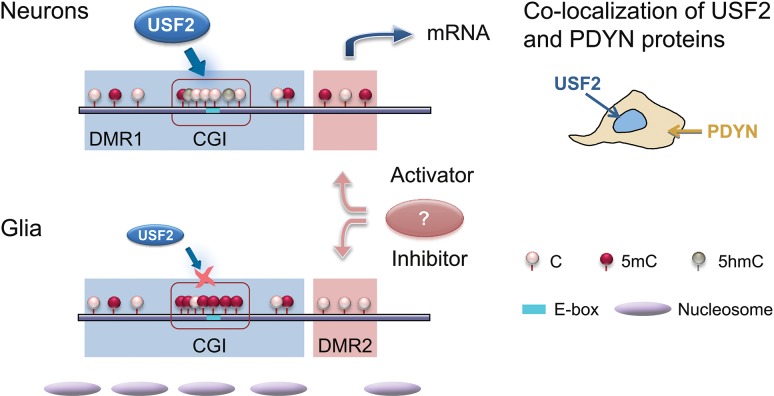
Molecular mechanisms that define patterns of neuropeptide expression are essential for the formation and rewiring of neural circuits. The prodynorphin gene (PDYN) gives rise to dynorphin opioid peptides mediating depression and substance dependence. We here demonstrated that PDYN is expressed in neurons in human dorsolateral prefrontal cortex (dlPFC), and identified neuronal differentially methylated region in PDYN locus framed by CCCTC-binding factor binding sites. A short, nucleosome size human-specific promoter CpG island (CGI), a core of this region may serve as a regulatory module, which is hypomethylated in neurons, enriched in 5-hydroxymethylcytosine, and targeted by USF2, a methylation-sensitive E-box transcription factor (TF). USF2 activates PDYN transcription in model systems, and binds to nonmethylated CGI in dlPFC. USF2 and PDYN expression is correlated, and USF2 and PDYN proteins are co-localized in dlPFC. Segregation of activatory TF and repressive CGI methylation may ensure contrasting PDYN expression in neurons and glia in human brain.


Figures

Figure 1.
Figure 1.
Neuronal expression of PDYN in human dlPFC is associated with 2 DMRs and elevated 5hmC levels in the promoter CGI. (AF) Immunofluorescence micrographs showing the distribution of PDYN immunoreactivity (ir) in NeuN-ir neurons (A and D) and GFAP-ir astrocytes (B and E) in the cortex. PDYN-ir located in the cytosol and proximal processes of NeuN-ir neurons (C) was mainly co-localized with NeuN-ir (D). Minor PDYN-ir was co-localized with GFAP-ir (E) located in astrocyte cell bodies and processes (B). Neuronal PDYN-ir is shown in green, astrocyte PDYN-ir in red, and PDYN-ir not co-existing with GFAP-ir or NeuN-ir in deep blue (F). Lower row shows magnified images of the area outlined in (DF). The majority of PDYN-ir pixels especially those with high intensity are found in neurons. Scale bars, 50 μm (AF); 25 μm (magnified images in the lower row). (G) Levels of RBFOX3 (neuronal marker) and PDYN mRNAs are high in NeuN while those of GFAP (astrocyte marker) in non-NeuN. Bar graphs show average mRNA amount in the NeuN+ and NeuN− fractions as % of total amount of these mRNAs. Nuclei were isolated by FANS from dlPFC of 3 subjects, mRNA analyzed using ddPCR and normalized to total RNA. (H) Diagram depicts CpG positions, short CpG island (CGI) (horizontal bar), and Distal and Proximal regions in 1.42 kb human PDYN promoter. Genome browser shot shows TSSs in human PDYN promoter (FANTOM5 UCSC track, GRCh37/hg19), followed by phastCons track showing conserved elements. (I) Heatmap depicting methylation levels measured by pyrosequencing across PDYN promoter. Clusters of neuronal and non-neuronal DNA are distinguished based on methylation levels. (J) Two neuronal DMRs identified by “bumphunter”. DMR1 (CpGs 1–19) is hypo- while DMR2 (CpGs 24–27) hypermethylated in neurons. The CGI CpGs demonstrate largest and most significant differences among those in DMR1. Average methylation level for 12 subjects and the errors of the means are shown. fwer values for DMRs computed using bootstrap method, as detailed in the “Materials and Methods” section, are indicated. (K) The 5hmC levels are significantly higher in the CGI compared to the Distal or Proximal promoter regions in total tissue DNA analyzed by 5hmC-qAMP assay (n = 21 subjects). (L) A proportion of 5hmC assessed as the (5hmC)/(5hmC + 5mC) ratio in the CGI is significantly higher in neurons compared to glial cells analyzed by 5hmC-qAMP and qAMP assays (n = 12 subjects). The bar graphs show averages and the errors of the means. In box plots, center line is the median, box spans the interquartile range (IQR), and whiskers are 1.5 × IQR from box limits. **P < 0.01, ***P < 0.001. See also Supplementary Figures S1–S3.
Figure 2.
Figure 2.
Central promoter region including the most part of CGI demonstrates high coordination in methylation in neurons, whereas the rest of the promoter in glial cells. (A and B) Heatmap representation of correlations in methylation of 27 CpGs in PDYN promoter in neuronal (A) and glial DNA (B) from dlPFC (n = 12). Scale bar shows the color-coded pairwise Pearson correlation R-values with red and blue indicating high correlations and high anticorrelations, respectively. CGI and DMR2 boundaries are outlined. (C) Heatmap representation of direction and significance of differences between neurons and glia for pairwise Pearson correlations of CpG methylation levels. For each CpG pair in heatmap −log10(P-value) × sign (“cell type” effect) from ANCOVA with the most significant cell type effect (among all regions including this CpG pair, see “Materials and Methods” section) is shown. Purple and yellow colors indicate significantly higher correlations in neurons and glia, respectively. CGI and DMR2 boundaries are outlined.
Figure 3.
Figure 3.
USF2 binds to unmethylated E-box in the PDYN promoter CGI and activates gene transcription. (A) A putative CpG-containing TF binding sites (TF-BSs) in the PDYN promoter CGI identified by TRANSFAC. The CpG 12 is located in E-box sequence (CACGTG). (B and C) Methylation-sensitive DNA-binding factor interacting with the CGI E-box was identified by EMSA in nuclear extract of RFB (B) and human dlPFC (C). Labeled probe: unmethylated (UM) CGI E-box oligonucleotide. Competitors: UM- and methylated (M) CGI E-box oligonucleotides; and wild-type (E-box wt) and mutant (E-box mut) E-box oligonucleotides. Filled arrowhead shows the specific complex. (D and E) The CGI E-box-binding factor is identified as USF2 in RFB (D) and human dlPFC (E) in supershift and depletion experiment with antibodies against c-Myc, Max, Snai 1, USF1, and USF2. IgG, control IgG. Filled and open arrowheads show the specific and supershifted complex. (F) Binding of USF2 ectopically produced in SK-N-MC cells to the CGI E-box is inhibited by E-box methylation or hydroxymethylation. Labeled probes: E-box UM, M, or hydrohymethylated (HM) CGI oligonucleotides. ΔB-USF2, a dominant negative mutant lacking DNA-binding domain. (G and H) Luciferase reporter assays in SK-N-MC cells. Schematics of human PDYN promoter and luciferase reporter constructs are shown. Luc, luciferase coding sequence. Cells were transfected with USF2 (+) or ΔB-USF2 (ΔB) expressing vectors, or mock (−). RLU, relative light units normalized to “renilla” luciferase activity in (G) and to mock in (H). In (H), the unmethylated (UM) or methylated (M) CGI-wt inserted in pCpGL-basic, a CpG-free reporter vector, was transfected. (I) Expression of the endogenous PDYN gene is activated in SK-N-MC cells transfected with USF2- but not with ΔB-USF2-expressing vector, or mock transfected cells. The bar graphs show averages of 3 independent experiments and the errors of the means. *P < 0.05, **P < 0.01, ***P < 0.001.
Figure 4.
Figure 4.
USF2 binds to hypomethylated PDYN promoter in the human dlPFC. (A) Enrichment of USF2 across PDYN promoter. ChIP-qPCR results are shown as levels of DNA immunoprecipitated by anti-USF2 antibodies or control IgG for 9 amplicons. Six tissue samples all of each pooled from three subjects, altogether from 18 subjects were analyzed. Post hoc Tukey HSD-test showed significantly higher binding of USF2 comparing to control IgG (3.9-fold; P < 0.001) to the promoter. Bar graphs show mean ± SEM. (B and C) Methylation of the PDYN promoter E-box CpG 12 associated with USF2 (B) or acetylated histone 3 (H3K9/K14 acetylation, an activatory mark; (C)) was significantly lower compared to that of the total tissue DNA. Methylation was analyzed in DNA immunoprecipitated either with anti-USF2 antibodies or anti-H3-Ac antibodies by qAMP assay using PCR primer Set 7 (see Supplementary Table S3). Six tissue samples all of each pooled from 3 subjects, altogether from 18 subjects were analyzed. Bar graphs show mean ± SEM. **P < 0.01 (t-test). (D) Marker (M) and DNAs digested with increasing amounts of MNAse (1.25, 1.5, 1.75, 2.0, and 2.25 units) on an agarose gel. (E) qPCR analysis of MNAse-digested chromatin from dlPFC. Nucleosome occupancy and inferred positioning are shown. The bar graphs (AC) and data points (E) show averages for 6 samples pooled from 18 subjects and the errors of the means. The lines connecting data points do not imply levels between points. Bent arrow, proximal TSS. *P < 0.05, **P < 0.01, ***P < 0.001. For experimental details, see Supplementary Figure S5.
Figure 5.
Figure 5.
USF2 is positively associated with PDYN mRNA and is co-localized with PDYN in the human dlPFC. (AC) Effect display for the main effect of USF2 mRNA (A, n = 64 subjects of the First cohort; B, n = 31 subjects of the Second cohort) and USF2 protein (C, n = 12 subjects) on PDYN mRNA. 95% confidence band is drawn around the estimated effect. P-values from ANOVAs are indicated. Potentially confounding factors such as age, postmortem interval, tissue pH, RBFOX3, GFAP levels, and alcoholism were included as covariates in the analysis but did not cause any significant effects. (D) Overview of dlPFC laminae immunolabeled for PDYN and USF2 proteins. Note the uniform distribution of the signal abundance and intensity across cortical laminae (shown with roman numerals). (E) A representative image showing PDYN immunoreactivity in neurons of the layer V. Note predominantly cytoplasmic localization of the signal. (F) Visualization of cell nuclei in (E) by hematoxylin staining. (G) A representative image showing USF2 signal in the layer V. Note predominantly nuclear localization of the signal. (H) Visualization of cell nuclei in (F) by toluidine blue staining. (I) Both PDYN and USF2 immunoreactivity are located in the same neurons in the layers III/IV. (J and K) High-magnification images of neurons in the layer V expressing both PDYN and USF2. Scale bars, 100 μm (D); 50 μm (EI); and 25 μm (J and K).
Figure 6.
Figure 6.
Model for integration of epigenetic and transcriptional mechanisms of cell type-specific PDYN expression in the human dlPFC. USF2, the ubiquitous TF expressed at high levels in subpopulation of neurons, activates PDYN transcription through binding to nonmethylated E-box in the short, nucleosome size human promoter-specific CGI in PDYN, which is hypomethylated in neurons. This results in co-localization of USF2 and PDYN proteins. In non-neuronal cells the CGI is hypermethylated that prevents activation of PDYN transcription by USF2, which is also present in these cells albeit at low levels. Methylation levels of DMR2 are opposite to those of the DMR1/CGI both in neurons and glia. This reciprocal pattern may contribute to differential PDYN transcription in neurons and non-neuronal cells; DMR2 may be targeted by a methylation-dependent transcriptional activator in neurons and/or methylation-sensitive transcriptional repressor in non-neuronal cells. Segregation of activating and restricting mechanisms could ensure contrasting PDYN expression in neurons and glia.

References

    1. Allis CD, Jenuwein T. 2016. The molecular hallmarks of epigenetic control. Nat Rev Genet. 17:487–500. - PubMed
    1. Babbitt CC, Silverman JS, Haygood R, Reininga JM, Rockman MV, Wray GA. 2010. Multiple functional variants in cis modulate PDYN expression. Mol Biol Evol. 27:465–479. - PubMed
    1. Bakalkin G, Telkov M, Yakovleva T, Terenius L. 1995. [Leu5]enkephalin-encoding sequences are targets for a specific DNA-binding factor. Proc Natl Acad Sci U S A. 92:9024–9028. - PMC - PubMed
    1. Bakalkin G, Watanabe H, Jezierska J, Depoorter C, Verschuuren-Bemelmans C, Bazov I, Artemenko KA, Yakovleva T, Dooijes D, Van de Warrenburg BPC, et al. 2010. Prodynorphin mutations cause the neurodegenerative disorder Spinocerebellar Ataxia Type 23 (vol 87, pg 593, 2010). Am J Human Genet. 87:736–736. - PMC - PubMed
    1. Bakalkin G, Yakovleva T, Terenius L. 1994. Prodynorphin gene expression relates to NF-kappa B factors. Brain Res Mol Brain Res. 24:301–312. - PubMed

Publication types