

Taste Responses to Linoleic Acid: A Crowdsourced Population Study
- PMID: 28968903
- PMCID: PMC5863569
- DOI: 10.1093/chemse/bjx058
Taste Responses to Linoleic Acid: A Crowdsourced Population Study
Abstract
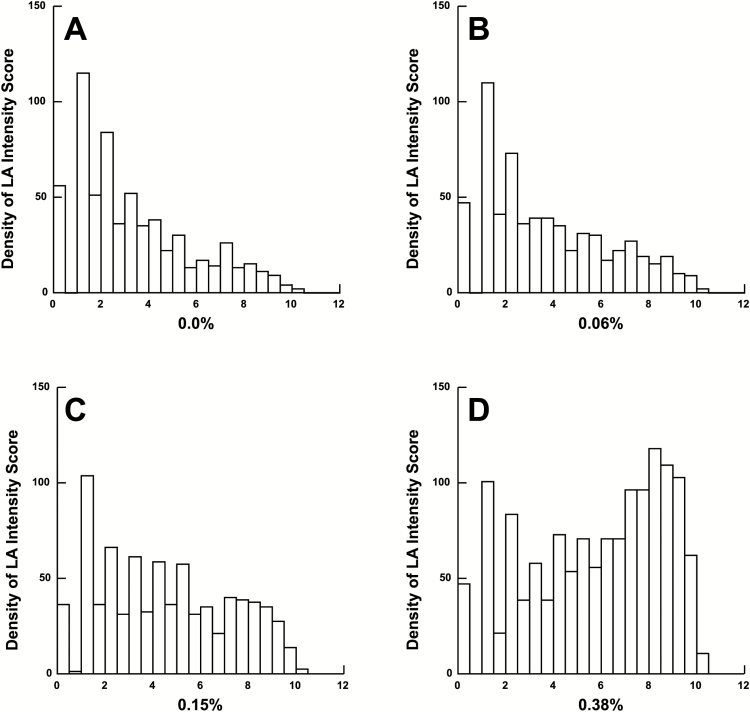
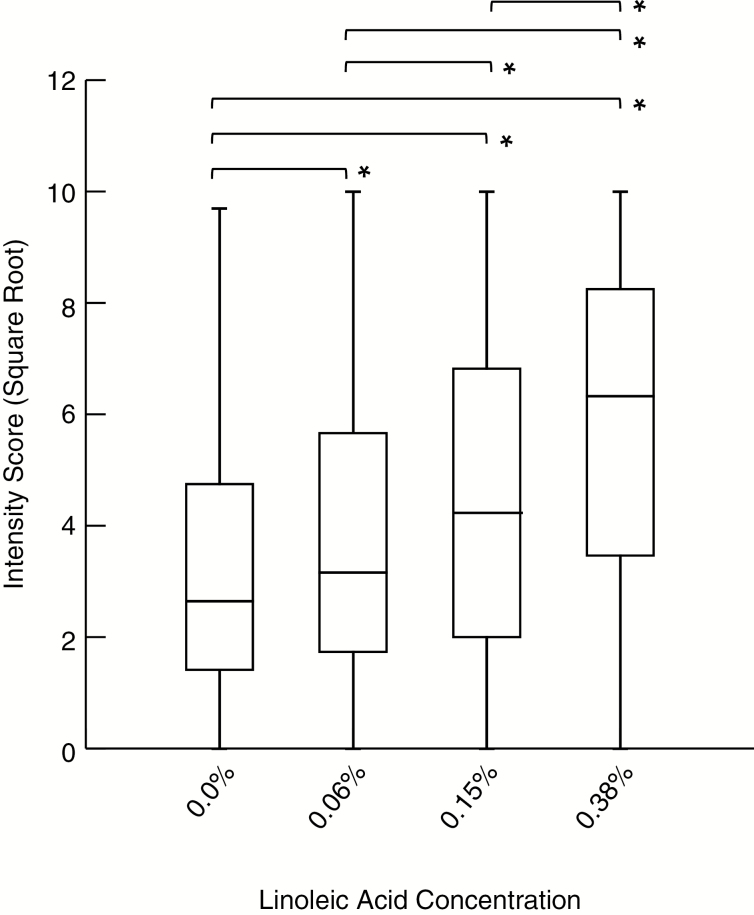
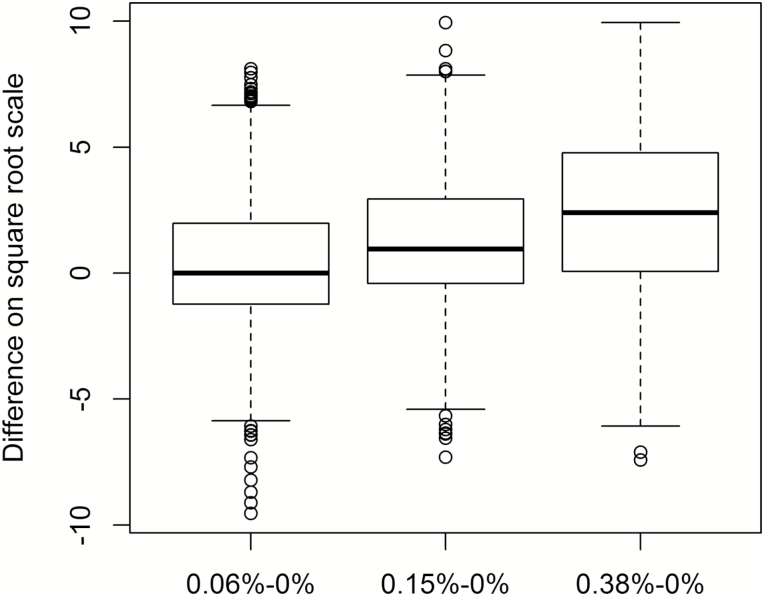
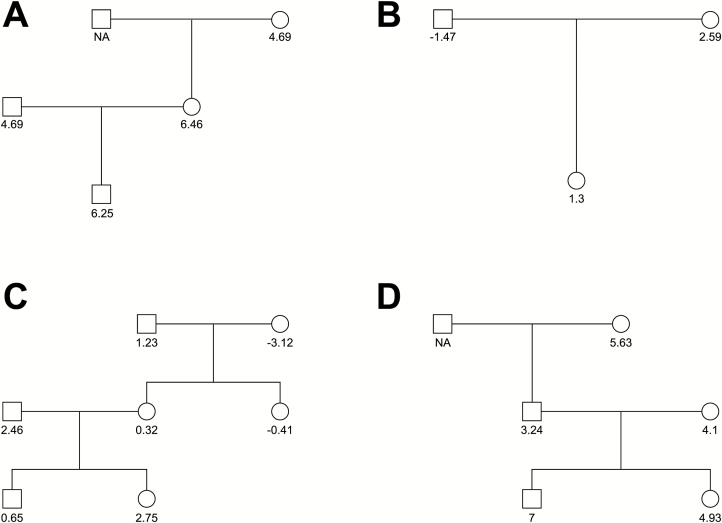
Dietary fats serve multiple essential roles in human health but may also contribute to acute and chronic health complications. Thus, understanding mechanisms that influence fat ingestion are critical. All sensory systems may contribute relevant cues to fat detection, with the most recent evidence supporting a role for the sense of taste. Taste detection thresholds for fat vary markedly between individuals and responses are not normally distributed. Genetics may contribute to these observations. Using crowdsourced data obtained from families visiting the Denver Museum of Nature & Science, our objective was to estimate the heritability of fat taste (oleogustus). A pedigree analysis was conducted with 106 families (643 individuals) who rated the fat taste intensity of graded concentrations of linoleic acid (LA) embedded in taste strips. The findings estimate that 19% (P = 0.043) of the variability of taste response to LA relative to baseline is heritable at the highest concentration tested.
Keywords: citizen science; crowdsourcing; fat taste; heredity estimate; oleogustus.
© The Author 2017. Published by Oxford University Press.
Figures
References
-
- Abdoul-Azize S, Selvakumar S, Sadou H, Besnard P, Khan NA. 2014. Ca2+ signaling in taste bud cells and spontaneous preference for fat: unresolved roles of CD36 and GPR120. Biochimie. 96:8–13. - PubMed
-
- Beauchamp G, Bertino M, Engleman K. 1985. Sensory basis for human salt consumption. In: Horan M, Blaustein M, Dunbar J, Kachadorian T, Kaplan N, Simopoulos A, editors. NIH workshop on nutrition and hypertension proceedings from a symposium; 1984 March 12–14; Bethesda, MD, New York: Biomedical Information Corporation.
-
- Chevrot M, Passilly-Degrace P, Ancel D, Bernard A, Enderli G, Gomes M, Robin I, Issanchou S, Vergès B, Nicklaus S et al. . 2014. Obesity interferes with the orosensory detection of long-chain fatty acids in humans. Am J Clin Nutr. 99:975–983. - PubMed
-
- Damak S, Rong M, Yasumatsu K, Kokrashvili Z, Varadarajan V, Zou S, Jiang P, Ninomiya Y, Margolskee RF. 2003. Detection of sweet and umami taste in the absence of taste receptor T1r3. Science. 301:850–853. - PubMed
MeSH terms
Substances
Grants and funding
LinkOut - more resources
Full Text Sources
Other Literature Sources
