. 2017 May 19;8(38):62962-62975.
doi: 10.18632/oncotarget.18002. eCollection 2017 Sep 8.

BMI-1 is a potential therapeutic target in diffuse intrinsic pontine glioma

Affiliations

BMI-1 is a potential therapeutic target in diffuse intrinsic pontine glioma

Shiva Senthil Kumar et al. Oncotarget. .

Abstract

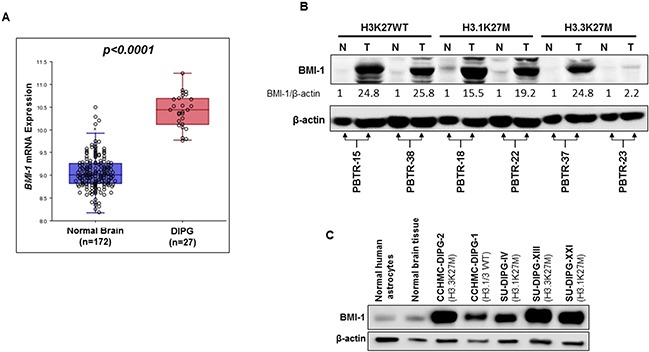
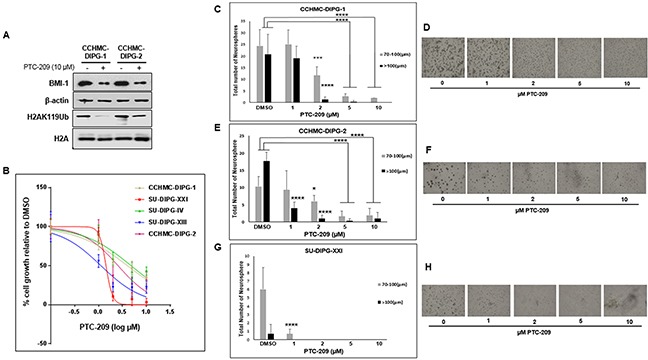
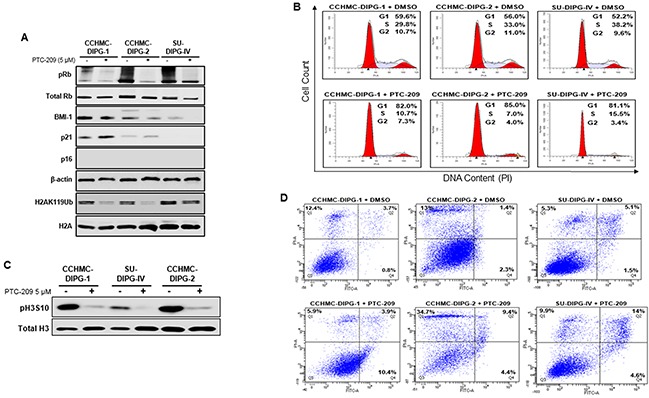
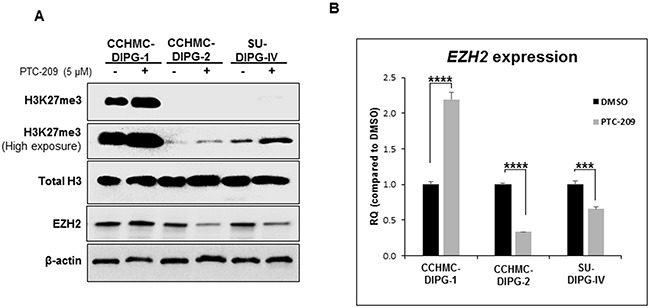
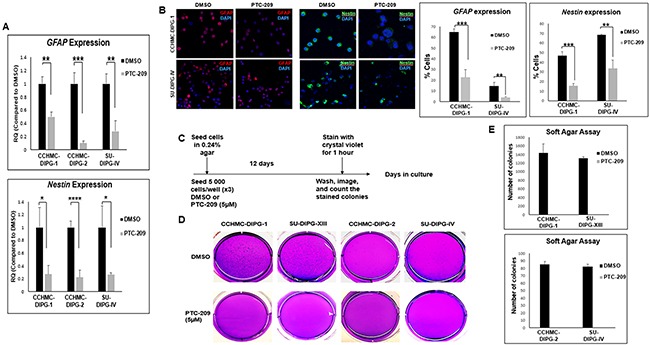
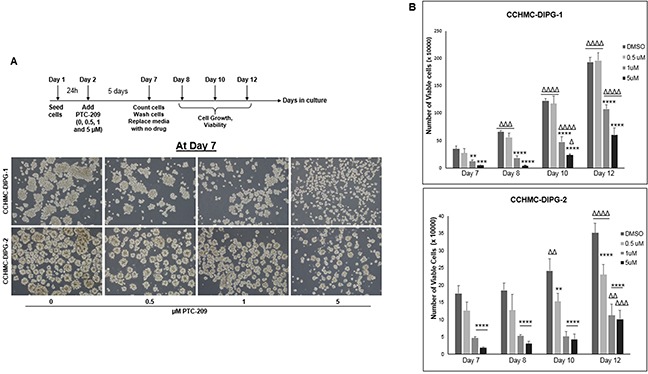
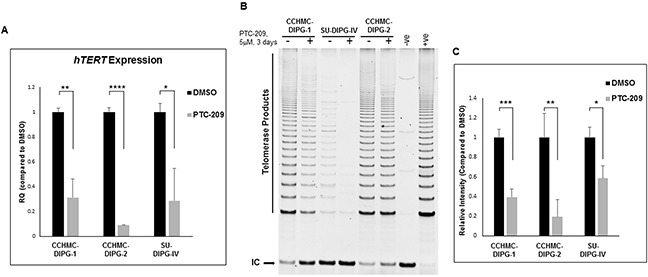
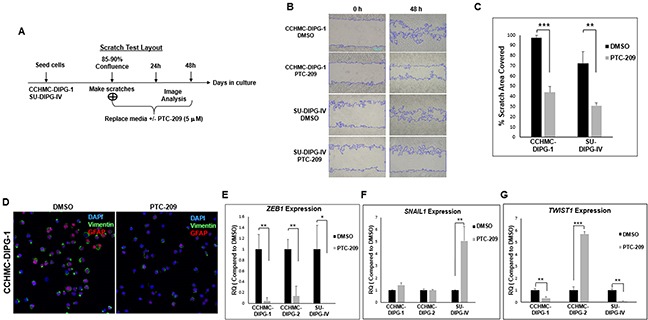
Diffuse intrinsic pontine glioma (DIPG) is a poor-prognosis pediatric brain tumor. No effective curative therapy is currently available and no therapeutic advances have been made in several decades. BMI-1 is a member of the multimeric protein complex Polycomb repressor complex 1. It is highly expressed in a number of diseases and malignancies and has been implicated in self-renewal of normal and cancer cells, and in DNA damage signaling. The role of BMI-1 in DIPG is largely unknown. Here, we show that BMI-1 is highly expressed in tumor tissue samples of DIPG patients and in patient-derived cancer stem-like cells. BMI-1 downregulation leads to the inhibition of DIPG patient-derived neurosphere cell proliferation, cell cycle signaling, self-renewal, telomerase expression and activity, and suppresses DIPG cell migration. Moreover, targeted inhibition of BMI-1 sensitizes DIPG cells to radiomimetic drug-induced DNA damage. Together, our data validate BMI-1 as a potential therapeutic target to treat children with DIPG.

Keywords: BMI-1; DIPG; cancer stem cells; cell proliferation; therapeutic target.


Conflict of interest statement

CONFLICTS OF INTEREST The authors declare no conflict of interest.

Figures

Figure 1
Figure 1. BMI-1 is highly expressed in DIPG tumors and patient-derived primary cell lines regardless of their H3K27M mutation status
(A) In silico analysis of BMI-1 mRNA expression in normal brain- and DIPG tissue. Each circle represents a tissue sample. P value is indicated. (B) Immunoblot analysis of BMI-1 expression in DIPG tumor (T), and matched normal (N) tissue from six DIPG patients. H3K27 mutation status is indicated (WT, wild type). Band intensities were quantified, normalized to β-actin, and are represented as values relative to respective matched normal. (C) Immunoblot analysis of BMI-1 expression in primary DIPG patient-derived neurosphere cell lines. The H3K27 mutation status is indicated. β-actin served as loading control.
Figure 2
Figure 2. PTC-209 reduces BMI-1 levels, PRC1 activity, and inhibits cell growth of DIPG neurospheres
(A) Immunoblot analysis of BMI-1 and H2AK119Ub levels following 72 h treatment with 10 μM PTC-209. β-actin and total H2A served as loading controls. (B) Cell proliferation of DIPG cell lines treated for 72 hours with various concentrations of PTC-209 (DMSO, 1, 2, 5, 10 μM), measured using WST-1 assay and represented as percent (%) cell growth relative to DMSO treatment (control). (C–H) Representative images and quantification of neurosphere size (μm) and number of DIPG neurospheres treated with the indicated concentrations of PTC-209. CCHMC-DIPG-1 (C-D), CCHMC-DIPG-2 (E-F), and SU-DIPG-XXI (G-H). Error bars represent the standard deviation obtained from triplicates. Each experiment was performed at least twice. *, P < 0.05; **, P < 0.01; ***, P < 0.001; ****, P < 0.0001.
Figure 3
Figure 3. BMI-1 downregulation affects RB pathway, induces G1/S cell-cycle arrest and apoptosis in DIPG cells
(A) Immunoblot analysis of pRB, total Rb, BMI-1, p21, p16ink4A and H2AK119Ub extracted from DIPG cell lines treated with DMSO or PTC-209. β-actin and total H2A served as loading controls. (B) Cell cycle analysis of PTC-209 treated DIPG cells. DMSO treatment represents the control. Analysis was performed by gating on live cells only. Percentage of cells in G1, S and G2/M is indicated. (C) Immunoblot analysis of pH3S10, a marker of mitosis. Total H3 served as loading control. (D) Flow-cytometry analyses of PTC-209 or DMSO treated DIPG cells stained with annexin-V and propidium iodide (PI). The percentage of apoptosis (lower far right quadrant) and overall cell death (upper far right quadrant) is indicated. In all experiments, cells were either treated with DMSO or 5 μM PTC-209 for 3 days.
Figure 4
Figure 4. BMI-1 downregulation by PTC-209 leads to an increase in H3K27me3 levels
(A) Immunoblot analysis of H3K27me3 and EZH2 from DIPG cell lines treated for 3 days with 5 μM PTC-209. β-actin and total H3 served as loading controls. (B) EZH2 expression in DIPG cell lines treated for 3 days with 5 μM PTC-209 by qPCR. Error bars represent the standard deviation obtained from triplicates for each condition. Each experiment was performed at least twice. *, P < 0.05; **, P < 0.01; ***, P < 0.001; ****, P < 0.0001.
Figure 5
Figure 5. BMI-1 downregulation by PTC-209 affects stemness properties of DIPG
(A) GFAP and Nestin expression in DIPG cell lines treated for 3 days with 5 μM PTC-209 by qPCR. Error bars represent the standard deviation from two independent experiments performed in triplicates. (B) Representative immunofluorescence images and quantificationsof GFAP (red) and Nestin (green) expression in CCHMC-DIPG-1 and SU-DIPG-IV cells treated for 3 days with 5 μM PTC-209, DAPI (blue). (C–E) Schematic of the soft-agar assay. Representative images and quantifications from soft agar assay comparing the colony forming ability of DIPG cells treated with for 12 days with 5 μM PTC-209. *, P < 0.05; **, P < 0.01; ***, P < 0.001; ****, P < 0.0001.
Figure 6
Figure 6. BMI-1 downregulation by PTC-209 irreversibly impairs the self-renewal capacity of DIPG cells
(A) Schematic of the drug removal experiment and representative images of cells at Day 7 (5 days of continuous treatment). (B) Corresponding plots showing the quantifications of viable cell numbers after removal of PTC-209, at days 8, 10, and 12. Error bars represent the standard deviation from triplicates. *, P < 0.05; **, P < 0.01; ***, P < 0.001; ****, P < 0.0001. Δ, P < 0.05; ΔΔ, P < 0.01; ΔΔΔ, P < 0.001; ΔΔΔΔ, P < 0.0001.* denotes comparison between doses on the same day, Δ denotes comparison between days with the same dose.
Figure 7
Figure 7. PTC-209 treatment decreases hTERT expression and telomerase activity in DIPG cells
(A) hTERT expression in DIPG cells treated for 3 days with 5 μM PTC-209 by qPCR. (B) Telomerase activity in DIPG cells treated for 3 days with 5 μM PTC-209 measured by the TRAP assay. (C) Quantification of the TRAP assay represented as the mean ± S.D from independent experiments. (IC) PCR internal control; (−ve), TRAP negative control; (+ve), TRAP positive control. The intensity of telomerase products (6-bp ladder) and the 36-bp internal control (IC) bands were quantified using Image Studio (LI-COR biosciences). Relative telomerase activity was calculated as the intensity ratio of the TRAP ladder (telomerase products) to that of the PCR internal control. *, P < 0.05; **, P < 0.01; ***, P < 0.001; ****, P < 0.0001.
Figure 8
Figure 8. PTC-209 treatment inhibits the invasive properties of DIPG and downregulates the EMT factors ZEB1 and Vimentin
(A) Experimental design of the scratch assay. (B) Representative images of the scratch assay at 0 and 48 hrs-time points post-treatment. (C) Quantifications of the scratch assay showing the percentage area covered in 48 hrs with after DMSO or PTC-209 treatment. (D) Representative immunofluorescence images GFAP (red) and Vimentin (green) expression in CCHMC-DIPG-1 and SU-DIPG-IV cells after treatment with DMSO 5 μM PTC-209 for 3 days, DAPI (blue). (E–G) ZEB1, SNAIL1 and TWIST1 expression in cells treated with DMSO or 5 μM PTC-209 for 3 days by qPCR. Error bars represent the standard deviation from three independent experiments performed in triplicates. *, P < 0.05; **, P < 0.01; ***, P < 0.001; ****, P < 0.0001.
Figure 9
Figure 9. PTC-209 enhances radiosensitivity of DIPG cells to DNA damage
(A) Immunoblot of CHK1 levels in DIPG patient tumor (T) and matched normal (N) tissue. (B) Immunoblot of CHK1 levels in DIPG cell lines treated for 3 days with 5 μM PTC-209. (C) Experimental design of the PTC-209 and bleocin combination treatment. (D) Cell growth measured by WST-1 assay, and represented as percent (%) of cell growth at 24 hrs compared to 0 h after addition of Bleocin. Error bars represent standard deviation from independent experiments each run in triplicates. *, P < 0.05; **, P < 0.01; ***, P < 0.001; ****, P < 0.0001. Δ, P < 0.05; ΔΔ, P < 0.01; ΔΔΔ, P < 0.001; ΔΔΔΔ, P < 0.0001. $, P < 0.05; $$, P < 0.01; $$$, P < 0.001; $$$$, P < 0.0001. * denotes comparison with DMSO, Δ denotes comparison with PTC-209 and $ denotes comparison with Bleocin.

References

    1. Smith MA, Seibel NL, Altekruse SF, Ries LAG, Melbert DL, O'Leary M, Smith FO, Reaman GH. Outcomes for children and adolescents with cancer: challenges for the twenty-first century. J Clin Oncol. 2010;28:2625–34. doi: 10.1200/JCO.2009.27.0421. - DOI - PMC - PubMed
    1. Bondy ML, Scheurer ME, Malmer B, Barnholtz-Sloan JS, Davis FG, Il'yasova D, Kruchko C, McCarthy BJ, Rajaraman P, Schwartzbaum JA, Sadetzki S, Schlehofer B, Tihan T, et al. Brain tumor epidemiology: consensus from the Brain Tumor Epidemiology Consortium. Cancer. 2008;113:1953–68. doi: 10.1002/cncr.23741. - DOI - PMC - PubMed
    1. Donaldson SS, Laningham F, Fisher PG. Advances toward an understanding of brainstem gliomas. J Clin Oncol. 2006;24:1266–72. doi: 10.1200/JCO.2005.04.6599. - DOI - PubMed
    1. Louis DN, Ohgaki H, Wiestler OD, Cavenee WK, Burger PC, Jouvet A, Scheithauer BW, Kleihues P. The 2007 WHO classification of tumours of the central nervous system. Acta Neuropathol. 2007;114:97–109. doi: 10.1007/s00401-007-0243-4. - DOI - PMC - PubMed
    1. Schwartzentruber J, Korshunov A, Liu XY, Jones DT, Pfaff E, Jacob K, Sturm D, Fontebasso AM, Quang DA, Tönjes M, Hovestadt V, Albrecht S, Kool M, et al. Driver mutations in histone H3.3 and chromatin remodelling genes in paediatric glioblastoma. Nature. 2012;482:226–31. doi: 10.1038/nature10833. - DOI - PubMed

LinkOut - more resources