Multicenter Study
. 2017 Oct 1;140(10):2673-2690.
doi: 10.1093/brain/awx214.

Subarachnoid blood acutely induces spreading depolarizations and early cortical infarction

Affiliations
Multicenter Study

Subarachnoid blood acutely induces spreading depolarizations and early cortical infarction

Jed A Hartings et al. Brain. .

Abstract

See Ghoshal and Claassen (doi:10.1093/brain/awx226) for a scientific commentary on this article. Early cortical infarcts are common in poor-grade patients after aneurysmal subarachnoid haemorrhage. There are no animal models of these lesions and mechanisms are unknown, although mass cortical spreading depolarizations are hypothesized as a requisite mechanism and clinical marker of infarct development. Here we studied acute sequelae of subarachnoid haemorrhage in the gyrencephalic brain of propofol-anaesthetized juvenile swine using subdural electrode strips (electrocorticography) and intraparenchymal neuromonitoring probes. Subarachnoid infusion of 1–2 ml of fresh blood at 200 µl/min over cortical sulci caused clusters of spreading depolarizations (count range: 12–34) in 7/17 animals in the ipsilateral but not contralateral hemisphere in 6 h of monitoring, without meaningful changes in other variables. Spreading depolarization clusters were associated with formation of sulcal clots (P < 0.01), a high likelihood of adjacent cortical infarcts (5/7 versus 2/10, P < 0.06), and upregulation of cyclooxygenase-2 in ipsilateral cortex remote from clots/infarcts. In a second cohort, infusion of 1 ml of clotted blood into a sulcus caused spreading depolarizations in 5/6 animals (count range: 4–20 in 6 h) and persistent thick clots with patchy or extensive infarction of circumscribed cortex in all animals. Infarcts were significantly larger after blood clot infusion compared to mass effect controls using fibrin clots of equal volume. Haematoxylin and eosin staining of infarcts showed well demarcated zones of oedema and hypoxic-ischaemic neuronal injury, consistent with acute infarction. The association of spreading depolarizations with early brain injury was then investigated in 23 patients [14 female; age (median, quartiles): 57 years (47, 63)] after repair of ruptured anterior communicating artery aneurysms by clip ligation (n = 14) or coiling (n = 9). Frontal electrocorticography [duration: 54 h (34, 66)] from subdural electrode strips was analysed over Days 0–3 after initial haemorrhage and magnetic resonance imaging studies were performed at ∼ 24–48 h after aneurysm treatment. Patients with frontal infarcts only and those with frontal infarcts and/or intracerebral haemorrhage were both significantly more likely to have spreading depolarizations (6/7 and 10/12, respectively) than those without frontal brain lesions (1/11, P’s < 0.05). These results suggest that subarachnoid clots in sulci/fissures are sufficient to induce spreading depolarizations and acute infarction in adjacent cortex. We hypothesize that the cellular toxicity and vasoconstrictive effects of depolarizations act in synergy with direct ischaemic effects of haemorrhage as mechanisms of infarct development. Results further validate spreading depolarizations as a clinical marker of early brain injury and establish a clinically relevant model to investigate causal pathologic sequences and potential therapeutic interventions.

Keywords: aneurysmal subarachnoid haemorrhage; brain infarction; cortical spreading depression; electroencephalography; intensive care.


Figures

Figure 1
Figure 1
Swine model of subarachnoid haemorrhage. (A) Illustration of the surgical preparation and subdural electrode strip monitoring. For subarachnoid blood infusion, a large (22 mm) craniotomy was made using a power drill and then a curette and Kerrison punches, abutting the sagittal suture medially and reaching 5 mm anterior to the coronal suture posteriorly. The dura was opened with a no.11 blade scalpel and reflected, taking care to avoid bridging veins. Smaller burr holes 5-mm anterior to the large craniotomy, made using a manual twist drill (8 mm bit) and widened mediolaterally with a Kerrison punch, were used to introduce 6-contact electrode strips. A no.3 Penfield was used to protect the cortex and guide placement in the subdural space. Intraparenchymal blood flow, pressure, temperature, and oxygen sensors were placed through a small burr hole immediately posterior and lateral to the large craniotomy. (B) Illustration depicts the locations of blood injection into two sulci medial and lateral to the motor gyrus. Fresh autologous blood was injected at one or both locations in Cohort 1 animals, while clotted blood was injected into the medial (cruciate) sulcus in Cohort 2 animals. Dorsal view: anterior is down. (C) Photographs of the brain surface through the large craniotomy before (left) and after (right) infusion of 1 ml of fresh blood at each location (yellow stars). The electrode strip was subsequently positioned for continuous monitoring. Anterior is up, medial left. Illustrations by Tonya Hines, printed with permission from Mayfield Clinic.
Figure 2
Figure 2
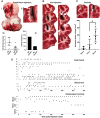
Spreading depolarizations and pathology following subarachnoid haemorrhage in the swine. (A) Cohort 1 experiments using fresh blood. (i) Gross pathology after 6 h showing the persistence and spread of subarachnoid blood through the injected (right) hemisphere, including presence along the Sylvian fissure and ventrolateral surface, as well as surface midline structures of both hemispheres. (ii) TTC-stained coronal section shows subarachnoid clot formation in the cruciate sulcus with infarction (arrows) of the medially adjacent cortex. Infarcted cortex lacks red TTC stain. Scale bar = 5 mm. (iii) Scatter plots of sulcal clot thickness and (iv) infarct incidence for animals with spreading depolarization (SD) clusters (n = 7) and animals with sparse or no spreading depolarizations (n = 10). Bars in iii show median and quartiles. (B) Cohort 2 experiments using clotted blood. Sequential 5-mm TTC-stained coronal sections show sulcal subarachnoid clots and adjacent cortical infarction in two representative animals. In the right image, the cortex is infarcted around the full extent of the clot, including the sulcal depth, and even extends anteriorly (top section) beyond the clot. In the left image infarcts (white arrows) are scattered, less extensive, and discontinuous, though present only adjacent to the clot. (C) Ischaemic lesion volumes following randomization to sulcal injection of saline, fibrin sealant, or clotted blood. Bars show means and standard deviations (*P < 0.05; see text). Upper images of TTC staining from fibrin (left) and blood clot (right) animals demonstrate the similarity of sulcal clot volumes (arrows) between the groups. (D) Raster plots show the timing of individual spreading depolarizations for each animal in Cohort 1 (fresh blood), Cohort 2 (blood clot), and randomized control groups.
Figure 3
Figure 3
Representative cluster of spreading depolarizations in the ipsilateral hemisphere following subarachnoid infusion of fresh blood in the swine brain. Black traces show ECoG recordings from the subdural strip in the hemisphere of blood injection, while grey traces show representative contralateral recordings. Monopolar direct current (DC) recordings show negative DC shifts (slow potential changes), as the signature of spreading depolarization, propagating across the entire ipsilateral hemisphere, while bipolar recordings of high frequency (alternating current, band-pass 0.5–50 Hz) activity show the associated depression periods. Seven spreading depolarizations are observed in this 77-min period (interspreading depolarization interval ∼11 min); a total of 34 were observed in 6 h of monitoring. No spreading depolarizations were observed contralaterally. Other neuromonitoring variables remained within normal ranges throughout the experiment, although brain oxygenation levels decreased slightly in a stepwise manner (arrows) with the passage of each spreading depolarization, reaching 20 mmHg at the time of sacrifice.
Figure 4
Figure 4
Terminal spreading depolarizations following subarachnoid haemorrhage in the swine. Top (black) traces show monopolar direct-current (DC) and bipolar high-frequency (alternating current, band-pass 0.5–50 Hz) ECoG recordings from the hemisphere ipsilateral to subarachnoid blood infusion. Beginning 7 min after SAH, ∼12 spreading depolarizations were observed causing a progressive, cumulative depression of spontaneous brain activity to near isoelectricity. As denoted by grey bars, these spreading depolarizations became prolonged, with negative DC shifts lasting up to 10 min before recovery. The next spreading depolarization, observed spreading at a rate of 1.52 mm/min, was then terminal at Electrodes 2 and 3, as the DC shift did not recover [infinity symbols (∞) denote terminal depolarization], in contrast to recovery after 3 min at Electrode 4. After one further transient spreading depolarization at Electrode 4, however, the next event was terminal at this location. Thus, terminal depolarization developed in this cortical region in a spreading and progressive pattern through successive spreading depolarizations. The animal survived a further 2 h after this sequence until sacrifice. Arrows between DC shifts indicate presumed direction of spreading depolarization propagation between electrodes.
Figure 5
Figure 5
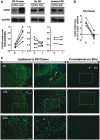
Widespread hemispheric upregulation of COX-2 protein following spreading depolarization clusters. (A) COX-2 protein expression in remote ipsilateral (I) and contralateral (C) cortex in animals with spreading depolarization (SD) clusters (n = 5), isolated spreading depolarizations (n = 5), and no spreading depolarizations (n = 3) in the hemisphere ipsilateral to subarachnoid haemorrhage. PTGS2/COX-2 levels were normalized to their endogenous control GADPH level. (B) COX-2 mRNA levels were measured by quantitative real-time PCR in the same tissue of animals with spreading depolarization clusters (n = 5). (C) Immunofluorescence staining of COX-2 protein level in viable ipsilateral and contralateral cortex 2 cm posterior to site of subarachnoid blood infusion. Strong positive neuronal staining was observed in superficial neuronal layers throughout gyral crests (left) and sulcal depths (middle) in the ipsilateral hemisphere, while no staining was observed on the contralateral side. Counterstaining of cell nuclei with DAPI. Scale bars = 250 (4×), 150 (10×), and 50 (20×) µm.
Figure 6
Figure 6
Histologic sections of cortical ischaemia adjacent to sulcal subarachnoid clots. (A) Zonal oedema (black arrows show borders) of cortex with intraparenchymal haemorrhage (white arrows) adjacent to subarachnoid clot (×40). Zones of ischaemic change were irregularly shaped, extending to involve the full cortical thickness. (B) Acute hypoxic-ischaemic neuronal cell injury (×400) is observed within these zones, as well as the immediately adjacent parenchyma, marked by pericellular vacuolization (black arrows) and neurons with scalloped morphology, pyknotic nuclei, and hyper-eosinophilic cytoplasm (white arrows). (C) Blood within perivascular spaces and extension into the adjacent parenchyma (petechial haemorrhages, white arrows) was seen focally in some cases and more prominently in others (×40). (D) In general, the extension of blood within perivascular (Virchow-Robin) spaces was more prominent within superficial cortex. Perivascular blood was present at least focally in all animals, but was prominent in some. The vessels (v) surrounded by blood (b) were frequently collapsed (×100, arrows and inset), as indicated by the lack of intravascular erythrocytes and lack of distinctive vessel walls. Congestion of the capillaries, microvasculature and small venules were present in the region of oedema. (E) A representative small venule with perivascular blood and collapse superficially (top arrow) with congestion noted in the deeper aspect (bottom arrow; ×100). (F) In nearly all animals, there was moderate to prominent layering of neutrophils (polymorphonuclear leucocytes) within the leptomeninges, with extension into the superficial parenchyma (×200). Occasional arteries also contained neutrophils with margination and, rarely, focal extravasation. No intravascular thrombi were identified.
Figure 7
Figure 7
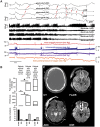
Comparison of spreading depolarizations in patients with and without focal brain lesions. (A) Evolution of spreading depolarizations in a patient with early cortical infarcts (Patient 4 in Table 1, cf. imaging in C) following rupture of an anterior communicating artery aneurysm. Top traces show raw direct current (DC, 0–45 Hz) recordings from four electrodes and middle traces show high frequency activity from the same electrodes (AC, 0.5–45 Hz). In the 7 h of multimodal monitoring shown, the patient displayed 13 spreading depolarizations across the electrode strip. The initial spreading depolarizations had short duration DC shifts and depression periods. Thereafter, recovery from depression periods is only partial at Electrodes 4–6 until spontaneous activity is completely and persistently depressed, i.e. isoelectric. Development of isoelectricity occurs progressively as a consequence of spreading depolarizations, as evidenced by propagating DC shifts (red arrows). Furthermore, prolongation of DC shifts is observed at Electrodes 4 and 5 (grey bars). Seventy-five minutes after the first prolonged DC shift, a persistent negative shift of DC potential (grey bar with arrow) develops in a spreading pattern from electrode 5→4. The propagation rate of this persistent spreading depolarization (pSD; 1.82 mm/min) is similar to the six spreading depolarizations that precede it (2.37 ± 0.88 mm/min). After a further 25 min, persistent depolarization then develops at Electrode 6; the event follows spreading depolarization on Electrode 1 with the same time delay as the prior spreading depolarization (vertical dashed lines), suggesting that it is also a spreading event. Throughout this course, spreading depolarizations were coupled to transient decreases in PbtO2 as well as a stepwise cumulative decrease in baseline oxygenation from 21 to <5 mmHg. Large amplitude negative ultraslow potentials developed following persistent spreading depolarization at Electrodes 4–6 and returned to baseline levels after 2–3 h. (B, bottom) Only 1 of 11 patients without focal brain pathology showed a single spreading depolarization during Days 0–3 after the initial haemorrhage while the remaining 10 patients had no spreading depolarizations. By contrast, all but one patient with an early infarct and all but one patient with an initial ICH showed spreading depolarizations. Results were quantified by comparing the peak number of spreading depolarizations/day (top) and depression durations (PTDDD; middle). (C) Representative MRI on Day 2 of a patient with early infarct but not ICH. The CT displays the location of the electrode strip. DWI shows early band-like infarcts (hyperintensities) of the cortex and underlying white matter in the medial frontal area bilaterally (anterior cerebral artery territories), close to the ruptured anterior communicating artery aneurysm, as well as distant band-like infarcts in the left middle cerebral artery territory where the electrode strip was located. The fluid attenuated inversion recovery (FLAIR) image shows hyperintensities in these areas and the apparent diffusion coefficient (ADC) map shows hypointensities.

Comment in

Similar articles

Cited by

References

    1. Ayata C, Lauritzen M. Spreading depression, spreading depolarizations, and the cerebral vasculature. Physiol Rev 2015; 95: 953–93. - PMC - PubMed
    1. Baechli H, Behzad M, Schreckenberger M, Buchholz HG, Heimann A, Kempski O, et al.Blood constituents trigger brain swelling, tissue death, and reduction of glucose metabolism early after acute subdural hematoma in rats. J Cereb Blood Flow Metab 2010; 30: 576–85. - PMC - PubMed
    1. Bosche B, Graf R, Ernestus RI, Dohmen C, Reithmeier T, Brinker G, et al.Recurrent spreading depolarizations after subarachnoid hemorrhage decreases oxygen availability in human cerebral cortex. Ann Neurol 2010; 67: 607–17. - PMC - PubMed
    1. Bretz JS, von Dincklage F, Woitzik J, Winkler MK, Major S, Dreier JP, et al.The Hijdra scale has a significant prognostic value for the functional outcome of Fisher grade 3 patients with subarachnoid hemorrhage. Clin Neuroradiol 2016. [Epub ahead of print]. doi: 10.1007/s00062-016-0509-0. - PubMed
    1. Broderick JP, Brott TG, Duldner JE, Tomsick T, Leach A. Initial and recurrent bleeding are the major causes of death following subarachnoid hemorrhage. Stroke 1994; 25: 1342–7. - PubMed

Publication types