Review
. 2017;23(38):5964-5970.
doi: 10.2174/1381612823666171002114545.

IGF-1 as a Drug for Preterm Infants: A Step-Wise Clinical Development

Affiliations
Review

IGF-1 as a Drug for Preterm Infants: A Step-Wise Clinical Development

Ann Hellstrom et al. Curr Pharm Des. 2017.

Abstract

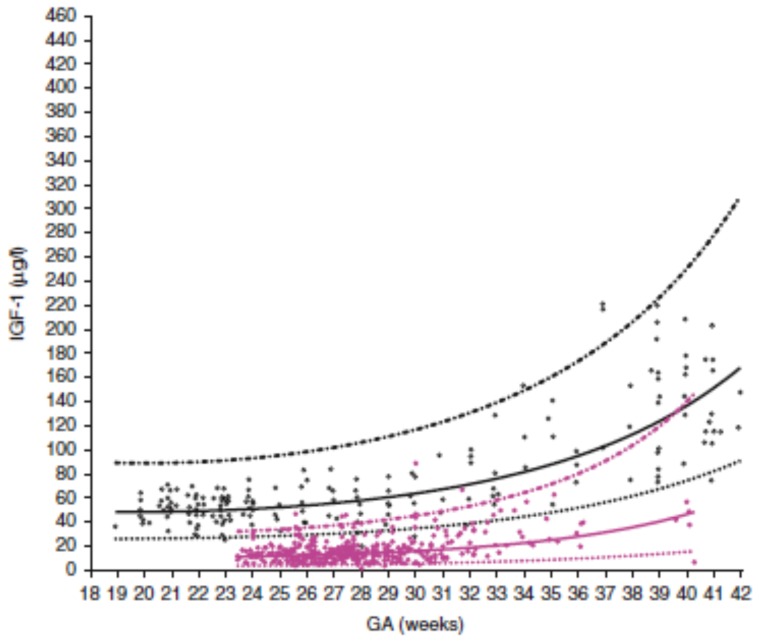
Background: Insulin-like growth factor 1 (IGF-1) is a mitogenic hormone involved in many processes such as growth, metabolism, angiogenesis and differentiation. After very preterm birth, energy demands increase while maternal supplies of nutrients and other factors are lost and the infant may become dependent on parenteral nutrition for weeks. Low postnatal IGF-1 concentrations in preterm infants are associated with poor weight gain, retinopathy of prematurity (ROP) and other morbidities. We will describe the process by which we aim to develop supplementation with recombinant human (rh) IGF-1 and its binding protein rhIGFBP-3 as a possible therapy to promote growth and maturation and reduce morbidities in extremely preterm infants.

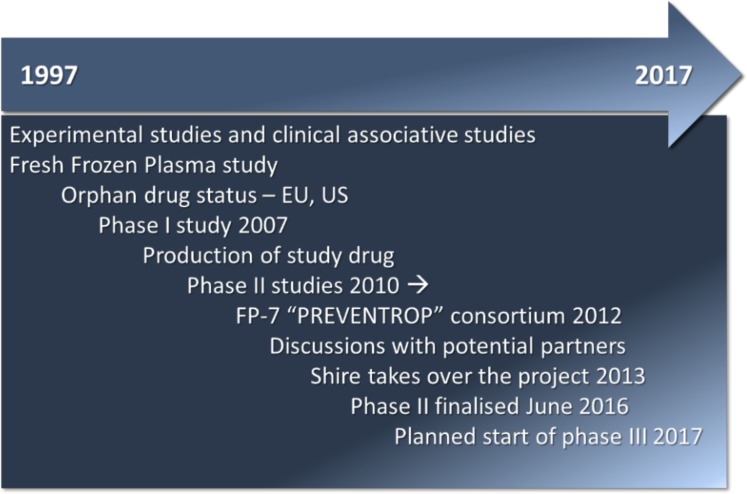
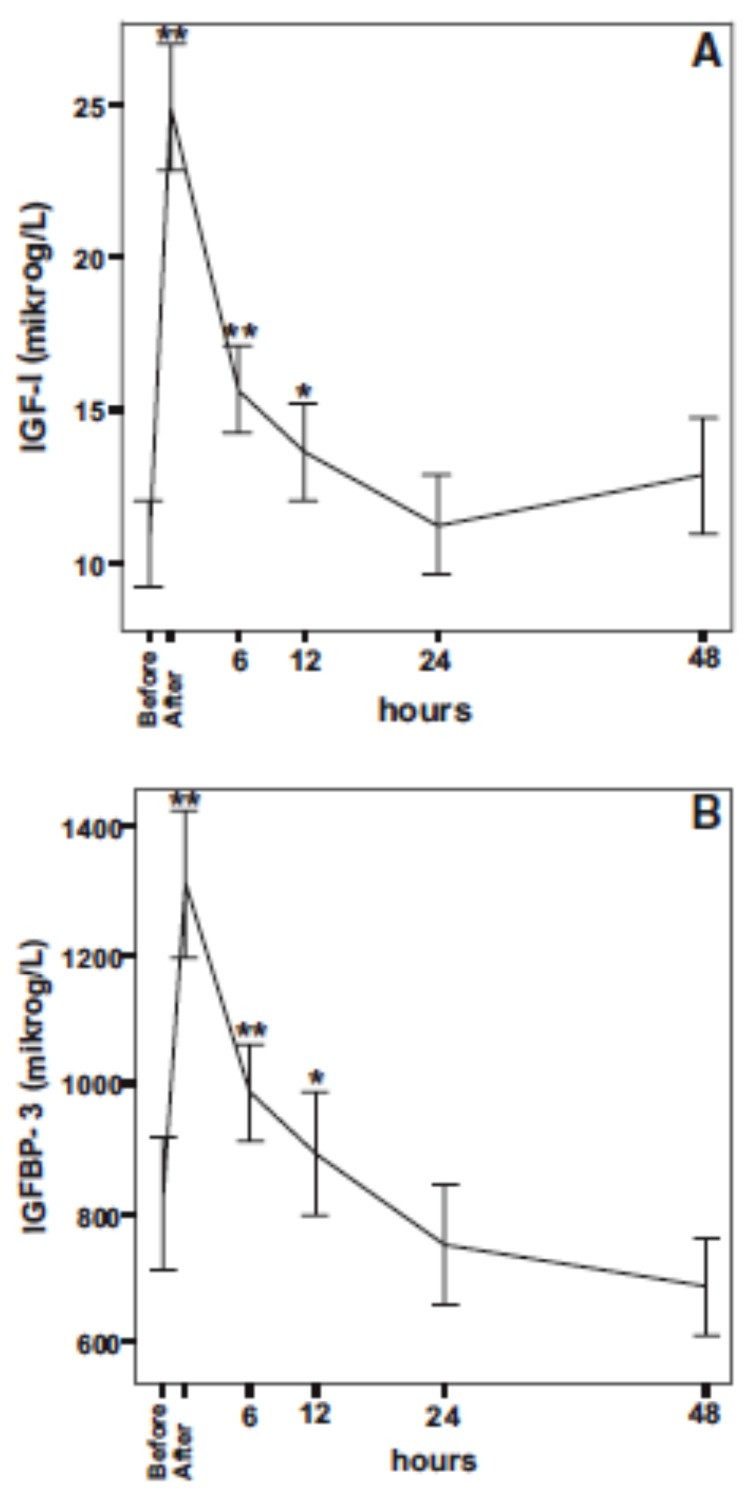
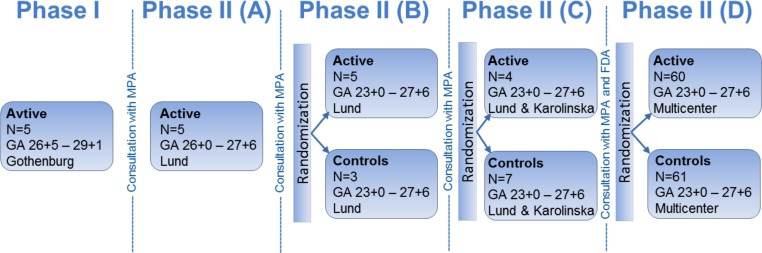
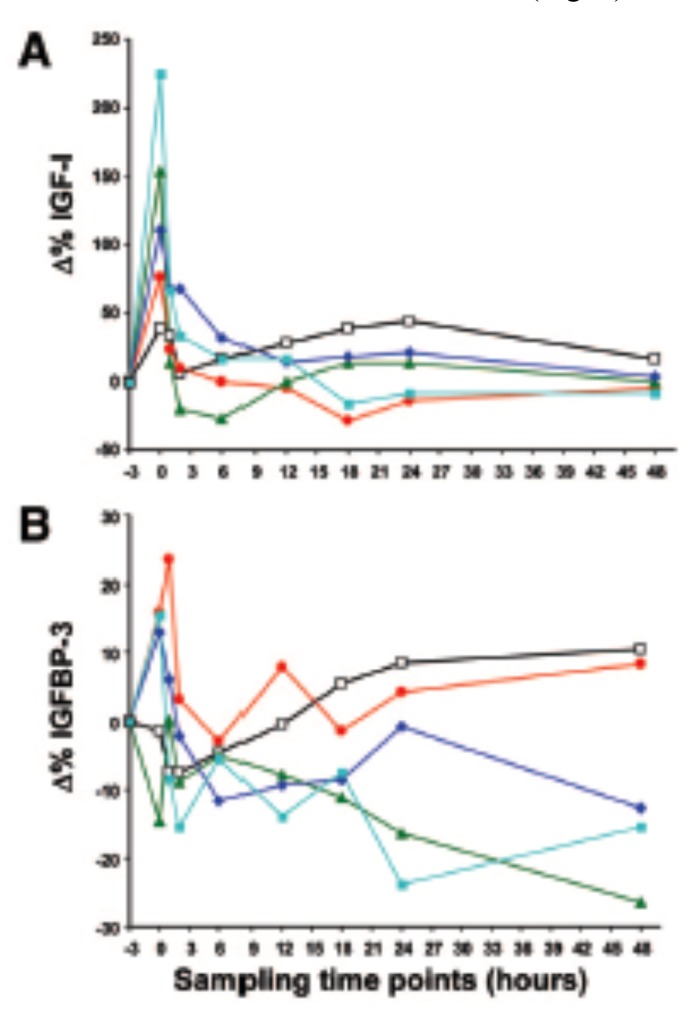
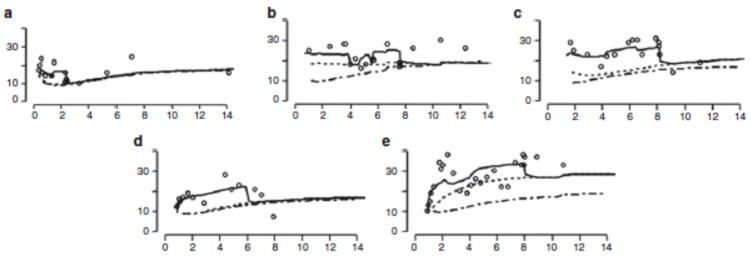
Methods: In order to calculate a dose of IGF-1 tolerated by neonates, a pharmacokinetic study of transfusion with fresh frozen plasma was performed, which provided a relatively low dose of IGF-1, (on average 1.4 µg/kg), that increased serum IGF-1 to levels close to those observed in fetuses and preterm infants of similar GAs. Thereafter, a Phase I 3 hours IV infusion of rhIGF-1/rhIGFBP-3 was conducted in 5 infants, followed by a Phase II study with four sections (A-D). In the Phase II, sections A-D studies, time on infusion increased and younger gestational ages were included.

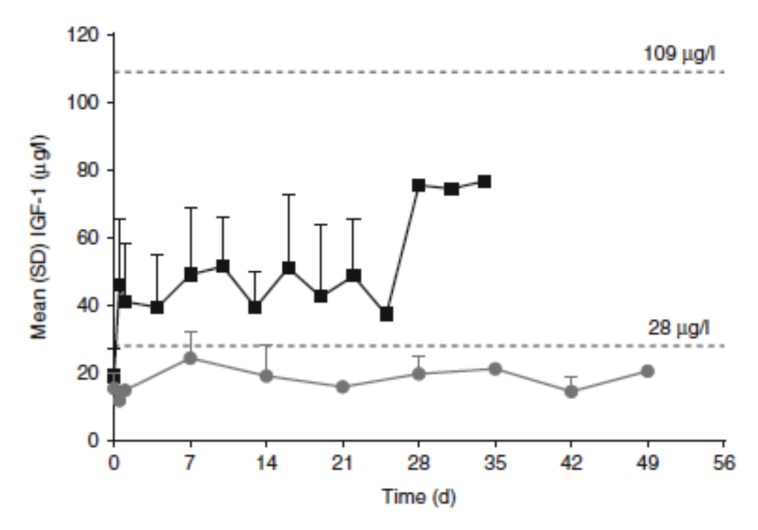
Results: IV infusion increased IGF-1 but with short half-life (0.5h) implying a need for continuous infusion. In order to obtain in utero levels of IGF-I, the dose was increased from 100 to 250 µg/kg/24 h and the infusion was prolonged from 3 weeks postnatal age until a postmenstrual age of 29 weeks and 6 days.

Conclusion: The purpose has been to ensure high-quality research into the development of a new drug for preterm infants. We hope that our work will help to establish a new standard for the testing of medications for preterm infants.

Keywords: IGF-1; Preterm infant; drug development; pharmacokinetic; preterm morbidity..


Figures

Fig. (1)
Fig. (1)
Intrauterine and preterm infant serum IGF-1 levels. Open black circles represent IGF-1 in normal in utero fetuses. Closed pink circles represent IGF-1 in preterm infants. Solid black line represents mean predicted physiological levels of corresponding intrauterine levels (n=174). Solid pink line represents mean predictive values of preterm infants (n=137). Dashed black line represents upper prediction interval (95th). From Hellström et al. [3] Insulin-like growth factor 1 has multisystem effects on foetal and preterm infant development. Copyright ©2016 Acta Pediatrica, reproduced with permission. (The color version of the figure is available in the electronic copy of the article).
Fig. (2)
Fig. (2)
Timeline of drug development in a neonatal clinical setting.
Fig. (3)
Fig. (3)
Mean concentrations of IGF-I (A) and IGFBP-3 (B) before (n=20) and at 6 (n=19), 12 (n=19), 24 (n=16) and 48h (n=14) after FFP. Error bars show ±1 SEM. *, P<0.05 and **, P<0.01 denote significant differences compared with levels before transfusion of FFP. Copyright ©JCEM, reproduced with permission.
Fig. (4)
Fig. (4)
Illustration of step-wise clinical phase I-II development of IGF-I as a drug for preterm infants.
Fig. (5)
Fig. (5)
A. Δ% IGF-I from baseline after 3h infusion of IGF-I/IGFBP-3 in different doses (n=5) in five study subjects. Sampling time points are immediately before study drug infusion (-3), immediately following completed infusion of drug (0), and at 1, 2, 6, 12, 18, 24 and 48 hours post completed drug infusion. Number 1 (BW 880g; 6 µg/kg): unfilled boxes and black line, 2 (BW 1 220g; 24 µg/kg): red filled circle and red line, 3 (BW 760g; 33 µg/kg): green filled triangles and green line, 4 (BW 1 115 g; 33 µg/kg): dark blue rhomb and dark blue line, 5 (BW 810g; 59 µg/kg): light blue filled boxes and light blue line. B. Δ% IGFBP-3 from baseline after 3h infusion of IGF-I/IGFBP-3 in different doses (n=5) in five study subjects. Sampling time points are immediately before study drug infusion (-3), immediately following completed infusion of drug (0), and at 1, 2, 6, 12, 18, 24 and 48 hours post completed drug infusion. One (880g; 6 µg/kg): unfilled boxes and black line, 2 (1 220g; 24 µg/kg): red filled circle and red line, 3 (760g; 33 µg/kg): green filled triangles and green line, 4 (1 115 g; 33 µg/kg): dark blue rhomb and dark blue line, #5 (810g; 59 µg/kg): light blue filled boxes and light blue line. Copyright ©Pediatric Research, reproduced with permission. (The color version of the figure is available in the electronic copy of the article).
Fig. (6)
Fig. (6)
Observed and model-predicted serum IGF-I concentrations, in relation to postnatal age, in five very preterm children, chronological age (days) on the x-axis and serum IGF-I levels (µg/L) on the y-axis. (a) patient 1; (b) patient 2; (c) patient 3; (d) patient 4; (e); patient 5. All the infants received continuous intravenous infusions of rhIGF-I/rhIGFBP-3. Population predicted endogenous concentrations are shown for an untreated typical child with the same body weight as that of the treated subject. The individual predictions consider unexplained inter-individual differences. The individual total predictions show the best model to fit the observed data and the administered doses of rhIGF-I/rhIGFBP-3. The observed values are depicted as circles, the individual predicted endogenous serum IGF-I concentrations as a dotted line, the population predicted endogenous serum IGF-I concentrations as a broken line and the individual predicted total serum IGF-I as a solid line. Copyright ©Pediatric Research, reproduced with permission.
Fig. (7)
Fig. (7)
Serum IGF-1 profile (mean [SD]; treated vs. control infants). Note: IGF-1 levels from treated infants on days 28, 31, and 34 were from 1 patient only, and therefore should be interpreted with caution. Closed black squares represent rhIGF-1/rhIGFBP-3 treated infants (n=10). Closed grey circles represent control infants (n=9). Copyright ©Pediatric Research, reproduced with permission.

References

    1. Hwa V.F.P., Derr M.A., Fiegerlova E., Rosenfeld R.G. 2013. - PubMed
    1. D’Ercole A.J., Ye P. Expanding the mind: insulin-like growth factor I and brain development. Endocrinology. 2008;149(12):5958–5962. - PMC - PubMed
    1. Hellstrom A., Ley D., Hansen-Pupp I., et al. Insulin-like growth factor 1 has multisystem effects on foetal and preterm infant development. Acta Paediatr. 2016;105(6):576–586. - PMC - PubMed
    1. LeRoith D., Yakar S. Mechanisms of disease: metabolic effects of growth hormone and insulin-like growth factor 1. Nat. Clin. Pract. Endocrinol. Metab. 2007;3(3):302–310. - PubMed
    1. Hellstrom A., Engstrom E., Hard A.L., et al. Postnatal serum insulin-like growth factor I deficiency is associated with retinopathy of prematurity and other complications of premature birth. Pediatrics. 2003;112(5):1016–1020. - PubMed

Publication types

MeSH terms

Substances