MetaComp: comprehensive analysis software for comparative meta-omics including comparative metagenomics
- PMID: 28969605
- PMCID: PMC5625784
- DOI: 10.1186/s12859-017-1849-8
MetaComp: comprehensive analysis software for comparative meta-omics including comparative metagenomics
Abstract
Background: During the past decade, the development of high throughput nucleic sequencing and mass spectrometry analysis techniques have enabled the characterization of microbial communities through metagenomics, metatranscriptomics, metaproteomics and metabolomics data. To reveal the diversity of microbial communities and interactions between living conditions and microbes, it is necessary to introduce comparative analysis based upon integration of all four types of data mentioned above. Comparative meta-omics, especially comparative metageomics, has been established as a routine process to highlight the significant differences in taxon composition and functional gene abundance among microbiota samples. Meanwhile, biologists are increasingly concerning about the correlations between meta-omics features and environmental factors, which may further decipher the adaptation strategy of a microbial community.
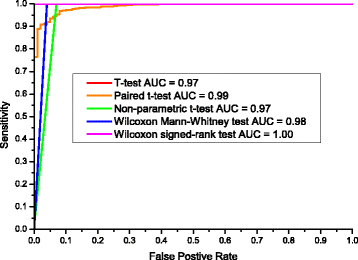
Results: We developed a graphical comprehensive analysis software named MetaComp comprising a series of statistical analysis approaches with visualized results for metagenomics and other meta-omics data comparison. This software is capable to read files generated by a variety of upstream programs. After data loading, analyses such as multivariate statistics, hypothesis testing of two-sample, multi-sample as well as two-group sample and a novel function-regression analysis of environmental factors are offered. Here, regression analysis regards meta-omic features as independent variable and environmental factors as dependent variables. Moreover, MetaComp is capable to automatically choose an appropriate two-group sample test based upon the traits of input abundance profiles. We further evaluate the performance of its choice, and exhibit applications for metagenomics, metaproteomics and metabolomics samples.
Conclusion: MetaComp, an integrative software capable for applying to all meta-omics data, originally distills the influence of living environment on microbial community by regression analysis. Moreover, since the automatically chosen two-group sample test is verified to be outperformed, MetaComp is friendly to users without adequate statistical training. These improvements are aiming to overcome the new challenges under big data era for all meta-omics data. MetaComp is available at: http://cqb.pku.edu.cn/ZhuLab/MetaComp/ and https://github.com/pzhaipku/MetaComp/ .
Keywords: Comparative meta-omics; Comparative metagenomics; Graphical user interface; Statistical analysis; Visualization.
Conflict of interest statement
Ethics approval and consent to participate
Not applicable.
Consent for publication
Not applicable.
Competing interests
The authors declare that they have no competing interests.
Publisher’s Note
Springer Nature remains neutral with regard to jurisdictional claims in published maps and institutional affiliations.
Figures


Similar articles
-
gNOMO2: a comprehensive and modular pipeline for integrated multi-omics analyses of microbiomes.Gigascience. 2024 Jan 2;13:giae038. doi: 10.1093/gigascience/giae038. Gigascience. 2024. PMID: 38995144 Free PMC article.
-
MOSCA 2.0: A bioinformatics framework for metagenomics, metatranscriptomics and metaproteomics data analysis and visualization.Mol Ecol Resour. 2024 Oct;24(7):e13996. doi: 10.1111/1755-0998.13996. Epub 2024 Aug 4. Mol Ecol Resour. 2024. PMID: 39099161
-
Sequencing and beyond: integrating molecular 'omics' for microbial community profiling.Nat Rev Microbiol. 2015 Jun;13(6):360-72. doi: 10.1038/nrmicro3451. Epub 2015 Apr 27. Nat Rev Microbiol. 2015. PMID: 25915636 Free PMC article. Review.
-
Advancing functional and translational microbiome research using meta-omics approaches.Microbiome. 2019 Dec 6;7(1):154. doi: 10.1186/s40168-019-0767-6. Microbiome. 2019. PMID: 31810497 Free PMC article. Review.
-
ivTerm-An R package for interactive visualization of functional analysis results of meta-omics data.J Cell Biochem. 2021 Oct;122(10):1428-1434. doi: 10.1002/jcb.30019. Epub 2021 Jun 16. J Cell Biochem. 2021. PMID: 34132422
Cited by
-
WHAM!: a web-based visualization suite for user-defined analysis of metagenomic shotgun sequencing data.BMC Genomics. 2018 Jun 25;19(1):493. doi: 10.1186/s12864-018-4870-z. BMC Genomics. 2018. PMID: 29940835 Free PMC article.
-
MicrobiomeStatPlots: Microbiome statistics plotting gallery for meta-omics and bioinformatics.Imeta. 2025 Feb 17;4(1):e70002. doi: 10.1002/imt2.70002. eCollection 2025 Feb. Imeta. 2025. PMID: 40027478 Free PMC article.
-
Identification of key genes and its chromosome regions linked to drought responses in leaves across different crops through meta-analysis of RNA-Seq data.BMC Plant Biol. 2019 May 10;19(1):194. doi: 10.1186/s12870-019-1794-y. BMC Plant Biol. 2019. PMID: 31077147 Free PMC article.
-
More Positive or More Negative? Metagenomic Analysis Reveals Roles of Virome in Human Disease-Related Gut Microbiome.Front Cell Infect Microbiol. 2022 Apr 12;12:846063. doi: 10.3389/fcimb.2022.846063. eCollection 2022. Front Cell Infect Microbiol. 2022. PMID: 35493727 Free PMC article.
-
Wekemo Bioincloud: A user-friendly platform for meta-omics data analyses.Imeta. 2024 Feb 13;3(1):e175. doi: 10.1002/imt2.175. eCollection 2024 Feb. Imeta. 2024. PMID: 38868508 Free PMC article.
References
-
- White III RA, Callister SJ, Moore RJ, Baker ES, Jansson JK. The past, present and future of microbiome analyses. Nat Protoc. 2016;11(11):2049–53. doi: 10.1038/nprot.2016.148. - DOI
-
- Raman M, Ahmed I, Gillevet PM, Probert CS, Ratcliffe NM, Smith S, Greenwood R, Sikaroodi M, Lam V, Crotty P, et al. Fecal microbiome and volatile organic compound metabolome in obese humans with nonalcoholic fatty liver disease. Clin Gastroenterol Hepatol. 2013;11(7):868–75. doi: 10.1016/j.cgh.2013.02.015. - DOI - PubMed
MeSH terms
LinkOut - more resources
Full Text Sources
Other Literature Sources
Molecular Biology Databases
Miscellaneous

