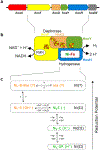
Enzymatic and spectroscopic properties of a thermostable [NiFe]‑hydrogenase performing H2-driven NAD+-reduction in the presence of O2
- PMID: 28970007
- PMCID: PMC7187929
- DOI: 10.1016/j.bbabio.2017.09.006
Enzymatic and spectroscopic properties of a thermostable [NiFe]‑hydrogenase performing H2-driven NAD+-reduction in the presence of O2
Abstract
Biocatalysts that mediate the H2-dependent reduction of NAD+ to NADH are attractive from both a fundamental and applied perspective. Here we present the first biochemical and spectroscopic characterization of an NAD+-reducing [NiFe]‑hydrogenase that sustains catalytic activity at high temperatures and in the presence of O2, which usually acts as an inhibitor. We isolated and sequenced the four structural genes, hoxFUYH, encoding the soluble NAD+-reducing [NiFe]‑hydrogenase (SH) from the thermophilic betaproteobacterium, Hydrogenophilus thermoluteolus TH-1T (Ht). The HtSH was recombinantly overproduced in a hydrogenase-free mutant of the well-studied, H2-oxidizing betaproteobacterium Ralstonia eutropha H16 (Re). The enzyme was purified and characterized with various biochemical and spectroscopic techniques. Highest H2-mediated NAD+ reduction activity was observed at 80°C and pH6.5, and catalytic activity was found to be sustained at low O2 concentrations. Infrared spectroscopic analyses revealed a spectral pattern for as-isolated HtSH that is remarkably different from those of the closely related ReSH and other [NiFe]‑hydrogenases. This indicates an unusual configuration of the oxidized catalytic center in HtSH. Complementary electron paramagnetic resonance spectroscopic analyses revealed spectral signatures similar to related NAD+-reducing [NiFe]‑hydrogenases. This study lays the groundwork for structural and functional analyses of the HtSH as well as application of this enzyme for H2-driven cofactor recycling under oxic conditions at elevated temperatures.
Keywords: Biotechnology; Cofactor recycling; Electron paramagnetic resonance spectroscopy; Enzyme kinetics; Flavin; Hydrogen; Hydrogenase; Infrared vibrational spectroscopy; Iron; Iron‑sulfur cluster; Nickel; Nuclear resonance vibrational spectroscopy; Oxyhydrogen reaction; Pyridine nucleotide; Respiratory Complex I.
Copyright © 2017 Elsevier B.V. All rights reserved.
Figures


Similar articles
-
Impact of the iron-sulfur cluster proximal to the active site on the catalytic function of an O2-tolerant NAD(+)-reducing [NiFe]-hydrogenase.Biochemistry. 2015 Jan 20;54(2):389-403. doi: 10.1021/bi501347u. Epub 2015 Jan 7. Biochemistry. 2015. PMID: 25517969
-
Catalytic production of hydrogen peroxide and water by oxygen-tolerant [NiFe]-hydrogenase during H2 cycling in the presence of O2.J Am Chem Soc. 2013 Nov 27;135(47):17897-905. doi: 10.1021/ja408420d. Epub 2013 Nov 15. J Am Chem Soc. 2013. PMID: 24180286
-
Expression of a functional NAD-reducing [NiFe] hydrogenase from the gram-positive Rhodococcus opacus in the gram-negative Ralstonia eutropha.Arch Microbiol. 2002 Feb;177(2):159-66. doi: 10.1007/s00203-001-0371-5. Epub 2001 Nov 20. Arch Microbiol. 2002. PMID: 11807565
-
NAD(H)-coupled hydrogen cycling - structure-function relationships of bidirectional [NiFe] hydrogenases.FEBS Lett. 2012 Mar 9;586(5):545-56. doi: 10.1016/j.febslet.2011.10.010. Epub 2011 Nov 2. FEBS Lett. 2012. PMID: 22056977 Review.
-
H2 conversion in the presence of O2 as performed by the membrane-bound [NiFe]-hydrogenase of Ralstonia eutropha.Chemphyschem. 2010 Apr 26;11(6):1107-19. doi: 10.1002/cphc.200901002. Chemphyschem. 2010. PMID: 20186906 Review.
Cited by
-
Extremophilic Oxidoreductases for the Industry: Five Successful Examples With Promising Projections.Front Bioeng Biotechnol. 2021 Aug 12;9:710035. doi: 10.3389/fbioe.2021.710035. eCollection 2021. Front Bioeng Biotechnol. 2021. PMID: 34458243 Free PMC article. Review.
-
Hydroxy-bridged resting states of a [NiFe]-hydrogenase unraveled by cryogenic vibrational spectroscopy and DFT computations.Chem Sci. 2020 Dec 11;12(6):2189-2197. doi: 10.1039/d0sc05022a. Chem Sci. 2020. PMID: 34163984 Free PMC article.
-
Outer-sphere effects on the O2 sensitivity, catalytic bias and catalytic reversibility of hydrogenases.Chem Sci. 2024 Mar 15;15(15):5418-5433. doi: 10.1039/d4sc00691g. eCollection 2024 Apr 17. Chem Sci. 2024. PMID: 38638217 Free PMC article. Review.
-
Metal-ligand cooperativity in the soluble hydrogenase-1 from Pyrococcus furiosus.Chem Sci. 2020 Jul 30;11(32):8572-8581. doi: 10.1039/d0sc00628a. Chem Sci. 2020. PMID: 34123117 Free PMC article.
-
Development of a Universal Platform for the Heterologous Expression of Bidirectional [Ni-Fe]-Hydrogenases in E. coli.ACS Synth Biol. 2025 Jul 18;14(7):2710-2717. doi: 10.1021/acssynbio.5c00150. Epub 2025 Jun 16. ACS Synth Biol. 2025. PMID: 40521690 Free PMC article.
References
-
- Vignais PM, Billoud B, Occurrence, classification, and biological function of hydrogenases: an overview, Chem. Rev 107 (2007) 4206–4272. - PubMed
-
- Schwartz E, Fritsch J, Friedrich B, H2-Metabolizing Prokaryotes, in: Rosenberg E, DeLong EF, Lory S, Stackebrandt E, Thompson F (Eds.), The Prokaryotes, Springer Berlin Heidelberg, Berlin, Heidelberg, 2013, pp. 119–199.
-
- Lubitz W, Ogata H, Rüdiger O, Reijerse E, Hydrogenases, Chem. Rev 114 (2014) 4081–4148. - PubMed
-
- Fritsch J, Lenz O, Friedrich B, Structure, function and biosynthesis of O₂-tolerant hydrogenases, Nat. Rev. Microbiol 11 (2013) 106–114. - PubMed
-
- Lenz O, Lauterbach L, Frielingsdorf S, Friedrich B, Oxygen-tolerant hydrogenases and their biotechnological potential, in: Rögner M (Ed.), Biohydrogen, De Gruyter, 2015, pp. 61–88.
Publication types
MeSH terms
Substances
Grants and funding
LinkOut - more resources
Full Text Sources
Other Literature Sources
Molecular Biology Databases

