. 2017 Oct:24:267-276.
doi: 10.1016/j.ebiom.2017.09.014. Epub 2017 Sep 18.

Human Kidney Tubule-Specific Gene Expression Based Dissection of Chronic Kidney Disease Traits

Affiliations

Human Kidney Tubule-Specific Gene Expression Based Dissection of Chronic Kidney Disease Traits

Pazit Beckerman et al. EBioMedicine. 2017 Oct.

Abstract

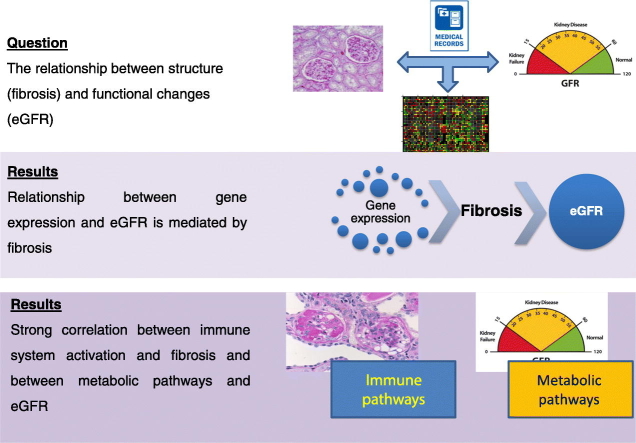
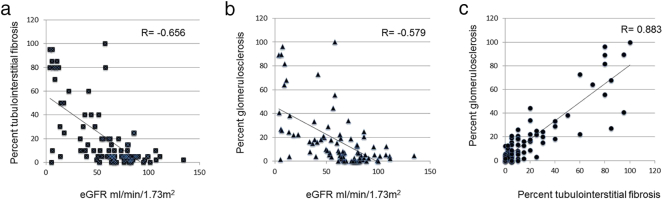
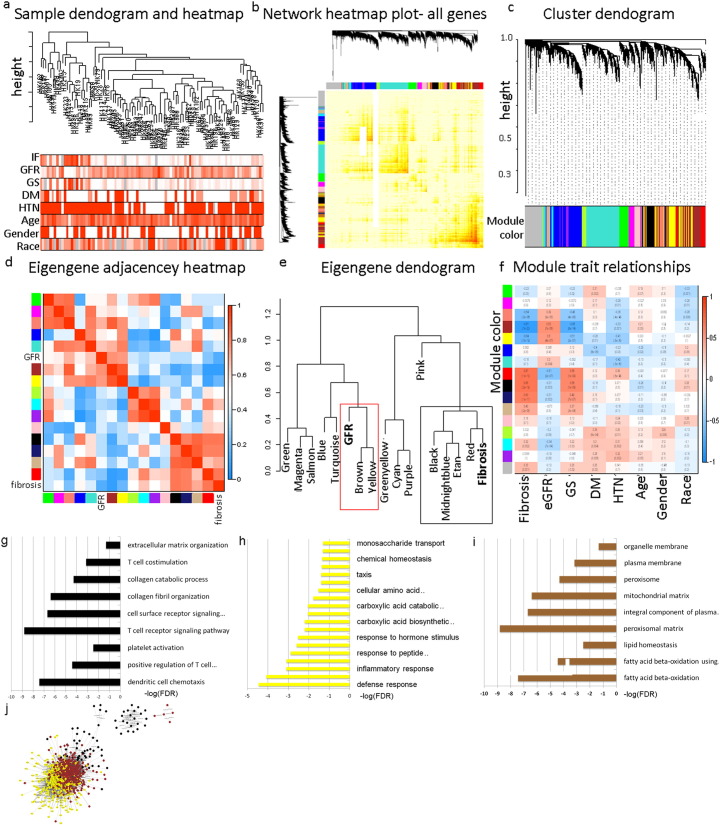
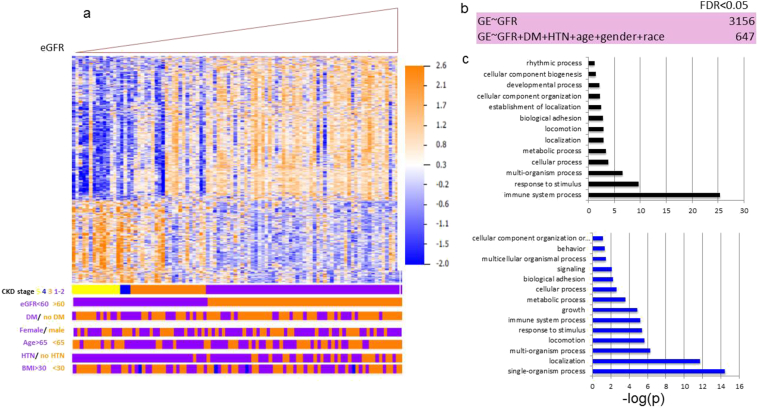
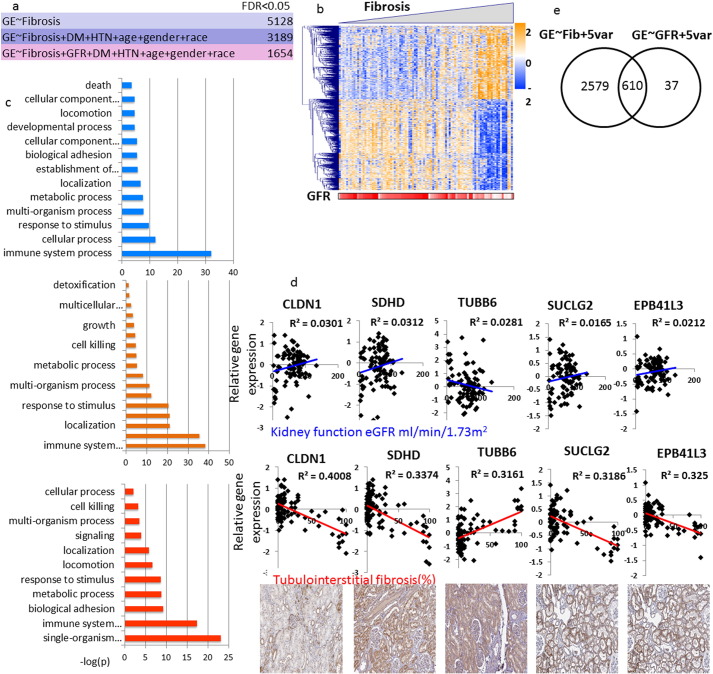
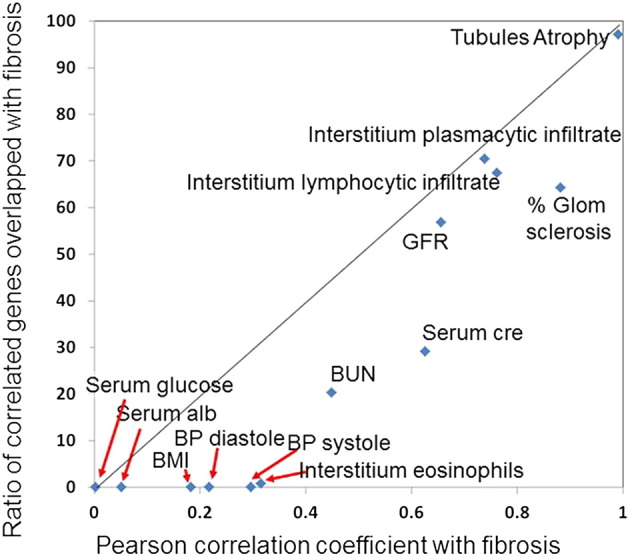
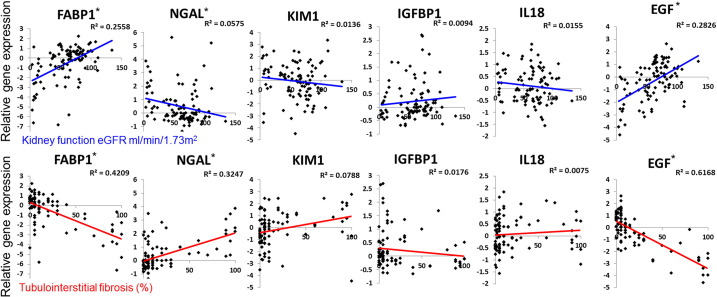
Chronic kidney disease (CKD) has diverse phenotypic manifestations including structural (such as fibrosis) and functional (such as glomerular filtration rate and albuminuria) alterations. Gene expression profiling has recently gained popularity as an important new tool for precision medicine approaches. Here we used unbiased and directed approaches to understand how gene expression captures different CKD manifestations in patients with diabetic and hypertensive CKD. Transcriptome data from ninety-five microdissected human kidney samples with a range of demographics, functional and structural changes were used for the primary analysis. Data obtained from 41 samples were available for validation. Using the unbiased Weighted Gene Co-Expression Network Analysis (WGCNA) we identified 16 co-expressed gene modules. We found that modules that strongly correlated with eGFR primarily encoded genes with metabolic functions. Gene groups that mainly encoded T-cell receptor and collagen pathways, showed the strongest correlation with fibrosis level, suggesting that these two phenotypic manifestations might have different underlying mechanisms. Linear regression models were then used to identify genes whose expression showed significant correlation with either structural (fibrosis) or functional (eGFR) manifestation and mostly corroborated the WGCNA findings. We concluded that gene expression is a very sensitive sensor of fibrosis, as the expression of 1654 genes correlated with fibrosis even after adjusting to eGFR and other clinical parameters. The association between GFR and gene expression was mostly mediated by fibrosis. In conclusion, our transcriptome-based CKD trait dissection analysis suggests that the association between gene expression and renal function is mediated by structural changes and that there may be differences in pathways that lead to decline in kidney function and the development of fibrosis, respectively.

Keywords: CKD; Fibrosis; Gene expression.


Figures

Image 1
Graphical abstract
Fig. 1
Fig. 1
Correlation between functional and structural changes of CKD. Correlation graphs of eGFR (x-axis, ml/min/1.73m2) with interstitial fibrosis (y-axis; %) (A) and glomerular sclerosis (y-axis; %) (B). Both parameters have a statistically significant negative correlation with eGFR, with Pearson r of − 0.656 and − 0.579 respectively, p < 0.01. (C) Positive correlation between interstitial fibrosis (x-axis %) and glomerular sclerosis (y-axis %), Pearson r = 0.883, p < 0.01.
Fig. 2
Fig. 2
Weighted Gene Co-expression Network Analysis (WGCNA). (A) Hierarchical clustering dendogram of the samples. The clinical traits; fibrosis, glomerulosclerosis, GFR, age, gender, race, DM and HTN are shown at the bottom. (B) Heatmap representing the Topological Overlap Matrix (TOM) among all genes in the analysis. Degree of overlap is represented by the color shade; darker color represents higher overlap and lighter color represents lower overlap. The gene dendrogram is shown on the left, module assignment is shown at the top. (C) Average linkage hierarchical clustering dendogram of the genes. Input was the topological overlap based dissimilarity. Modules, designated by color code, are the branches of the clustering tree. Unsupervised hierarchical clustering heatmap (D) and dendogram (E) of 16 module eigengenes and two clinical traits; eGFR and fibrosis. Red box indicates modules that strongly cluster with eGFR; Black box indicates modules that strongly cluster with fibrosis. (F) Correlation of module eigengenes to clinical and pathological traits. Each row corresponds to a module eigengene and the columns are clinical traits. The values in the cells are presented as “Pearson r (p value)”, and color-coded by direction and degree of the correlation (red = positive correlation; blue = negative correlation). 16 modules of co-expressed transcripts are presented with their respective correlation parameters to clinical and pathological traits. (G-I) Pathway analysis using gene ontology (GO) showing the top pathways enriched in the gene-sets of the black (G), yellow (H) and brown (I) modules. (J) Network of genes in black, yellow and brown modules; distance between nodes is determined by strength of the correlation.
Fig. 3
Fig. 3
Gene expression levels linearly correlating with eGFR. (A) Heatmap depicting hierarchical clustering of the eGFR-correlated genes, ordered by eGFR. Clinical parameters are marked below. DM = diabetes mellitus, HTN = hypertension, BMI = body mass index. (B) Identification of genes whose expression show linear correlation with eGFR with and without adjustment to 5 variables (age, race, gender, DM and HTN status). (C) Pathways analysis using Gene Ontology of non-adjusted (top panel) and adjusted (bottom panel) eGFR-correlated genes.
Fig. 4
Fig. 4
Gene expression changes strongly correlate with structural damage. (A) Identification of genes whose expression show linear correlation with fibrosis with and without adjustment to 5 variables (age, race, gender, DM and HTN status) and to eGFR. (B) Heatmap depicting hierarchical clustering of the genes correlated with fibrosis, ordered by fibrosis. eGFR of the corresponding samples is indicated below. (C) Pathways analysis using Gene Ontology of non-adjusted (top panel), adjusted to 5 variables (middle panel) and adjusted to 5 variables + eGFR (bottom panel) fibrosis-correlated genes. (D) Graphs of 6 genes that significantly correlate with fibrosis and not with eGFR. Gene expression levels are plotted against fibrosis and eGFR; the bottom panel shows positive tubular staining of the indicated genes (Human Protein Atlas; www.proteinatlas.org). (E) Venn diagram depicting genes correlating with fibrosis (3189 genes) and with eGFR (647 genes) and their overlap.
Fig. 5
Fig. 5
Association between fibrosis and clinical parameters and gene expression changes. The x-axis shows the Pearson correlation between clinical and pathological parameters and fibrosis, the y-axis shows the correlation between ratio of genes correlated with fibrosis and the depicted parameters. Note that the correlation between fibrosis and GFR is stronger then the gene expression overlap.
Fig. 6
Fig. 6
The relationship between the expression of previously published CKD biomarkers and kidney function and structure changes. Expression levels of the following biomarkers (y-axis): FABP1, NGAL, KIM1, IGFPB1, IL18 and EGF and eGFR (x-axis) and interstitial fibrosis (x-axis). The R2 value was examined for linear correlation. *p value < 0.05.

References

    1. An Y., Xu F., Le W., Ge Y., Zhou M., Chen H., Zeng C., Zhang H., Liu Z. Renal histologic changes and the outcome in patients with diabetic nephropathy. Nephrol. Dial. Transplant. 2015;30:257–266. - PubMed
    1. Becker G.J., Hewitson T.D. Animal models of chronic kidney disease: useful but not perfect. Nephrol. Dial. Transplant. 2013;28:2432–2438. - PubMed
    1. Betz B., Conway B.R. An update on the use of animal models in diabetic nephropathy research. Curr. Diab. Rep. 2016;16:18. - PMC - PubMed
    1. Bohle A., Mackensen-Haen S., Von Gise H., Grund K.E., Wehrmann M., Batz C., Bogenschutz O., Schmitt H., Nagy J., Muller C. The consequences of tubulo-interstitial changes for renal function in glomerulopathies. A morphometric and cytological analysis. Pathol. Res. Pract. 1990;186:135–144. - PubMed
    1. Bolignano D., Lacquaniti A., Coppolino G., Donato V., Campo S., Fazio M.R., Nicocia G., Buemi M. Neutrophil gelatinase-associated lipocalin (NGAL) and progression of chronic kidney disease. Clin. J. Am. Soc. Nephrol. 2009;4:337–344. - PMC - PubMed

MeSH terms