. 2017 Nov 6;214(11):3311-3329.
doi: 10.1084/jem.20161791. Epub 2017 Oct 2.

Th1 effector T cells selectively orchestrate cardiac fibrosis in nonischemic heart failure

Affiliations

Th1 effector T cells selectively orchestrate cardiac fibrosis in nonischemic heart failure

Tania Nevers et al. J Exp Med. .

Abstract

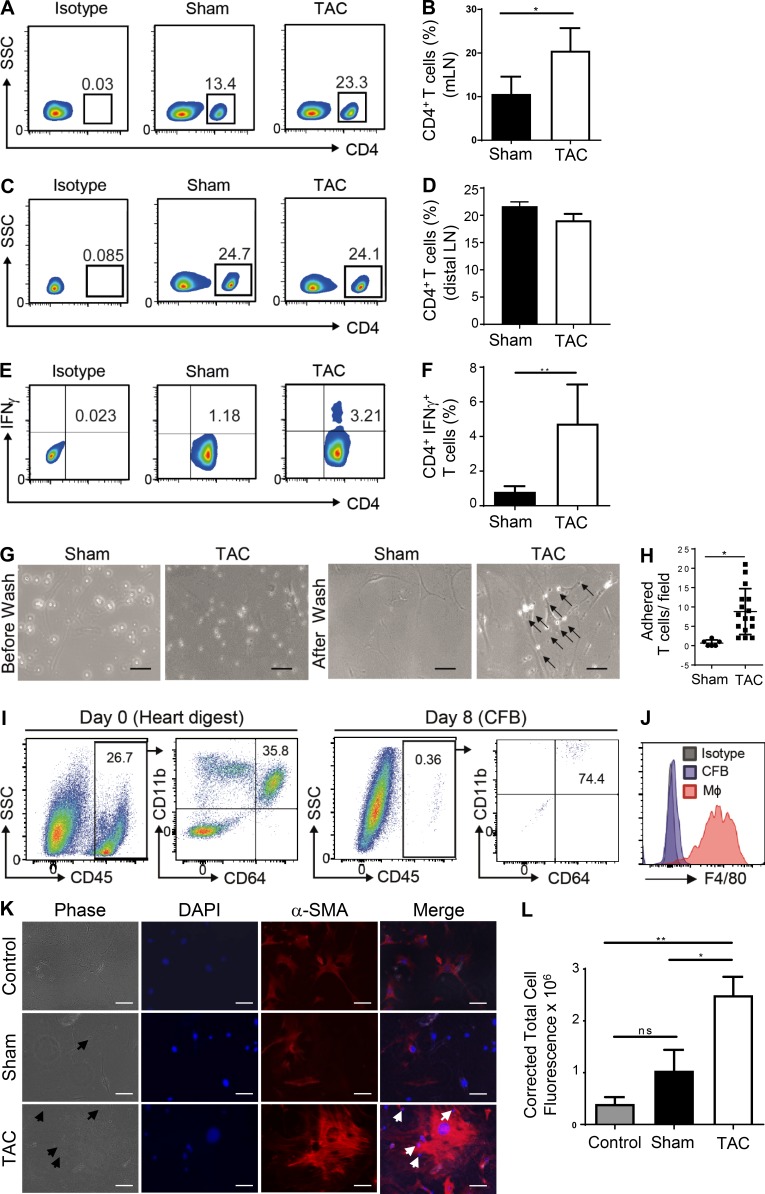
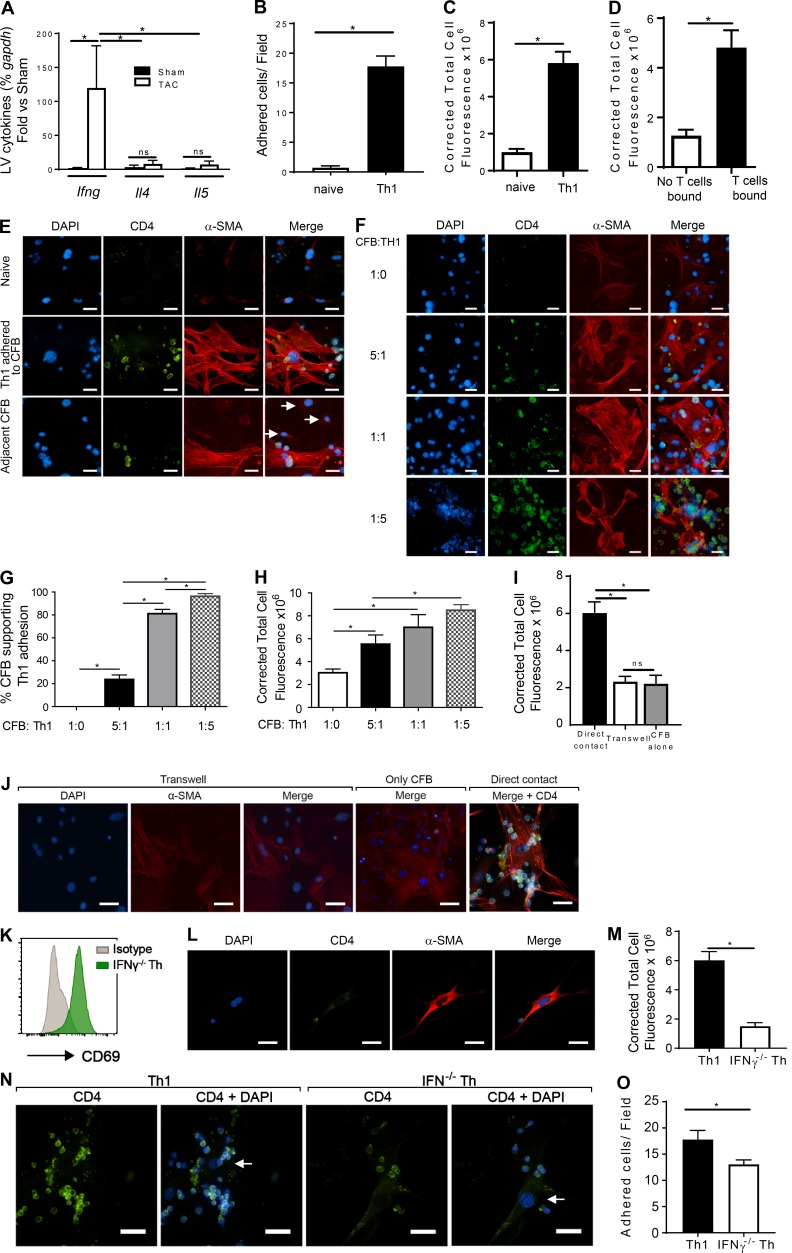
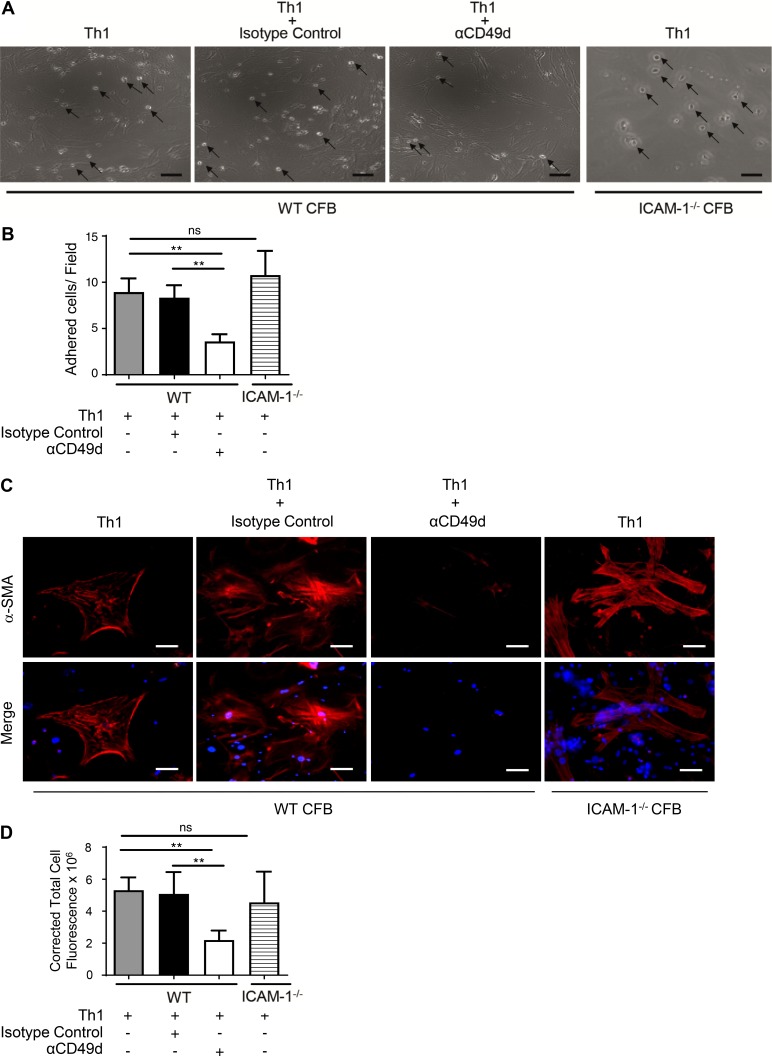
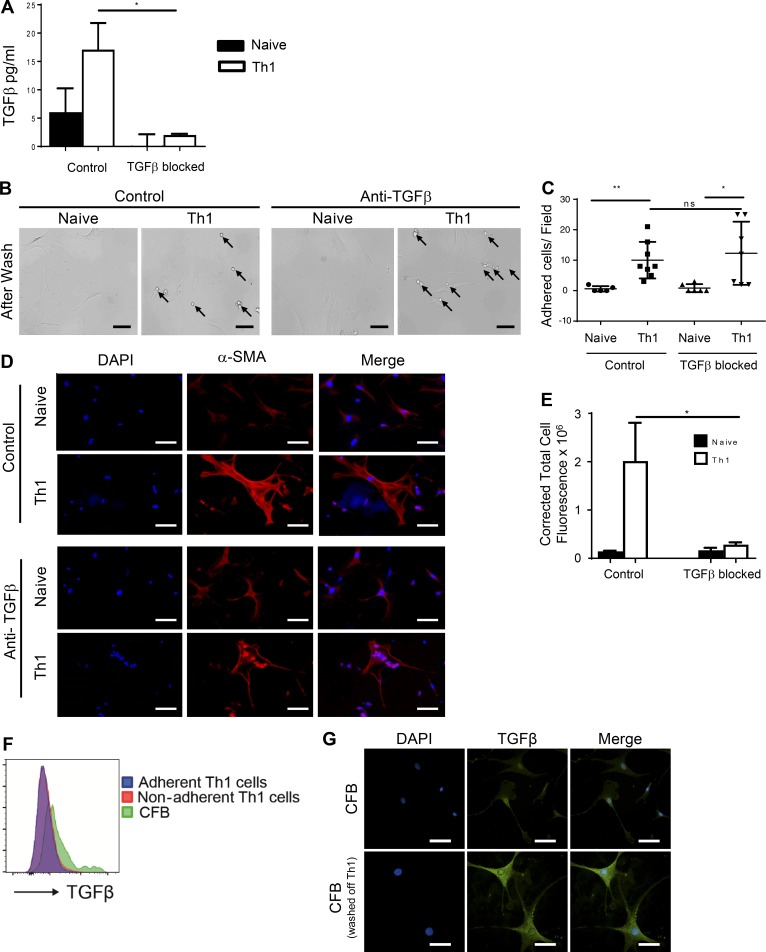
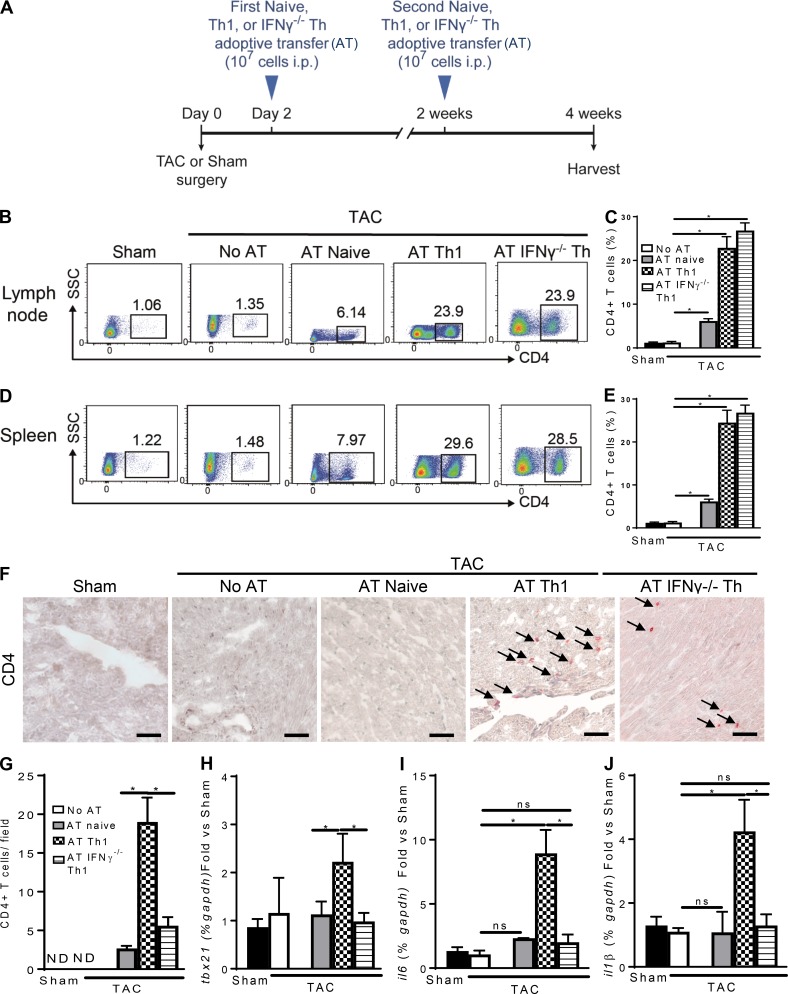
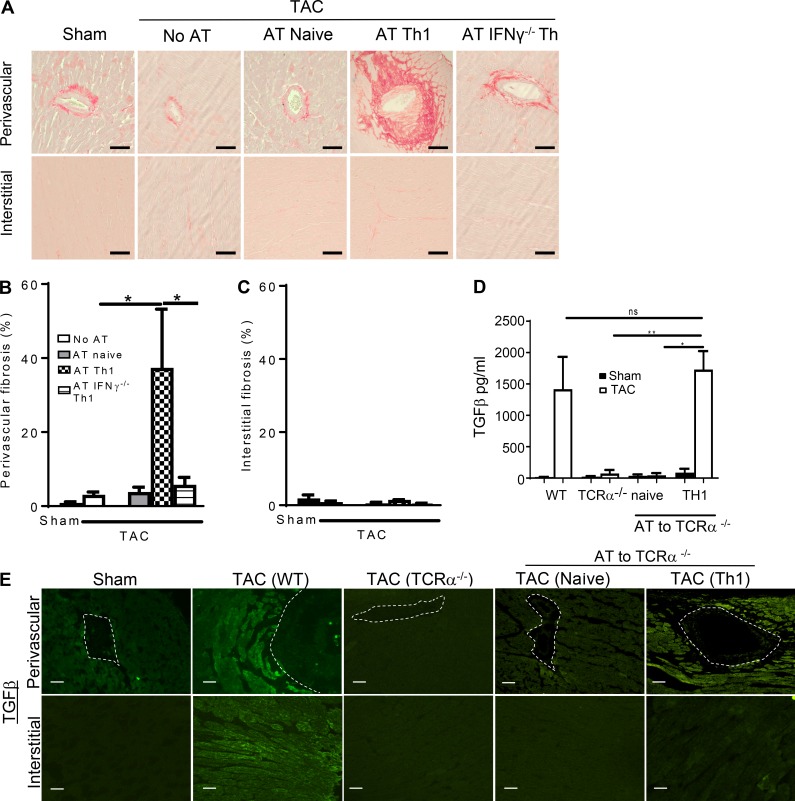
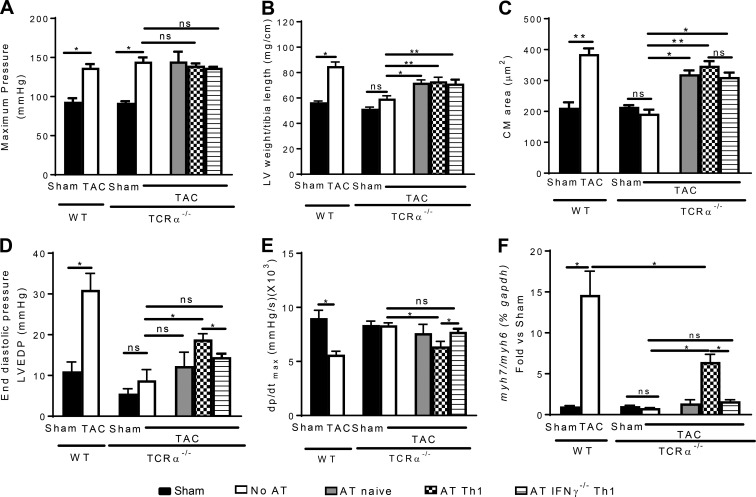
Despite emerging data indicating a role for T cells in profibrotic cardiac repair and healing after ischemia, little is known about whether T cells directly impact cardiac fibroblasts (CFBs) to promote cardiac fibrosis (CF) in nonischemic heart failure (HF). Recently, we reported increased T cell infiltration in the fibrotic myocardium of nonischemic HF patients, as well as the protection from CF and HF in TCR-α-/- mice. Here, we report that T cells activated in such a context are mainly IFN-γ+, adhere to CFB, and induce their transition into myofibroblasts. Th1 effector cells selectively drive CF both in vitro and in vivo, whereas adoptive transfer of Th1 cells, opposite to activated IFN-γ-/- Th cells, partially reconstituted CF and HF in TCR-α-/- recipient mice. Mechanistically, Th1 cells use integrin α4 to adhere to and induce TGF-β in CFB in an IFN-γ-dependent manner. Our findings identify a previously unrecognized role for Th1 cells as integrators of perivascular CF and cardiac dysfunction in nonischemic HF.


Figures

Figure 1.
Figure 1.
T cells activated in response to TAC are mainly IFN-γ+, adhere to CFBs, and induce their transition to α-SMA expressing profibrotic myofibroblasts. (A) Representative FACS plots and (B) quantification of the percentage of CD4 T cells in the mLNs and (C and D) in the inguinal and mesenteric LNs after 4 wk of sham or TAC surgery (n = 5 sham, n = 8 TAC, P ≤ 0.05, Mann-Whitney test). (E) Representative FACS plots and (F) quantification of the percentage of CD4+IFN-γ+ T cells in the mLNs after 4 wk of sham or TAC surgery. One representative FACS plot is shown from n = 5–8 mice per group (P ≤ 0.05, Mann-Whitney test). (G) Representative photo micrographs of CD4+ T cells purified from mLN of 4-wk sham or TAC mice adhering to CFB after overnight co-culture. Cells were co-cultured at a 5:1 ratio (CFB/T cells) and pictures were taken before and after washing the culture with media (arrows indicate T cells that remained adhered to CFB). (H) Quantification of CD4+ T cells that adhered to CFB after washing in three to five separate fields of view (n = 3 separate experiments; P ≤ 0.05, Student t-test). (I and J) Representative FACS with the indicated Abs at the initial and final step of the CFB preparations. n = 3 independent CFB preparations. Activated bone marrow isolated macrophages (Mφ, in red) are used as a positive control in J. Numbers in all FACS plots represent percentage. (K and L) Immunofluorescence staining (K) and quantification of α-SMA expression (L) on resting CFB (control) or CFB after overnight co-culture with CD4+ T cells from sham or TAC mice (arrows indicate T cells adhering to CFB). Bars, 50 µm. Error bars represent mean ± SD. *, P < 0.05; **, P = 0.01; ns, not significant; one-way ANOVA test; n = 3 independent experiments.
Figure 2.
Figure 2.
Th1 cell adhesion to CFB induces CFB transition to α-SMA expressing profibrotic myofibroblasts. (A) qRT-PCR of IFN-γ, IL-4, and IL-5 in the LV of WT mice subjected to TAC or sham surgery (n = 5 sham, n = 8 TAC; P ≤ 0.05; one-way ANOVA test). (B) Quantification of naive and Th1 cell adhesion to CFB and of (C) α-SMA expression in overnight co-cultures of CFB with naive or effector Th1 cells polarized in vitro. Numbers represent T cells that remained bound in three to five separate fields of view after washing the co-culture (n = 5 independent experiments; P ≤ 0.05, Student t-test). (D) Quantification and (E) representative photo micrographs indicating adhesion of CD4+–Alexa Fluor 488–labeled T cells to CFB after overnight co-culture and washing. Pictures represent immunofluorescence staining of areas of CFB supporting Th1 cell adhesion (Th1 adhered to CFB) versus adjacent CFB not supporting Th1 adhesion (adjacent CFB indicated with white arrows) next to CFB supporting Th1 adhesion. Quantification represents three to five separate fields of view in n = 5 independent experiments, P ≤ 0.05 Student t-test. (F) Representative photo micrographs indicating adhesion of the indicated CFB: CD4+–Alexa Fluor 488–labeled Th1 ratios after overnight co-culture and washing (only CFB supporting Th1 adhesion are shown) and (G) quantification of CFB supporting Th1 adhesion and (H) α-SMA expression in the different co-culture conditions (including all CFB supporting and not supporting Th1 adhesion). Analysis performed in n = 3–5 fields of view per condition; n = 2 independent experiments; P ≤ 0.05, Student t-test. (I) Quantification and (J) representative immunofluorescence photo micrographs of α-SMA staining after overnight co-culture of CFB with Th1 cells (5:1) in Transwells to avoid direct contact. Analysis performed in n = 3–5 fields of view; n = 3 independent experiments; P ≤ 0.05, one-way ANOVA test. (K) Representative FACS histogram of activated IFN-γ−/− Th cell. (L) Representative micrographs of co-cultured CFB with activated IFN-γ−/− Th cell and (M) quantification of α-SMA expression upon overnight co-culture. (N) Representative pictures of Th1 and IFN-γ−/− Th cells (green) adhered to CFB (white arrows) and (O) quantification of T cell adhesion to CFB. Analysis performed in n = 3–5 fields of view; n = 3 independent experiments; P ≤ 0.05, Student t-test. Bars, 50 µm. Error bars represent mean ± SD. *, P < 0.05. ns, not significant.
Figure 3.
Figure 3.
Th1 cells adhere to CFB through α4 integrin. (A and B) Representative photo micrograph (A) and quantification (B) of Th1 cells adhesion to either WT CFB or ICAM-1−/− CFB after overnight co-culture. α4 integrin was blocked with αCD49d antibody on Th1 T cells or isotype control before culturing with WT CFB overnight at a 5:1 ratio (CFB/T cells). Isotype-matched antibody was used as a control. Arrows point to T cells adhering to indicated WT or ICAM-1−/− CFB. Analysis performed in n = 3–5 fields of view; n = 3 independent experiments; P ≤ 0.05, one-way ANOVA test. (C) Immunofluorescence staining of α-SMA expression after overnight co-culture of adult WT CFB with Th1 cells, or Th1 cells treated with α4 integrin blocking antibodies (αCD49d) or isotype control, or Th1 cells co-cultured with adult ICAM-1−/− CFB. (D) Quantification of α-SMA corrected total cell fluorescence in n = 3–5 fields of view; n = 3 independent experiments; P ≤ 0.05, one-way ANOVA test. Bars, 50 µm. Error bars represent mean ± SD. **, P < 0.01. ns, not significant.
Figure 4.
Figure 4.
Th1 adhesion to CFB induces TGF-β in CFB and their transition to α-SMA expressing profibrotic myofibroblasts. Neutralization of TGF-β in CFB/T cell co-culture inhibits CF transition to α-SMA expressing profibrotic myofibroblasts. (A) Quantification of TGF-β in supernatants of the indicated co-cultures with or without TGF-β neutralization antibody (n = 3 independent experiments; P ≤ 0.05, one-way ANOVA test). (B) Representative photo micrographs of naive and effector Th1 cells adhering to adult CFB after overnight co-culture in the presence of TGF-β neutralization antibody or control untreated cells. Arrows indicate T cells that adhered to CFB. (C) Quantification of naive and Th1 CD4+ T cells that adhered to cardiac fibroblast with (control) or without TGF-β neutralization. Numbers represent the number of T cells bound in n = 3–5 fields of view; n = 3 independent experiments; P ≤ 0.05, one-way ANOVA test. (D) Immunofluorescence staining of α-SMA expression after overnight co-culture with control unstimulated CFB, naive, or Th1 cells treated with TGF-β neutralization antibody or no antibody control. Bars, 50 µm. (E) Quantification of α-SMA expression in n = 3–5 fields of view; n = 3 independent experiments; P ≤ 0.05, one-way ANOVA test. (F) Nonadherent Th1 cells were collected from the Th1-CFB co-culture, adherent Th1 cells were detached from CFB with EDTA, and CFB detached of Th1 cells were tripsinized and collected for FACS staining. (G) Immunofluorescence staining of TGF-β in CFB alone and CFBs that had supported Th1 adhesion and were detached of Th1 cells. Bars, 50 μm. One representative FACS histogram and representative pictures from one representative immunofluorescence experiment are shown of a total of three independent experiments performed. Bars, 50 µm. Error bars represent mean ± SD. *, P < 0.05; **, P < 0.01. ns, not significant.
Figure 5.
Figure 5.
TCR-α−/− mice are successfully reconstituted with naive, Th1, and activated IFN-γ−/− Th cells, but only Th1 cells induce LV inflammation. (A) Schematic representation of in vivo AT experiments. Forty-eight hours and 2 wk after TAC or sham surgery, 107 naive, Th1 cells, or IFN-γ−/− Th cells were adoptively transferred into TCR-α−/− recipient mice, and tissues were harvested at 4 wk after TAC or sham surgery. (B–D) Representative FACS plots (B and D) and quantification (C and E) of peripheral CD4+ T cells in the LNs (B and C) and the spleen (D and E) of control (no AT, TCR-α−/− mice) or TCR-α−/− mice reconstituted with the indicated T cells. Dot plots are representative of two to three independent AT experiments for each T cell subset transferred (n = 6–8 mice per group). *, P < 0.05, ANOVA test. (F) Representative immunohistochemistry staining of CD4+ T cells in control (no AT) and TCR-α−/− mice reconstituted with the indicated T cells. Arrows point to positive CD4+ T cells. (G) Quantification of CD4+ cells in the LV of TCR-α−/− control (no AT) or recipients of the indicated T cells. Whole LV sections from n = 6–8 mice per group were analyzed for T cell presence. *, P < 0.05, ANOVA test. (H–J) qRT-PCR of Tbet (H), IL-6 (I), and IL-1β (J) in the LV of TCR-α−/− control (no AT) or recipients of the indicated T cells. n = 6–8 mice per group; *, P < 0.05, ANOVA test. Bars, 50 µm. Error bars represent mean ± SD. *, P < 0.05. ND, not detected; ns, not significant.
Figure 6.
Figure 6.
TCR-α−/− mice have increased perivascular fibrosis after AT of Th1 cells in response to TAC. (A) Representative picrosirius red staining to identify collagen deposition in the LV after 4 wk of sham or TAC surgery in TCR-α−/− control mice (no AT) or recipients of the indicated T cells. (B) Quantification of perivascular and (C) interstitial fibrosis. Four fields of view for each mouse quantified; n = 6–8 mice per group; *, P < 0.05, ANOVA test. (D) Quantification of serum TGF-β by ELISA. n = 6–8 mice per group; *, P < 0.05, ANOVA test. (E) Immunofluorescence of TGF-β in the LV of control sham, WT, TCR-α−/− mice or TCR-α−/− mice reconstituted with naive or Th1 cells. Dotted lines surround the vascular lumen in the LV. Representative images of n = 6–8 mice per group are shown. Bars, 50 µm. Error bars represent mean ± SD. Statistical significance is shown as *, P < 0.05; **, P < 0.01; ns, not significant.
Figure 7.
Figure 7.
AT of Th1 cells into TCR-α/ TAC mice partially induces cardiac dysfunction. Hemodynamic analysis showing the (A) maximum pressure. (B) LV hypertrophy was analyzed by the LV weight which was normalized to the tibia length. (C) Cardiomyocyte size was determined in LV cross sections. (D and E) Hemodynamic analysis demonstrating the end diastolic pressure (D) and contractile function (E) in WT, TCR-α−/− control mice (no AT) or TCR-α−/− recipients of the indicated T cells, harvested 4 wk after sham or TAC surgery. (F) qRT-PCR of the ratio of MyHCβ/α in the LV in the indicated mice. Error bars represent mean ± SD. Statistical significance is shown as *, P ≤ 0.05; **, P < 0.01; ANOVA test. n = 6–8 mice per group. ns, not significant.

Similar articles

Cited by

References

    1. Afanasyeva M., Georgakopoulos D., Fairweather D., Caturegli P., Kass D.A., and Rose N.R.. 2004. Novel model of constrictive pericarditis associated with autoimmune heart disease in interferon-gamma-knockout mice. Circulation. 110:2910–2917. 10.1161/01.CIR.0000147538.92263.3A - DOI - PubMed
    1. Alcaide P., Maganto-Garcia E., Newton G., Travers R., Croce K.J., Bu D.X., Luscinskas F.W., and Lichtman A.H.. 2012. Difference in Th1 and Th17 lymphocyte adhesion to endothelium. J. Immunol. 188:1421–1430. 10.4049/jimmunol.1101647 - DOI - PMC - PubMed
    1. Anderson K.R., Sutton M.G., and Lie J.T.. 1979. Histopathological types of cardiac fibrosis in myocardial disease. J. Pathol. 128:79–85. 10.1002/path.1711280205 - DOI - PubMed
    1. Bansal S.S., Ismahil M.A., Goel M., Patel B., Hamid T., Rokosh G., and Prabhu S.D.. 2017. Activated T Lymphocytes are Essential Drivers of Pathological Remodeling in Ischemic Heart Failure. Circ Heart Fail. 10:e003688 10.1161/CIRCHEARTFAILURE.116.003688 - DOI - PMC - PubMed
    1. Blanton R.M., Takimoto E., Lane A.M., Aronovitz M., Piotrowski R., Karas R.H., Kass D.A., and Mendelsohn M.E.. 2012. Protein kinase g iα inhibits pressure overload-induced cardiac remodeling and is required for the cardioprotective effect of sildenafil in vivo. J. Am. Heart Assoc. 1:e003731 10.1161/JAHA.112.003731 - DOI - PMC - PubMed

MeSH terms

Substances