. 2017 Oct 2;8(1):763.
doi: 10.1038/s41467-017-00716-z.

Extrapyramidal side effects of antipsychotics are linked to their association kinetics at dopamine D2 receptors

Affiliations

Extrapyramidal side effects of antipsychotics are linked to their association kinetics at dopamine D2 receptors

David A Sykes et al. Nat Commun. .

Abstract

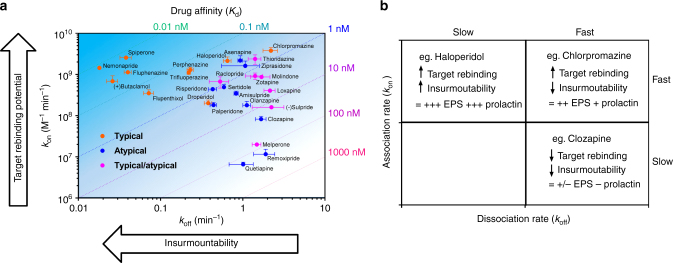
Atypical antipsychotic drugs (APDs) have been hypothesized to show reduced extrapyramidal side effects (EPS) due to their rapid dissociation from the dopamine D2 receptor. However, support for this hypothesis is limited to a relatively small number of observations made across several decades and under different experimental conditions. Here we show that association rates, but not dissociation rates, correlate with EPS. We measured the kinetic binding properties of a series of typical and atypical APDs in a novel time-resolved fluorescence resonance energy transfer assay, and correlated these properties with their EPS and prolactin-elevating liabilities at therapeutic doses. EPS are robustly predicted by a rebinding model that considers the microenvironment of postsynaptic D2 receptors and integrates association and dissociation rates to calculate the net rate of reversal of receptor blockade. Thus, optimizing binding kinetics at the D2 receptor may result in APDs with improved therapeutic profile.Atypical antipsychotics show reduced extrapyramidal side effects compared to first generation drugs. Here the authors use time-resolved FRET to measure binding kinetics, and show that side effects correlate with drug association rates to the D2 receptor, while dissociation rates correlate with prolactin elevation.


Conflict of interest statement

The authors declare no competing financial interests.

Figures

Fig. 1
Fig. 1
Determination of PPHT-red equilibrium and kinetic binding parameters. a Saturation analysis showing the binding of PPHT-red to the human dopamine D2R. CHO–D2R cell membranes (2 μg per well) were incubated for 120 min with gentle agitation with increasing concentrations of PPHT-red. Data are presented in singlet form from a representative of 13 experiments. b Observed association of PPHT-red binding to the human dopamine D2R. Data are presented in singlet form from a representative of 13 experiments. c Plot of PPHT-red concentration vs. k obs. Binding followed a simple law of mass action model, k obs increasing in a linear manner with fluorescent ligand concentration. Data are presented as mean ± s.e.m. from a total of 13 experiments. d PPHT-red dissociation following addition of haloperidol (10 μM). Dissociation data are presented in mean ± s.e.m. from four experiments performed in singlet. All binding reactions were performed in the presence of GppNHp (100 μM) with nonspecific-binding levels determined by inclusion of haloperidol (10 μM)
Fig. 2
Fig. 2
Equilibrium and competition association binding. a Competition between PPHT-red (12.5 nM) and increasing concentrations of representative atypical and typical APDs clozapine, (−)sulpride, ziprasidone, haloperidol, (+)butaclamol, fluphenthixol, and molindone at the human dopamine D2R. PPHT-red competition association curves in the presence of b clozapine, c haloperidol, and d (+)butaclamol. All binding reactions were performed in the presence of GppNHp (100 μM) with nonspecific-binding levels determined by inclusion of haloperidol (10 μM). Kinetic and equilibrium data were fitted to the equations described in “Methods” section to calculate K i, K d, and k on and k off values for the unlabeled ligands; these are summarized in Table 1. Data are presented as singlet values from a representative of four. All data used in these plots are detailed in Table 1
Fig. 3
Fig. 3
Correlating clinical data on APD “on-target” effects with kinetically derived parameters. Correlation plots showing the relationship between a log k on and EPS odds ratio and b log k off and EPS odds ratio and c log k on and prolactin increase and d log k off and prolactin increase. All kinetic data used in these plots are detailed in Table 1 and clinical data are taken from Leucht et al.. Kinetic data for aripiprazole were taken from Klein-Herenbrink et al.. Aripiprazole was not included in the correlation analysis as it is a dopamine D2R partial agonist. Correlation plot showing the relationship between e log k on and EPS odds ratio and f log k off and EPS odds ratio, clinical data taken from first-episode patient. Kinetic data are presented as mean ± s.e.m. from four experiments and clinical data as standardized mean difference (SMD) for prolactin increase and odds ratio for EPS with associated credible intervals where indicated. The relationship between two variables was assessed using a two-tailed Spearman’s rank correlation allowing the calculation of the correlation coefficient, r s. A P value of 0.05 was used as the cutoff for statistical significance and relationships depicted as trend lines
Fig. 4
Fig. 4
Modeling APD D2R rebinding and its consequences for clinical “on-target” toxic effects. Simulated dissociation rates of clinically relevant APs to human D2R, a under conditions of limited diffusion based on the association (k on) and dissociation (k off) rates determined in competition kinetic binding experiments, b under condition of free diffusion based on measured off rates (k off) determined in competition kinetic binding experiments. All kinetic parameters used to these plots are detailed in Table 1 and in the methods section associated with Eq. (4). For simulation purposes, the reversal rate k r was based on the model of an immunological synapse as detailed in the “Methods” section. Correlating clinical “on-target” effects with the kinetically derived overall reversal rate k r. Correlation plot showing the relationship between c log k r and EPS odds ratio, taken from Leucht et al. Correlation plot showing the relationship between d log k r and EPS odds ratio (relative to placebo or baseline conditions, averaged across studies), taken from studies of early psychosis patients. Correlation plot showing the relationship between e log k r and prolactin increase, taken from Leucht et al. All kinetic data used in these plots are detailed in Table 1. Kinetic data are presented as mean ± s.e.m. from four experiments and clinical data as standardized mean difference (SMD) for prolactin increase and odds ratio for EPS with associated credible intervals where indicated. The relationship between two variables was assessed using a two-tailed Spearman’s rank correlation allowing the calculation of the correlation coefficient, r s. A P value of 0.05 was used as the cutoff for statistical significance and relationships depicted as trend lines
Fig. 5
Fig. 5
Summarizing the role of kinetics and rebinding in dictating the “on-target” AP toxicity. a APD D2R kinetic map showing SGA/atypical (blue), FGA/typical (red), and APDs described as both typical and atypical (green) plotted using their respective dissociation rate (k off) and association (k on) constants, with the combinations of k off and k on that result in identical affinity (K d) values represented by diagonal dotted lines. The arrows on graph indicate the directions of increasing rebinding potential and insurmountability (due to hemi-equilibrium) dictated by k on and k off, respectively, with the heat map representing the overall rate of binding reversal (k r) from the D2R. b Three types of APD are identified from this kinetic study and represented in the box plot along with their relative potential for “on-target” toxic effects indicated by the following; (−) no evidence, (+) some evidence, moderate (++) and (+++) strong evidence. Kinetic values are presented as mean ± s.e.m. from four experiments

Comment in

References

    1. Ginovart N, Kapur S. Role of dopamine D(2) receptors for antipsychotic activity. Handb. Exp. Pharmacol. 2012;212:27–52. doi: 10.1007/978-3-642-25761-2_2. - DOI - PubMed
    1. Miyamoto S, Miyake N, Jarskog LF, Fleischhacker WW, Lieberman JA. Pharmacological treatment of schizophrenia: a critical review of the pharmacology and clinical effects of current and future therapeutic agents. Mol. Psychiatry. 2012;17:1206–1227. doi: 10.1038/mp.2012.47. - DOI - PubMed
    1. Meltzer HY. Update on typical and atypical antipsychotic drugs. Annu. Rev. Med. 2013;64:393–406. doi: 10.1146/annurev-med-050911-161504. - DOI - PubMed
    1. Leucht S, et al. Second-generation versus first-generation antipsychotic drugs for schizophrenia: a meta-analysis. Lancet. 2009;373:31–41. doi: 10.1016/S0140-6736(08)61764-X. - DOI - PubMed
    1. Farde L, et al. Positron emission tomographic analysis of central D1 and D2 dopamine receptor occupancy in patients treated with classical neuroleptics and clozapine. Relation to extrapyramidal side effects. Arch. Gen. Psychiatry. 1992;49:538–544. doi: 10.1001/archpsyc.1992.01820070032005. - DOI - PubMed

Publication types

MeSH terms

LinkOut - more resources