. 2017 Oct 2;7(1):12502.
doi: 10.1038/s41598-017-12629-4.

The FXR Agonist, Obeticholic Acid, Suppresses HCC Proliferation & Metastasis: Role of IL-6/STAT3 Signalling Pathway

Affiliations

The FXR Agonist, Obeticholic Acid, Suppresses HCC Proliferation & Metastasis: Role of IL-6/STAT3 Signalling Pathway

Yasmeen M Attia et al. Sci Rep. .

Abstract

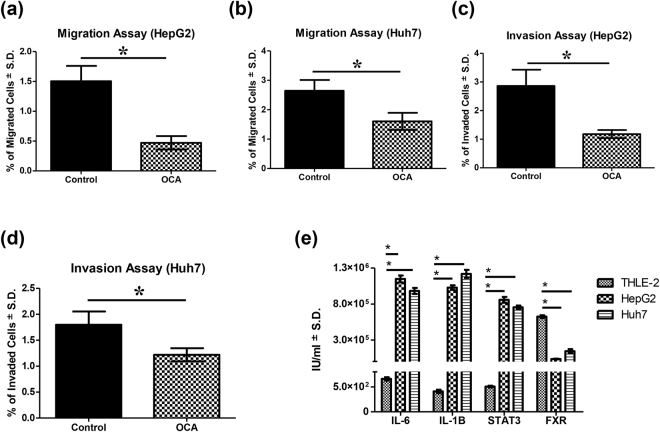
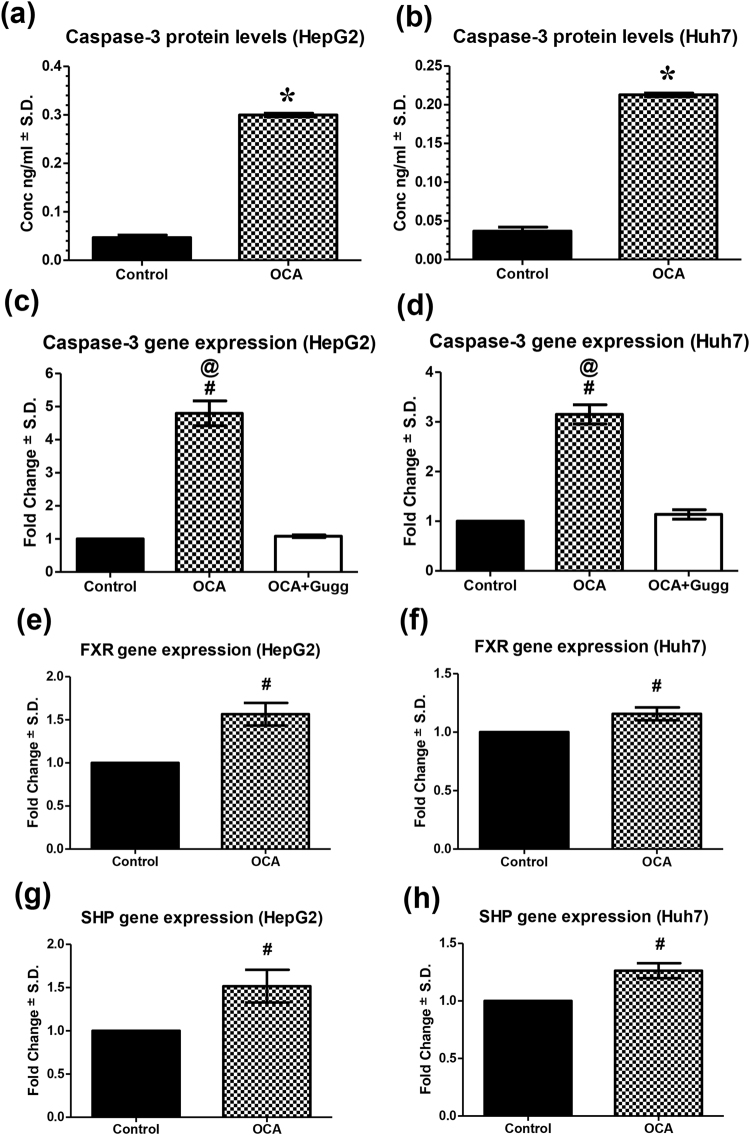
The nuclear receptor, farnesoid X receptor (FXR), has been recently considered as a tumor suppressor in HCC. IL-6/Janus kinase 2 (Jak-2)/signal transducer and activator of transcription 3 (STAT3) pathway has been implicated as a key player in many cancer types. This study aimed at investigating the potential effect of the FXR agonist, obeticholic acid (OCA), on HCC and the involvement of IL-6/STAT3 pathway. The potential regulation of STAT3 by its main feedback inhibitor target gene, the suppressor of cytokine signaling 3 (SOCS3), triggered by OCA was also explored. Cytotoxicity studies were performed on HepG2, Huh7, and SNU-449 cell lines using OCA alone and combined with the FXR antagonist guggulsterone (Gugg). OCA cytotoxic effect was significantly hampered in presence of Gugg. OCA also caused cell cycle arrest and inhibited invasion and migration of HCC cells. Decrease in STAT3 phosphorylation and SOCS3 upregulation were also observed. Moreover, Jak-2, IL-1β, and IL-6 levels were decreased. These results were correlated with an upregulation of FXR and small heterodimer partner (SHP) levels. Effects of OCA on IL-6/STAT3 main key players were reversed in presence of Gugg. Overall, these findings suggest a potential effect of OCA in HCC via interfering with IL-6/STAT3 signalling pathway in vitro.


Conflict of interest statement

The authors declare that they have no competing interests.

Figures

Figure 1
Figure 1
Effect of OCA on viability and cell cycle progression in HCC cell lines. (a) Dose-response plots of OCA, alone and combined with the FXR antagonist, Gugg, on HepG2, Huh7, and SNU-449 cell lines after 72 h exposure, as detected by MTT assay. (b,c) DNA content-based cell cycle analysis in HepG2 and Huh7 cell lines treated with OCA. Results represent three independent experiments performed in triplicates.
Figure 2
Figure 2
Migration and invasion assays for OCA on HCC cell lines & gene expression in normal cells vs HCC cells. Migration assays performed on (a) HepG2 and (b) Huh7 cell lines. Invasion assays performed on (c) HepG2 and (d) Huh7 cell lines. (e) Gene expression of IL-6, IL-1β, STAT3, & FXR in THLE-2 normal liver cells, HepG2, & Huh7 cells. Values are presented as means ± S.D. from three independent experiments performed in triplicates. Gene expression levels were estimated using qPCR absolute quantitation method. Statistical analysis was performed using Student’s t test for migration and invasion assays and one-way ANOVA for gene expression analysis. *Significantly different (at P < 0.05) versus control untreated cells (ad) or normal liver cells (e).
Figure 3
Figure 3
Effect of OCA on caspase-3, FXR, and SHP expression levels. Caspase-3 protein expression on (a) HepG2 and (b) Huh7 cell lines treated with OCA. Caspase-3 gene expression levels in OCA- and OCA+Gugg-treated (c) HepG2 and (d) Huh7 cell lines. FXR gene expression on (e) HepG2 and (f) Huh7 cell lines treated with OCA. SHP gene expression on (g) HepG2 and (h) Huh7 cell lines treated with OCA. Protein levels were estimated using ELISA. Gene expression levels were estimated using relative qRT-PCR method (fold change from control untreated samples normalized to GAPDH). Values are presented as means ± S.D. from three independent experiments performed in triplicates. *P < 0.05 significant from control untreated cells using Student’s t test. #P < 0.05 significant when the 95% C.I. was compared with control untreated cells. @P < 0.05 significant when the 95% C.I. was compared with OCA+Gugg-treated cells.
Figure 4
Figure 4
Effect of OCA on STAT3 expression levels. Phosphorylated STAT3 (p-STAT3) protein expression levels in OCA-treated (a) HepG2 and (b) Huh7 cell lines. Total STAT3 (t-STAT3) protein expression levels in OCA-treated (c) HepG2 and (d) Huh7 cell lines. STAT3 gene expression on (e) HepG2 and (f) Huh7 cell lines treated with OCA alone or OCA+Gugg. Protein levels were estimated using ELISA. Gene expression levels were estimated using relative qRT-PCR method (fold change from control untreated samples normalized to GAPDH). Values are presented as means ± S.D. from three independent experiments performed in triplicates. *P < 0.05 significant from control untreated cells using Student’s t test. #P < 0.05 significant when the 95% C.I. was compared with control untreated cells. @P < 0.05 significant when the 95% C.I. was compared with OCA+Gugg-treated cells.
Figure 5
Figure 5
Effect of OCA on SOCS3 expression levels. SOCS3 gene expression on (a) HepG2 and (b) Huh7 cell lines treated with OCA. SOCS3 protein expression levels in OCA-treated (c) HepG2 and (d) Huh7 cell lines. Protein levels were estimated using ELISA. Gene expression levels were estimated using relative qRT-PCR method (fold change from control untreated samples normalized to GAPDH). Values are presented as means ± S.D. from three independent experiments performed in triplicates. *P < 0.05 significant from control untreated cells using Student’s t test. #P < 0.05 significant when the 95% C.I. was compared with control untreated cells.
Figure 6
Figure 6
Effect of OCA on Jak-2, IL-1β, and IL-6 expression levels. Jak-2 gene expression on (a) HepG2 and (b) Huh7 cell lines treated with OCA. IL-1β gene expression on (c) HepG2 and (d) Huh7 cell lines treated with OCA or OCA+Gugg. IL-6 gene expression on (e) HepG2 and (f) Huh7 cell lines treated with OCA or OCA+Gugg. Gene expression levels were estimated using relative qRT-PCR method (fold change from control untreated samples normalized to GAPDH). Values are presented as means ± S.D. from three independent experiments performed in triplicates. #P < 0.05 significant when the 95% C.I. was compared with control untreated cells. @P < 0.05 significant when the 95% C.I. was compared with OCA+Gugg-treated cells.
Figure 7
Figure 7
Schematic diagram of the proposed mechanism by which OCA may modulate the IL-6/Jak-2/STAT3 signalling pathway in HCC cells. FXR deficiency leads to activation of STAT3 pathway by increasing IL-1β which subsequently increases IL-6 levels. IL-6 then binds to IL-6 receptor (IL-6R) leading to Jak-2 phosphorylation via glycoprotein 130 (gp130) consequently activating STAT3 phosphorylation. STAT3 homodimers are then formed and translocated to the nucleus leading to the activation of many downstream target genes responsible for hepatic carcinogenesis such as SOCS3, the FXR target gene and the feedback inhibitor of STAT3.

References

    1. Sherman M. Hepatocellular carcinoma: epidemiology, surveillance, and diagnosis. Seminars in liver disease. 2010;30:3–16. doi: 10.1055/s-0030-1247128. - DOI - PubMed
    1. El-Serag HB. Hepatocellular carcinoma. The New England journal of medicine. 2011;365:1118–1127. doi: 10.1056/NEJMra1001683. - DOI - PubMed
    1. Goodwin B, et al. A regulatory cascade of the nuclear receptors FXR, SHP-1, and LRH-1 represses bile acid biosynthesis. Molecular cell. 2000;6:517–526. doi: 10.1016/S1097-2765(00)00051-4. - DOI - PubMed
    1. Claudel T, Staels B, Kuipers F. The Farnesoid X receptor: a molecular link between bile acid and lipid and glucose metabolism. Arteriosclerosis, thrombosis, and vascular biology. 2005;25:2020–2030. doi: 10.1161/01.ATV.0000178994.21828.a7. - DOI - PubMed
    1. Inagaki T, et al. Fibroblast growth factor 15 functions as an enterohepatic signal to regulate bile acid homeostasis. Cell metabolism. 2005;2:217–225. doi: 10.1016/j.cmet.2005.09.001. - DOI - PubMed

Publication types

MeSH terms

LinkOut - more resources