. 2017 Oct 2;7(1):12494.
doi: 10.1038/s41598-017-12675-y.

Multiple regulatory mechanisms of the biological function of NRF3 (NFE2L3) control cancer cell proliferation

Affiliations

Multiple regulatory mechanisms of the biological function of NRF3 (NFE2L3) control cancer cell proliferation

A M Masudul Azad Chowdhury et al. Sci Rep. .

Abstract

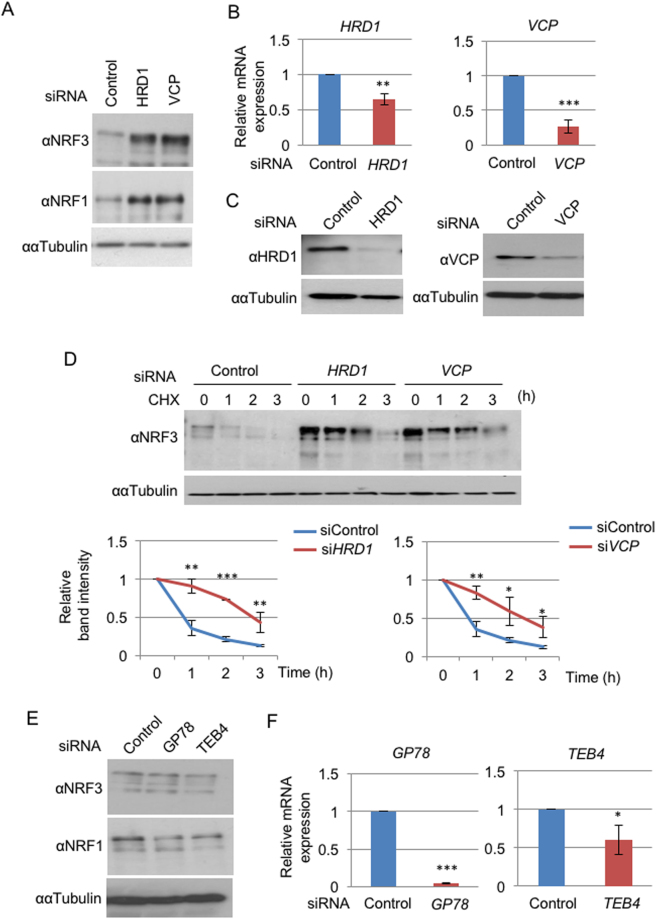
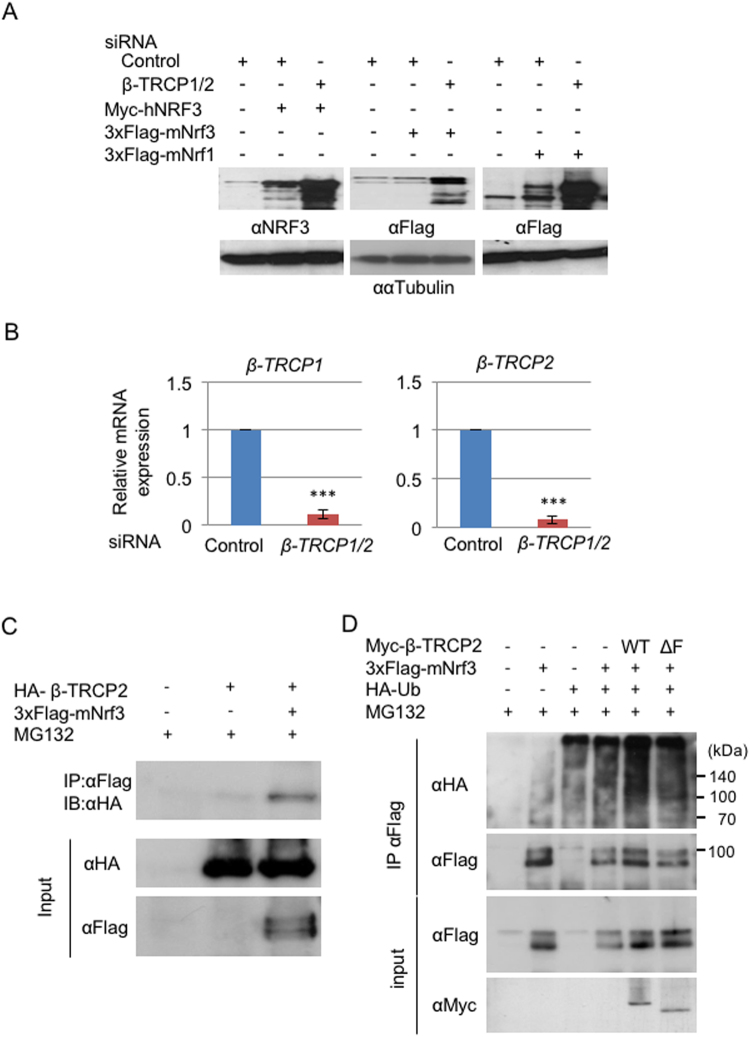
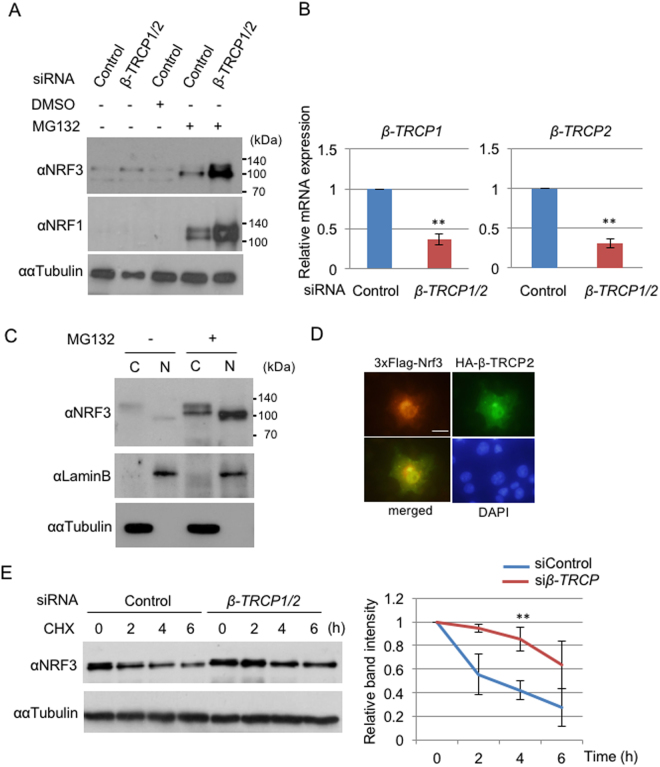
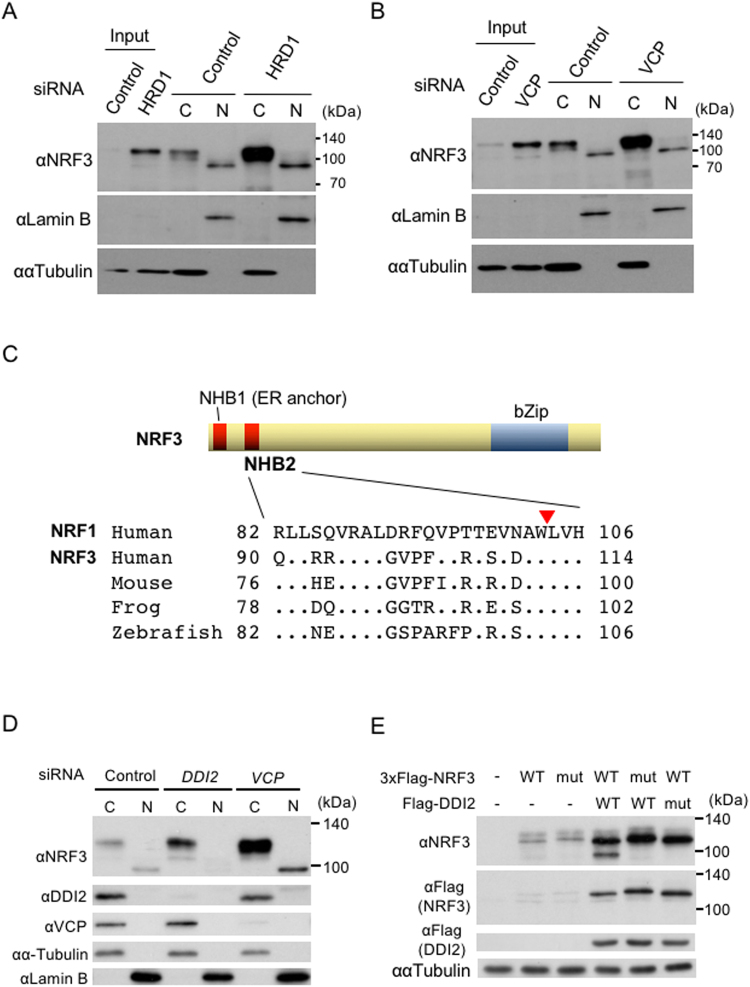
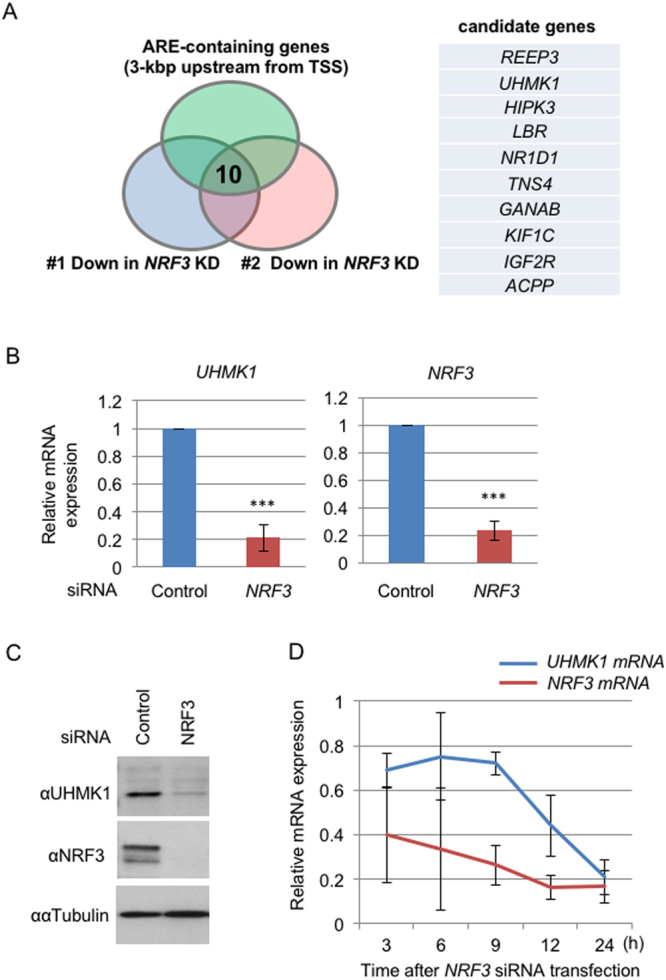
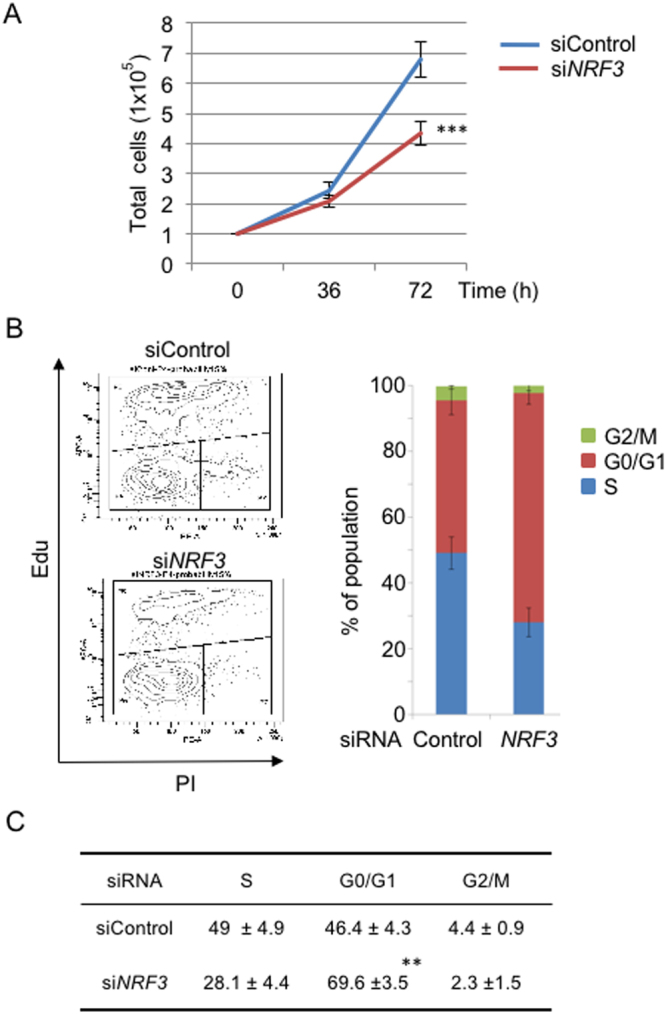
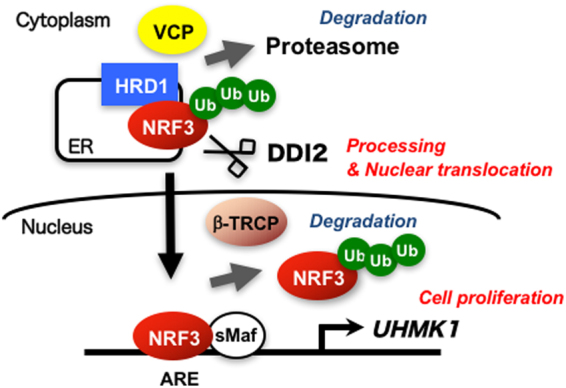
Accumulated evidence suggests a physiological relationship between the transcription factor NRF3 (NFE2L3) and cancers. Under physiological conditions, NRF3 is repressed by its endoplasmic reticulum (ER) sequestration. In response to unidentified signals, NRF3 enters the nucleus and modulates gene expression. However, molecular mechanisms underlying the nuclear translocation of NRF3 and its target gene in cancer cells remain poorly understood. We herein report that multiple regulation of NRF3 activities controls cell proliferation. Our analyses reveal that under physiological conditions, NRF3 is rapidly degraded by the ER-associated degradation (ERAD) ubiquitin ligase HRD1 and valosin-containing protein (VCP) in the cytoplasm. Furthermore, NRF3 is also degraded by β-TRCP, an adaptor for the Skp1-Cul1-F-box protein (SCF) ubiquitin ligase in the nucleus. The nuclear translocation of NRF3 from the ER requires the aspartic protease DNA-damage inducible 1 homolog 2 (DDI2) but does not require inhibition of its HRD1-VCP-mediated degradation. Finally, NRF3 mediates gene expression of the cell cycle regulator U2AF homology motif kinase 1 (UHMK1) for cell proliferation. Collectively, our study provides us many insights into the molecular regulation and biological function of NRF3 in cancer cells.


Conflict of interest statement

The authors declare that they have no competing interests.

Figures

Figure 1
Figure 1
Hrd1 and VCP regulate the cytoplasmic degradation of NRF3. (A) The addition of HRD1 or VCP siRNA stabilized endogenous NRF3 in DLD-1 cells. At 48 hr after the siRNA transfection, the whole-cell extracts were prepared and analyzed by immunoblotting with anti-NRF3 and anti-NRF1 antibodies. α-Tubulin was used as an internal control. (B,C) The knockdown efficiency of HRD1 and VCP siRNA was determined by quantitative real-time PCR (qRT-PCR) analysis and immunoblot analysis with anti- HRD1 and anti-VCP antibodies. The values of the qRT-PCR analysis in (B) were normalized to the 18S rRNA data. (D) The knockdown of HRD1 or VCP inhibited NRF3 degradation in the cycloheximide chase experiment. The immunoblot analysis was performed with the anti-NRF3 antibody. α-Tubulin was used as an internal control. The graphs depict the quantified band intensities of NRF3, normalized to that of α-Tubulin. (E) The addition of GP78 or TEB4 siRNA did not stabilize the endogenous NRF3 in DLD-1 cells. The experiment was done as described in the legend of Fig. 1A. Error bars (B,D and F) represent data from three independent experiments (mean ± standard deviation). The two-tailed Student’s t-test was used for the statistical analysis. *P < 0.05, **P < 0.01 and ***P < 0.001 compared to the Control data.
Figure 2
Figure 2
β-TRCP regulates the ubiquitin-mediated degradation of NRF3. (A) HeLa cells were transfected with Myc-hNRF3, 3× Flag-mNrf3 or 3× Flag-mNrf1 (as a positive control) expression vectors at 24 hr after two rounds of transfection with the Control or β-TRCP1/2 siRNA (simultaneous knockdown of both β-TRCP1 and β-TRCP2). At 24 hr after the last transfection, whole-cell extracts from the cells were subjected to immunoblot analysis with anti-NRF3 and anti-Flag antibodies. α-Tubulin was used as an internal control. (B) The knockdown efficiency of β-TRCP1/2 siRNA was determined by real-time quantitative PCR analysis. The values were normalized to 18S rRNA data. Error bars represent data from three independent experiments (mean ± standard deviation). The two-tailed Student’s t-test was used for the statistical analysis. ***P < 0.001 compared to the Control data. (C) Physical association between NRF3 and β-TRCP. 3xFlag-mNrf3 and HA-β-TRCP2 were transiently expressed in COS7 cells. The immunoprecipitation was conducted using the anti-Flag antibody, followed by immunoblot analysis using the anti-HA antibody. (D) β-TRCP-mediated polyubiquitination of NRF3 in HCT116 cells. The cells were transfected with 3xFlag-mNrf3, HA-ubiquitin (Ub), and the Myc-β-TRCP2 wild type (WT) or the ∆F-box mutant (∆F). The 3xFlag-hNRF3 was immunoprecipitated (IP) with the anti-Flag antibody, and its polyubiquitination was detected by immunoblot analysis with the anti-HA antibody.
Figure 3
Figure 3
β-TRCP modulates the nuclear degradation of NRF3. (A) Endogenous NRF3 is susceptible to the β-TRCP-mediated proteasomal degradation in the nucleus of DLD-1 cells. The cells were transfected with the Control or β-TRCP1/2 siRNA. At 48 hr after transfection, the cells were subjected to two processes: (1) their whole cell extracts were prepared for immunoblot analysis with anti-NRF3 and anti-NRF1 antibodies, and (2) the cells were further treated with DMSO or MG132 (10 µM) for 6 hr, followed by a similar immunoblot analysis. (B) The knockdown efficiency of siRNA for β-TRCP1/2 was determined by qRT-PCR analysis. (C) MG132 treatment promoted the nuclear translocation of NRF3 in DLD-1 cells. The cytoplasmic and nuclear fractions of DLD-1 cells treated with MG132 for 6 hr were subjected to immunoblot analysis with the anti-NRF3 antibody. Lamin B and α-Tubulin were utilized as the nuclear and cytoplasmic markers, respectively. (D) Nuclear colocalization of 3xFlag-mNrf3 (red) and HA-β-TRCP (green) after MG132 treatment in COS7 cells visualized by immunostaining. The nuclei were stained with DAPI (bar = 20 μm). (E) β-TRCP1/2 siRNA stabilized the endogenous NRF3 in DLD-1 cells in a cycloheximide (CHX) chase experiment. After the siRNA transfection, the cells were treated with MG132 (10 µM) for 6 hr, followed by treatment with cycloheximide. The immunoblot analysis was performed with the anti-NRF3 antibody. α-Tubulin was used as an internal control. The graph (E) depicts the quantified band intensities of NRF3. The values were normalized with α-Tubulin. The error bars (B and E) represent data from three independent experiments (mean ± standard deviation). The two-tailed Student’s t-test was used for the statistical analysis. **P < 0.01 compared to the Control data.
Figure 4
Figure 4
The nuclear translocation of NRF3 requires the aspartic protease DDI2, but not inhibition of HRD1 or VCP. (A and B) HRD1 or VCP knockdown did not promote the nuclear translocation of NRF3. The DLD-1 cells were transfected with Control and HRD1 siRNA. At 48 hr after transfection, the cytoplasmic and nuclear fractions were extracted from the cells and subjected to immunoblot analysis with anti-NRF3 antibody. Lamin B and α-Tubulin were utilized as the nuclear and cytoplasmic markers, respectively. (C) Sequence alignment of the NHB2 domain of NRF1 and NRF3. The NRF1 processing site (a red triangle) is highly conserved in NRF3 among several species. (D) DDI2 knockdown substantially abolishes the nuclear translocation of the endogenous NRF3 in DLD-1 cells. After transfection with the indicated siRNA, the cells were fractionated into the cytoplasmic (C) and nuclear extracts (N), followed by an immunoblot analysis using the indicated antibodies. As a positive control, a similar experiment using VCP siRNA was performed. (E) DDI2 cleaves the N-terminal 3xFlag-fused hNRF3. The cells were transfected into HeLa cells with the indicated plasmids, and whole-cell extracts from the cells were subjected to immunoblot analysis with the indicated antibodies. 3xFlag-hNRF3 WL111AA (mut) is the mutant of a putative cleavage site in NRF3 that corresponds to the same site in NRF1, and DDI2 D252N (mut) is the protease dead mutant.
Figure 5
Figure 5
Identification of the UHMK1 gene as a target of NRF3. (A) Venn diagram combining two independent sets of microarray data of NRF3 siRNA-transfected DLD-1 cells (#1 and #2) and a list of genes that possess the species-conserved AREs within the region that is 3 kb upstream from the transcriptional start site (TSS). Ten candidate genes from this analysis are shown. (B and C) NRF3 knockdown significantly reduces mRNA and protein levels of UHMK1 in DLD-1 cells. At 48 hr after transfection with Control or NRF3 siRNA, the mRNA expression levels of UHMK1 and NRF3 were determined by qRT-PCR analysis. The values were normalized to 18S rRNA data (B). Immunoblotting of the whole-cell extracts with the anti-NRF3 and anti-UHMK1 antibodies was performed (C). α-Tubulin was used as an internal control. (D) A time-course study of UHMK1 mRNA expression after the NRF3 knockdown. The DLD-1 cells were transfected with Control or NRF3 siRNA, after which the mRNA of the cells was extracted at the indicated times and a qRT-PCR analysis was performed. The error bars (B,D) represent data from three independent experiments (mean ± standard deviation). The two-tailed Student’s t-test was used for the statistical analysis. ***P < 0.001 compared to the Control data.
Figure 6
Figure 6
NRF3 promotes the proliferation of colon cancer cells. (A) NRF3 knockdown significantly reduced the proliferation of DLD-1 cells. The cells were transfected with Control or NRF3 siRNA. At 36 and 72 hr after transfection, the cell numbers were counted using a hemocytometer. The initial cell numbers at the time of transfection were 1 × 105. (B and C) NRF3 knockdown significantly arrested DLD-1 cells in the G0/G1 phase. At 48 hr after transfection with the Control or NRF3 siRNA, the cells were subjected to FACS analysis to determine the fraction of their populations in different cell cycle stages (G0/G1, S and G2/M). The representative data from three independent experiments are shown (B, left). The percentages of the cell population in each phase are shown as the mean ± standard deviation (C). The error bars (A,B) represent data from three independent experiments (mean ± standard deviation). The two-tailed Student’s t-test was used for the statistical analysis. ***P < 0.001 (A) and **P < 0.01 (C) compared to the Control data.
Figure 7
Figure 7
Schematic model of multiple regulation of the biological function of the transcription factor NRF3. Under normal conditions, NRF3 is degraded by the ERAD ubiquitin ligase HRD1 and VCP in the cytoplasm. DDI2 promotes the nuclear entry of NRF3 by its processing. In the nucleus, NRF3 activates the expression of the UHMK1 gene for cell proliferation. Alternatively, the β-TRCP-based E3 ubiquitin ligase suppresses the NRF3 function by mediating its nuclear degradation.

References

    1. Sykiotis GP, Bohmann D. Stress-activated cap’n’collar transcription factors in aging and human disease. Sci. Signal. 2010;3:re3. doi: 10.1126/scisignal.3112re3. - DOI - PMC - PubMed
    1. Chevillard G, Blank V. NFE2L3 (NRF3): the Cinderella of the Cap’n’Collar transcription factors. Cell. Mol. Life Sci. 2011;3:3337–3348. doi: 10.1007/s00018-011-0747-x. - DOI - PMC - PubMed
    1. Bugno M, Daniel M, Chepelev NL, Willmore WG. Changing gears in Nrf1 research, from mechanisms of regulation to its role in disease and prevention. Biochim. Biophys. Acta. 2015;1849:1260–1276. doi: 10.1016/j.bbagrm.2015.08.001. - DOI - PubMed
    1. Kobayashi A, et al. Molecular Cloning and Functional Characterization of a New Cap’ n’ Collar Family Transcription Factor Nrf3. J. Biol. Chem. 1999;274:6443–6452. doi: 10.1074/jbc.274.10.6443. - DOI - PubMed
    1. Derjuga A, et al. Complexity of CNC Transcription Factors As Revealed by Gene Targeting of the Nrf3 Locus. Mol. Cell. Biol. 2004;24:3286–3294. doi: 10.1128/MCB.24.8.3286-3294.2004. - DOI - PMC - PubMed

Publication types

MeSH terms