. 2017 Oct 2;8(1):760.
doi: 10.1038/s41467-017-01095-1.

Transcriptomes and neurotransmitter profiles of classes of gustatory and somatosensory neurons in the geniculate ganglion

Affiliations

Transcriptomes and neurotransmitter profiles of classes of gustatory and somatosensory neurons in the geniculate ganglion

Gennady Dvoryanchikov et al. Nat Commun. .

Abstract

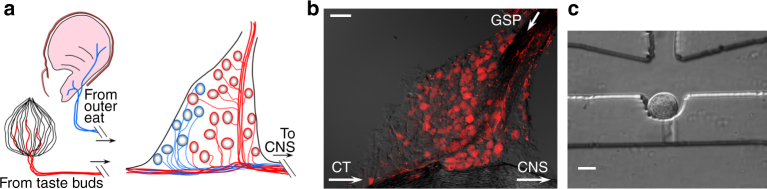
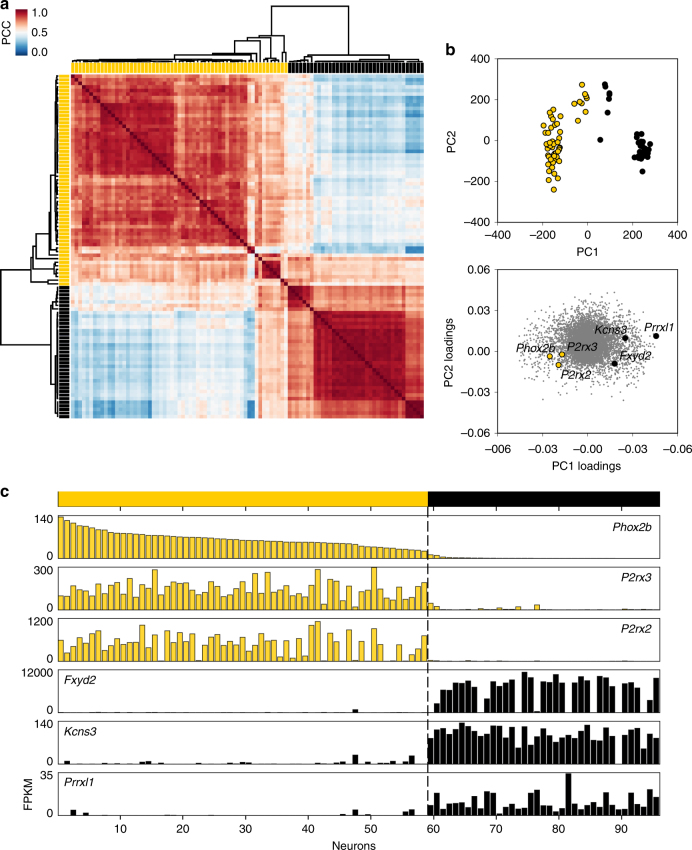
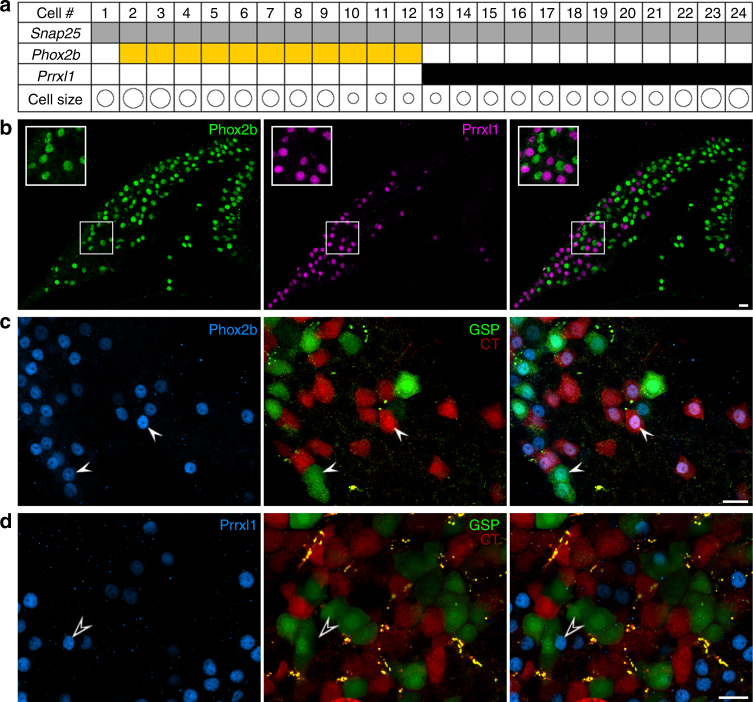
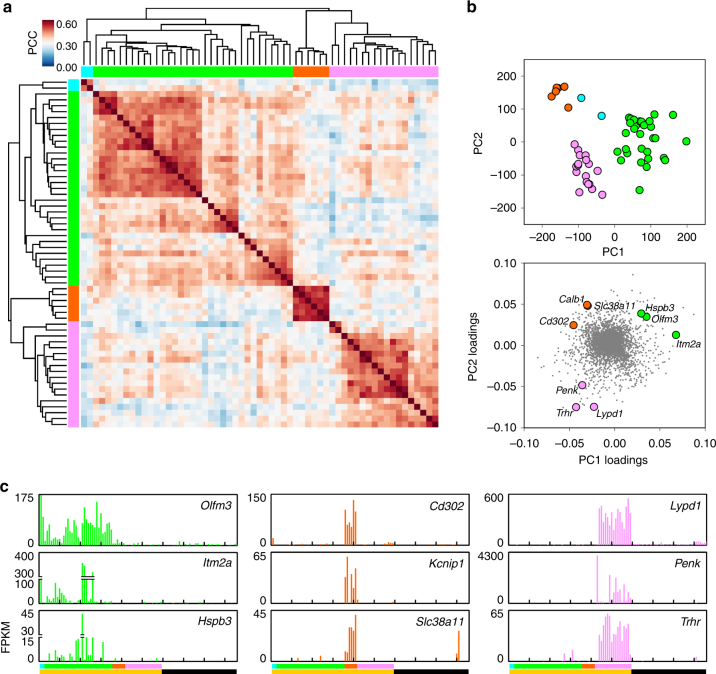
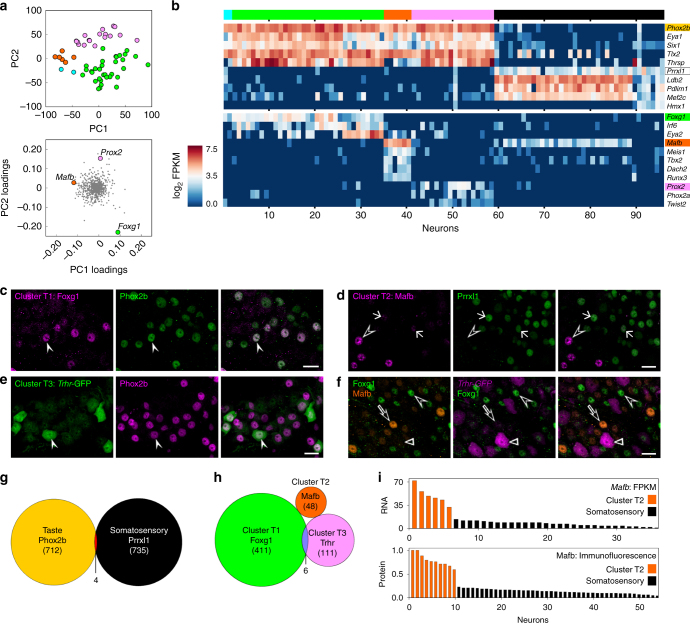
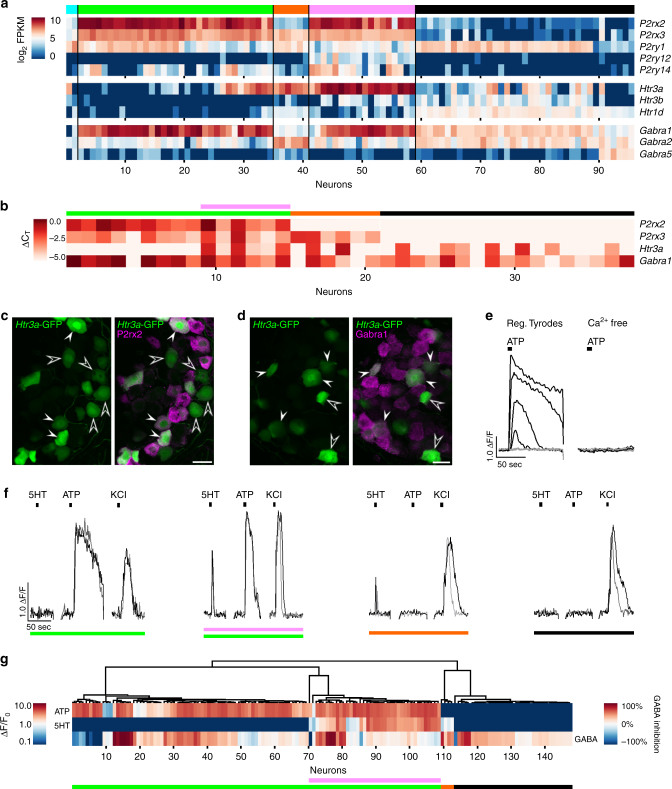
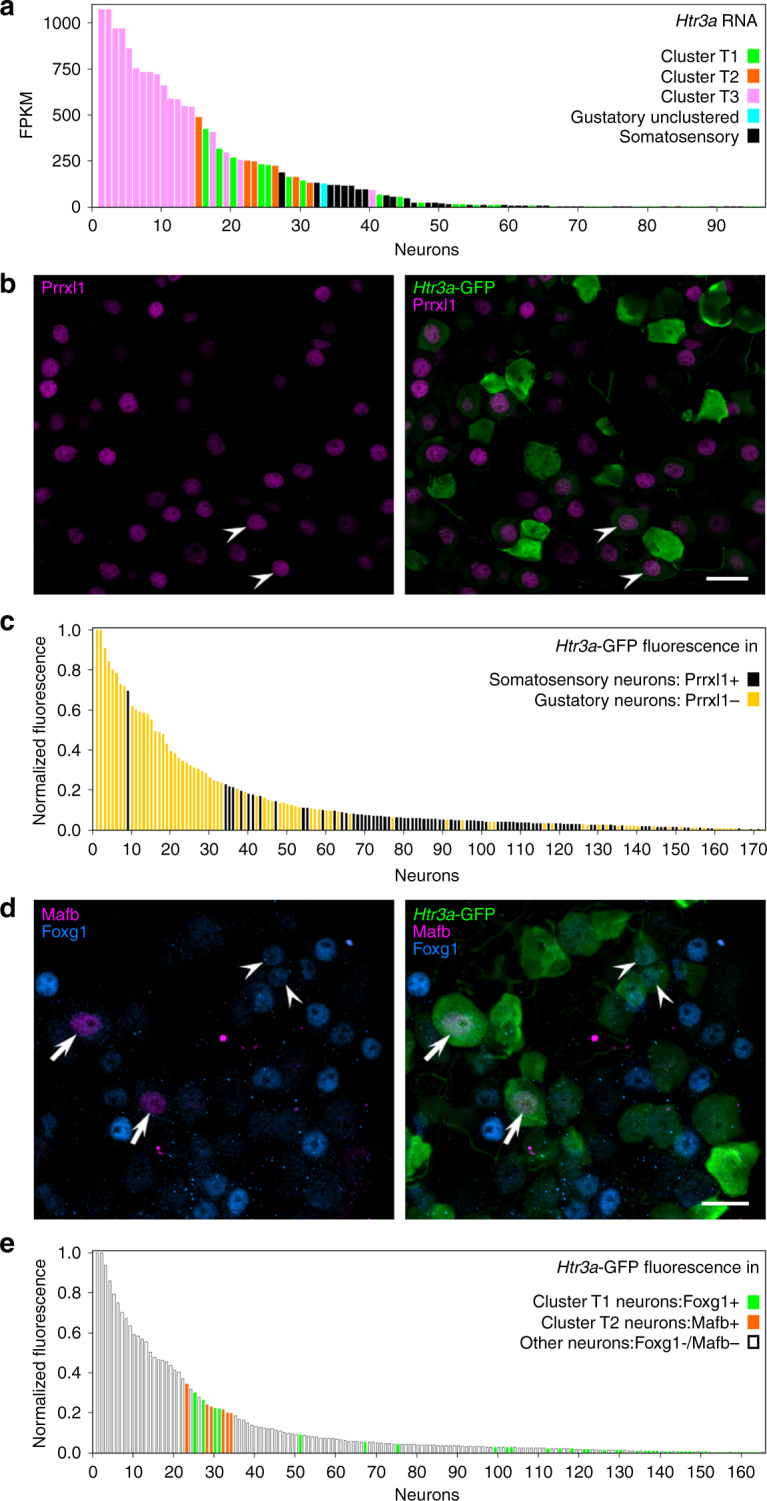
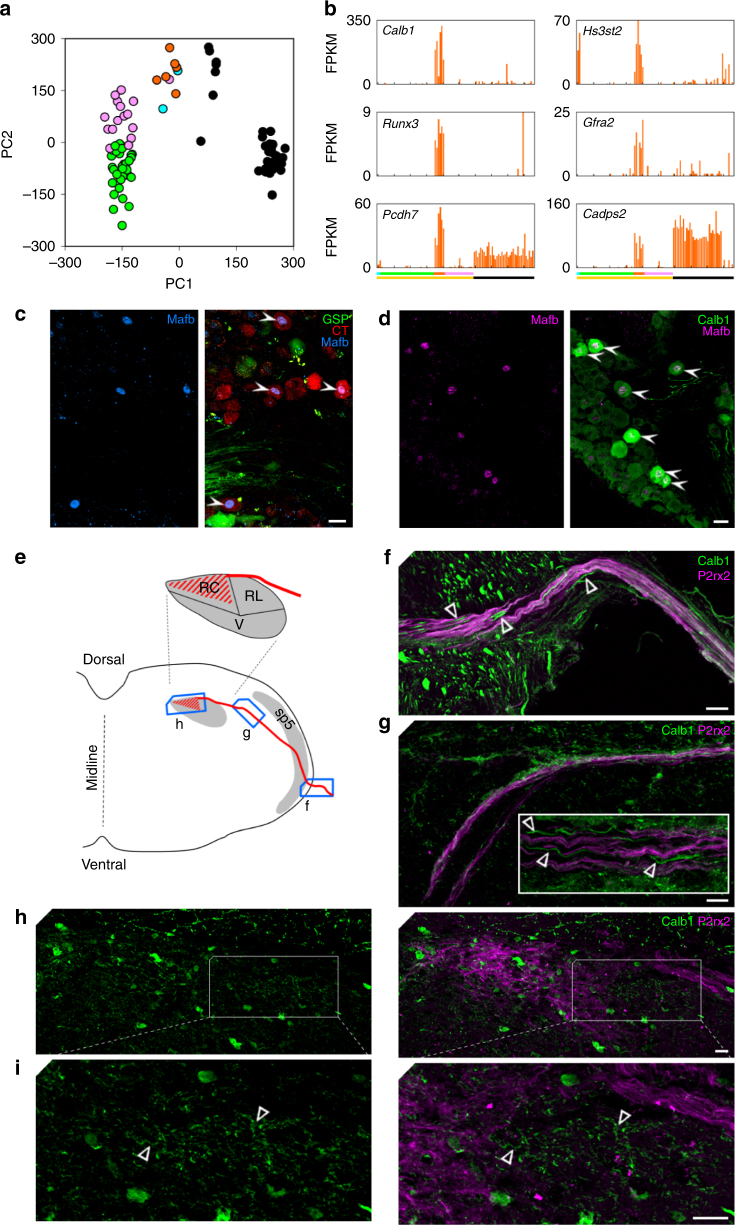
Taste buds are innervated by neurons whose cell bodies reside in cranial sensory ganglia. Studies on the functional properties and connectivity of these neurons are hindered by the lack of markers to define their molecular identities and classes. The mouse geniculate ganglion contains chemosensory neurons innervating lingual and palatal taste buds and somatosensory neurons innervating the pinna. Here, we report single cell RNA sequencing of geniculate ganglion neurons. Using unbiased transcriptome analyses, we show a pronounced separation between two major clusters which, by anterograde labeling, correspond to gustatory and somatosensory neurons. Among the gustatory neurons, three subclusters are present, each with its own complement of transcription factors and neurotransmitter response profiles. The smallest subcluster expresses both gustatory- and mechanosensory-related genes, suggesting a novel type of sensory neuron. We identify several markers to help dissect the functional distinctions among gustatory neurons and address questions regarding target interactions and taste coding.Characterization of gustatory neural pathways has suffered due to a lack of molecular markers. Here, the authors report single cell RNA sequencing and unbiased transcriptome analyses to reveal major distinctions between gustatory and somatosensory neurons and subclusters of gustatory neurons with unique molecular and functional profiles.


Conflict of interest statement

The authors declare that there are no competing financial interests.

Figures

Fig. 1
Fig. 1
Peripheral targets innervated by geniculate ganglion sensory neurons. a. Gustatory afferent fibers from taste buds in anterior tongue and palate (red) and somatosensory fibers innervating the pinna (blue) converge in the geniculate ganglion where their somata reside. b. Cryosection of a geniculate ganglion following anterograde labeling of gustatory nerves (GSP, CT) with tetramethylrhodamine dextran. Taste neurons are red while somatosensory neurons in the ganglion remain unstained. Arrows indicate direction of propagation of sensory signals from peripheral targets. c. A geniculate ganglion neuron in a Fluidigm chip capture site. Several ganglia were dissociated and processed for cell capture (see Methods). 96 such singly captured neurons were sequenced to yield data on neuronal cell types. Scale bars, b, 50 μm c, 20 μm
Fig. 2
Fig. 2
Geniculate ganglion neurons belong to two main groups, gustatory and somatosensory. a. Correlogram and dendrogram resulting from unsupervised hierarchical clustering analysis of 96 geniculate ganglion neurons. Here, genes were selected that displayed average FPKM values ≥ 200 across all 96 cells (i.e. the 333 most highly-expressed genes). The correlogram displays Pearson Correlation Coefficient (PCC) values for each cell against all others on a heat map scale. The dendrogram shown at top and left reveals two major groupings (59 and 37 neurons) which are assigned yellow and black labels, respectively. b. Principal component analysis (PCA) of all 96 geniculate ganglion neurons, based on all 17,225 genes expressed. The upper plot displays a symbol for each of the 96 cells according to their scores on the first two eigenvectors (PC1, PC2) which account for most variance across the set. Individual cells are color-coded yellow and black as in a. It is apparent that cells separate into two principal groupings and that these correspond to the groupings produced by the hierarchical clustering of a much smaller number of genes shown in a. The lower plot shows the PC1 and PC2 loadings, with each detected gene represented by a grey symbol. Genes previously associated with gustatory neurons, Phox2b, P2rx2, and P2rx3 are annotated (yellow) and display similar loadings. Examples of genes which were highly-expressed and are selective for the black group (Fxyd2, Kcns3, and Prrxl1) are also indicated. c. Bar graphs of FPKM values for six group-selective genes identified in b. The neurons are sorted by FPKM values for Phox2b
Fig. 3
Fig. 3
Phox2b and Prrxl1 are markers of gustatory and somatosensory neurons, respectively. a. RT-PCR of single geniculate ganglion neurons confirms that Phox2b and Prrxl1 are expressed in non-overlapping sets of neurons. 24 freshly isolated geniculate ganglion neurons were analyzed by single-cell RT-PCR for Snap25 (positive control), and two test genes. Product from the end-point PCRs is indicated by color in the grid corresponding to each cell. The transcription factor, Phox2b (yellow), previously associated with developing taste neurons, was detected in about half the neurons (11 of 24), but never with Prrxl1 (black). The size of each neuronal soma was observed before harvesting and is depicted schematically in the bottom row. Both groups included neurons of various sizes (18–35 μm diameter). b. Cryosection of geniculate ganglion, immunostained for Phox2b (green) and Prrxl1 (magenta) shows that the two transcription factors define non-overlapping neuronal populations. Inset in each panel is an enlarged view of the boxed area of the ganglion. Only 4 of 1453 nuclei stained for both Phox2b and Prrxl1; 1 nucleus stained for neither (3 mice). c. Gustatory neurons, visualized by anterograde labeling of chorda tympani with TRITC-dextran and greater superficial petrosal with FITC-dextran. Of 537 anterograde labeled neurons, 501 (93%) contained a Phox2b+ nucleus (3 mice). The remaining 7% of neurons can be accounted for as partial profiles that included labeled cytoplasm but lacked the nucleus (because the nucleus occupies only ≈ 80% of the diameter of each cell). d. Gustatory-labeled neurons very seldom included nuclei that immunostained for Prrxl1 (4 of 321 neurons counted in 9 non-adjacent sections from 3 mice). Scale bars, 20μm
Fig. 4
Fig. 4
Gustatory neurons in the geniculate ganglion fall into three sub-clusters. a. The 59 sequenced neurons identified as gustatory (Fig. 2a) were subjected to hierarchical clustering of Pearson Correlation Coefficients based on 580 taste neuron-selective genes (FPKM values ≥ 5-fold higher in gustatory neurons and FPKM ≥ 1, averaged across all 59 gustatory neurons). The dendrogram across the top and left indicate three main sub-clusters, which are assigned colors, T1 green (33 neurons), T2 orange (6 neurons), T3 pink (18 neurons). Two neurons (cyan) at far left do not cluster well with any others. The correlogram displays PCC values for each cell against all others on a heat scale. b. Principal component analysis of the same 59 gustatory neurons, assessed for 8150 genes expressed at significant levels in taste neurons, plotted according to PC1 and PC2 scores. Individual cells are color-coded as indicated by hierarchical clustering in a. Loadings of the 8150 genes from PC1 and PC2 are plotted in the lower scatter plot. Three representative genes selective for each gustatory subcluster are indicated by symbols colored as in a. c. Bar graph of FPKM values for 3 genes that are selectively expressed in each of the 3 gustatory sub-clusters. 59 gustatory neurons are arrayed according to the subgroups assigned by the dendrogram (colors as in a), followed by 37 somatosensory neurons (black, as in Fig. 2a)
Fig. 5
Fig. 5
Transcription factors (TFs) define non-overlapping subclusters of gustatory neurons. a. PCA of 59 gustatory geniculate ganglion neurons, colored as in Fig. 4a, based on expression of 976 TFs (upper plot). Principal component loadings (bottom plot) reveal divergent positions occupied by sub-cluster-selective TFs. b. Expression levels (log2 FPKM) of TFs in all 96 neurons. Gustatory neuron sub-clusters, T1, T2, T3, are green, orange and pink respectively; somatosensory neurons are black. The upper heat map shows expression of 5 gustatory- and 5 somatosensory-selective TFs. The lower heat map shows expression levels for 11 gustatory sub-cluster-selective TFs. c. Immunostaining of a geniculate ganglion for Foxg1 (proposed T1 marker) and Phox2b (gustatory marker). All Foxg1+ neurons counted (243 neurons; 3 mice) were also Phox2b-immunoreactive filled arrowhead; Foxg1+ neurons accounted for 59% of Phox2b+ neurons. d. Immunostaining of a geniculate ganglion with anti-Mafb (proposed T2 marker) and anti-Prrxl1 (somatosensory marker). Mafb-bright nuclei (unfilled triangle) do not overlap with Prrxl1-immunoreactivity (0 of 29 nuclei; 3 mice). However, faint staining for Mafb was also detected in many Prrxl1-positive (i.e. somatosensory) nuclei. e. Immunostaining of a ganglion from a Trhr-GFP mouse (proposed T3 marker) with anti-GFP and anti-Phox2b. 80 of 81 GFP+ neurons (3 mice) contained a Phox2b-immunoreactive nucleus. f. Triple immunostaining for Foxg1, Mafb, and GFP on geniculate ganglia from a Trhr-GFP mouse reveals a mutually exclusive pattern of expression of the three markers. g. Venn diagram of Phox2b, Prrxl1, and NeuN expression based on triple immunofluorescence (expanding on Fig. 3b). Of 1452 NeuN+ nuclei examined (from 3 mice), only 4 were immunoreactive for both Phox2b and Prrxl1 and 1 stained for neither. h. Venn diagram for taste sub-clusters, based on triple immunofluorescence for Mafb, Foxg1 and GFP on geniculate ganglia from Trhr-GFP mice. 570 of 576 cells (3 mice) displayed a non-overlapping pattern of the three markers. i. Bar graphs compare FPKM values for Mafb (T2 neurons) across all sequenced neurons and quantified fluorescence after immunostaining for Mafb. Co-staining with Prrxl1 (as in d) was used to assign neuronal identity to either taste cluster T2 or the somatosensory cluster. All scale bars, 20μm
Fig. 6
Fig. 6
Gustatory neuron sub-clusters and the somatosensory neuron cluster differ in their neurotransmitter phenotype. a. FPKM values for the most prominent purinergic, serotonergic, and GABAergic receptors expressed in 96 sequenced geniculate ganglion neurons. Neurons are arrayed as in Figs. 4a and 5b, with T1 (green), T2 (orange), and T3 (pink) sub-clusters of gustatory neurons followed by somatosensory (black) neurons. b. Heat map based on single-cell RT-qPCR in 38 manually isolated geniculate ganglion neurons. Based on expression pattern for P2rx2, P2xr3, Htr3a, and Gabra1, these neurons were classified post-hoc into the sequencing-derived clusters. c. Geniculate ganglion from Htr3a-GFP mouse reveals that some GFP+ neurons are P2rx2-immunoreactive (filled arrowhead) while other GFP+ neurons lack P2rx2 (Δ). GFP is visualized by native fluorescence, without immunostaining. d. Immunostaining for Gabra1 in a geniculate ganglion from a Htr3a-GFP mouse. The majority of neurons are brightly or faintly immunoreactive for Gabra1, consistent with sequencing data. Occasional neurons that are GFP-bright but lack Gabra1 (unfilled triangle) may represent gustatory sub-cluster T2 or the somatosensory cluster. e. Representative traces from Ca2+ imaging of GCaMP3-expressing geniculate ganglion neurons, acutely dissociated, cultured and stimulated with ATP (10 μM) in the presence or absence of extracellular Ca2+ in the bath. Traces for four neurons that responded (black) to ATP and three that did not (grey) are shown. f. Representative traces showing different patterns of responses from four neurons that were sequentially stimulated with 10 μM ATP, 10 μM 5HT and 50 mM KCl. Superimposed black and grey traces are replicate responses of the same cell. e. HCA of Ca2+ responses in 148 neurons to ATP, 5HT and GABA (3 experiments, 12 ganglia). The dendrogram sorted all 148 neurons into four groups based on patterns of responses. The heat map below the dendrogram shows the magnitude of responses to neurotransmitters (ΔF/F for ATP and 5HT; % inhibition by GABA). 100% inhibition indicates complete loss of KCl response; −100% indicates a 2-fold increase in Ca2+ response to KCl (see Methods and Supplementary Fig. 8d, e). Groupings were re-assigned with RNAseq clusters (colored bars) post-hoc based on the correspondence between response patterns and expression of cognate receptors. All scale bars, 20 µm
Fig. 7
Fig. 7
Htr3a does not mark a natural grouping of neurons. a. Bar graph of FPKM values for Htr3a in 96 sequenced neurons. Bars are colored according to the sub-cluster identity of each neuron according to HCA (Figs. 2a, 4a). b. Cryosection of geniculate ganglion from Htr3a-GFP mouse, immunostained for Prrxl1. Some somatosensory neurons in the ganglion are GFP+ (filled arrowhead). c. Native GFP fluorescence was quantified (using Image J) in Htr3a-GFP ganglion cryosections similar to b. GFP fluorescence intensity is a continuum and is displayed for Prrxl1+ (somatosensory, black) and Prrxl1-negative (gustatory, yellow) neurons. d. Cryosection of ganglion from Htr3a-GFP mouse, immunostained for Foxg1 and Mafb (markers for sub-clusters T1 and T2, respectively). GFP+ neurons are seen with unstained nuclei, with Foxg1-immunoreactive (arrow) or Mafb-immunoreactive (filled arrowhead) nuclei. Here, only the brightest Mafb+ (i.e. T2) neurons can be seen. e. Native fluorescence of GFP was quantified in all neurons in sections similar to d. GFP intensity in T1 and T2 neurons is displayed in colors assigned previously. Bar graphs in a, c and e show that Htr3a expression does not demarcate a specific group of neurons in the ganglion. Scale bars, 20 µm
Fig. 8
Fig. 8
Mechanosensory-like taste neurons of the geniculate ganglion. a. PCA from Fig. 2b, re-colored as assigned in Fig. 4a to display taste sub-clusters, T1, T2, T3, and somatosensory cluster. Neurons of sub-cluster T2 (orange) appear midway between other taste neurons and the somatosensory (black) neurons of the ganglion. b. Expression in all 96 neurons of 4 genes (Calb1, Hs3sT2, Runx3 and Gfra2) that are selectively expressed in T2 neurons, and 2 genes (Pcdh7, Cadps2) that are shared between T2 neurons and somatosensory neurons of the ganglion. Cluster and sub-cluster assignments are indicated below the bar graphs. c. In spite of expressing some somatosensory genes, T2 neurons are bona fide taste neurons as shown by the presence of anterograde labeling dye in the cytoplasm surrounding each Mafb+ nucleus (25 of 27 Mafb+ nuclei counted in 9 sections from 4 mice; filled arrowhead). d. Neurons of sub-cluster T2 (i.e. Mafb+, filled arrowhead) selectively express calbindin 1; few other neurons in the ganglion express this cytosolic protein. We detected this overlapping expression in 21 of 22 Mafb+ neurons in cryosections from 3 mice. e. Schematic of coronal section through hindbrain showing the trajectory of taste fibers in the hindbrain and terminating in the Nucleus of the Solitary Tract (NST, grey inset). Regions within the NST include the rostral-central (RC), rostral-lateral (RL) and ventral (V). Boxes depict the positions of micrographs fh. Calb1+ fibers (unfilled triangle) enter the hindbrain (f) and traverse dorso-medially (g) alongside other taste afferent fibers, most of which are P2rx2-immunoreactive. The T2 fibers are Calb1+ but P2rx2-negative. h. The P2rx2+ neurons produce a triangular terminal field dorsomedially within the NST. The boxed area is shown at higher magnification in i. Terminal arborization of the sparse Calb1+ fibers (unfilled triangle) is most visible immediately lateral to the P2rx2+ terminal field. Scale bar, 20 μm

Similar articles

Cited by

References

    1. Liman ER, Zhang YV, Montell C. Peripheral coding of taste. Neuron. 2014;81:984–1000. doi: 10.1016/j.neuron.2014.02.022. - DOI - PMC - PubMed
    1. Roper SD, Chaudhari N. Taste buds: cells, synapses and signals. Nat. Rev. Neurosci. 2017;18:485–497. doi: 10.1038/nrn.2017.68. - DOI - PMC - PubMed
    1. Lundy RF, Jr., Contreras RJ. Gustatory neuron types in rat geniculate ganglion. J. Neurophysiol. 1999;82:2970–2988. - PubMed
    1. Yokota Y, Bradley RM. Receptive field size, chemical and thermal responses, and fiber conduction velocity of rat chorda tympani geniculate ganglion neurons. J. Neurophysiol. 2016;115:3062–3072. doi: 10.1152/jn.00045.2016. - DOI - PMC - PubMed
    1. Barretto RP, et al. The neural representation of taste quality at the periphery. Nature. 2015;517:373–376. doi: 10.1038/nature13873. - DOI - PMC - PubMed

Publication types

MeSH terms