. 2017 Oct 2;7(1):12556.
doi: 10.1038/s41598-017-12897-0.

HSF1-dependent and -independent regulation of the mammalian in vivo heat shock response and its impairment in Huntington's disease mouse models

Affiliations

HSF1-dependent and -independent regulation of the mammalian in vivo heat shock response and its impairment in Huntington's disease mouse models

Andreas Neueder et al. Sci Rep. .

Abstract

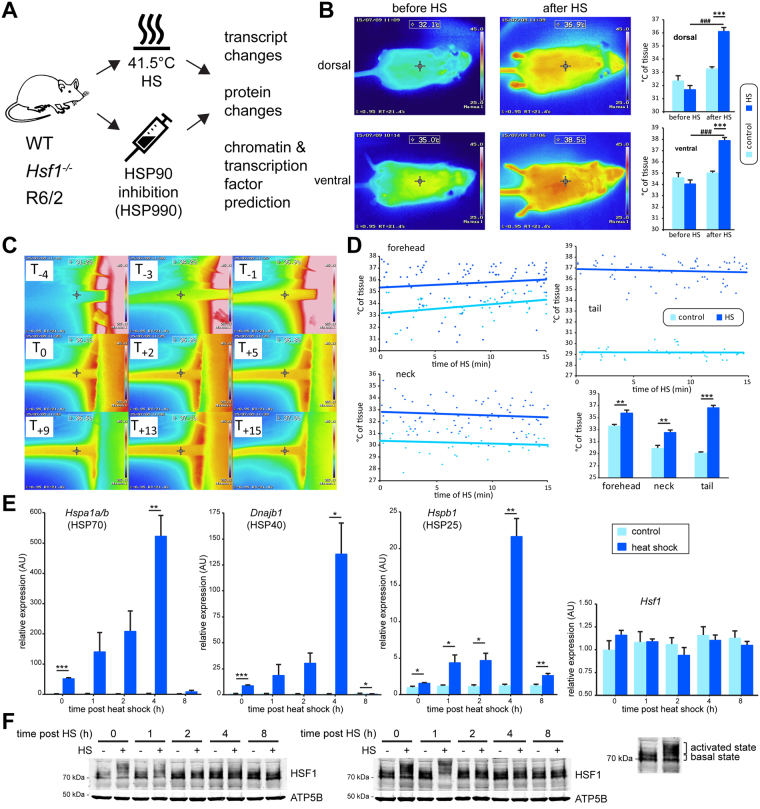
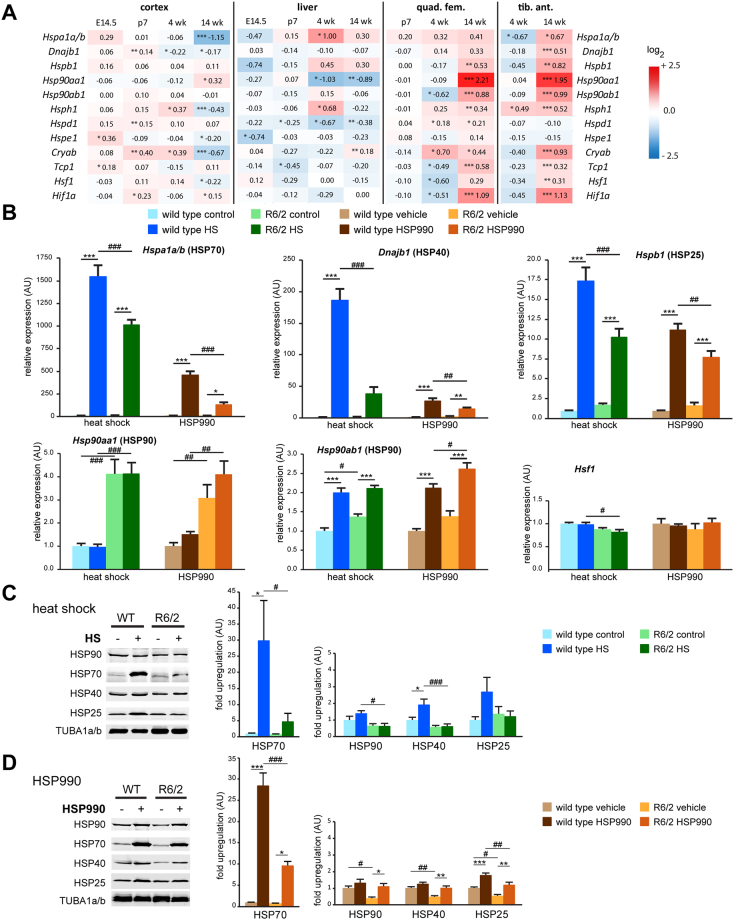
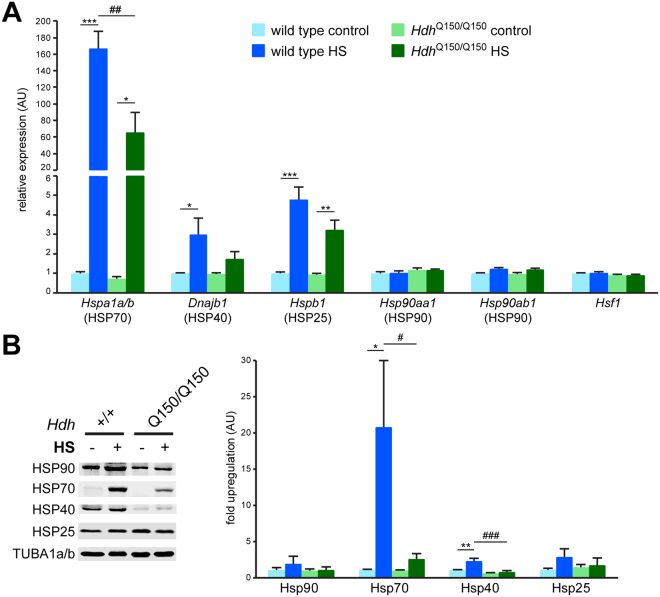
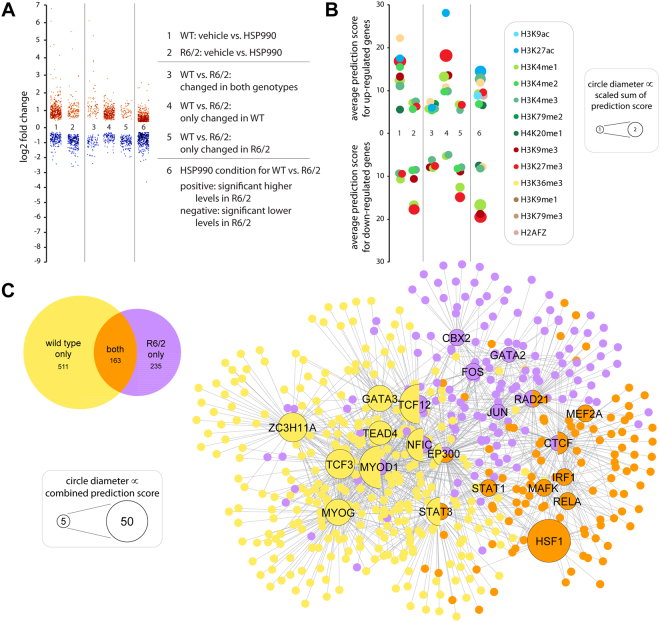
The heat shock response (HSR) is a mechanism to cope with proteotoxic stress by inducing the expression of molecular chaperones and other heat shock response genes. The HSR is evolutionarily well conserved and has been widely studied in bacteria, cell lines and lower eukaryotic model organisms. However, mechanistic insights into the HSR in higher eukaryotes, in particular in mammals, are limited. We have developed an in vivo heat shock protocol to analyze the HSR in mice and dissected heat shock factor 1 (HSF1)-dependent and -independent pathways. Whilst the induction of proteostasis-related genes was dependent on HSF1, the regulation of circadian function related genes, indicating that the circadian clock oscillators have been reset, was independent of its presence. Furthermore, we demonstrate that the in vivo HSR is impaired in mouse models of Huntington's disease but we were unable to corroborate the general repression of transcription that follows a heat shock in lower eukaryotes.


Conflict of interest statement

The authors declare that they have no competing interests.

Figures

Figure 1
Figure 1
Development of an in vivo heat shock protocol. (A) Schematic depicting the treatment and processing pipeline used in this publication. WT = wild type; Hsf1 −/− = Hsf1 homozygous knockout mice; R6/2 = mouse model for Huntington’s disease. (B) Thermal camera images of exemplary mice before or after heat shock from the dorsal and ventral side. Control mice (control) were kept at 36.9 °C; heat shocked mice (HS) were subjected to a 15 minute heat shock at 41.5 °C. Quantification of the data is shown (right panel). Data are mean ± SEM; n ≥ 4; two-way ANOVA with Tukey post hoc test. (C) Time course of tail temperature (mins) from start of the procedure (T-4), beginning of the 15 minutes (T0) until the end of the heat shock (T+15). (D) Temperature differences as measured by thermal camera imaging between control and heat shocked animals. Quantification (lower right panel) was done by calculating the average temperature for each mouse across the treatment. Data are mean ± SEM; n ≥ 4 for forehead and neck, n ≥ 3 for tail; two-tailed homoscedastic Student’s t-test. (E) Kinetics of transcript induction of 3 HSP genes (Hspa1a/b, Dnajb1, Hspb1) and Hsf1 from 0 to 8 hours after heat shock in quadriceps femoris muscle of 12 week old wild type mice. Data are mean ± SEM relative to the expression levels of each gene in the respective untreated group at 0 hours; n = 4; two-tailed homoscedastic Student’s t-test. (F) HSF1 protein analysis of the same samples as in (E). Both panel shows exemplary results for each time point. ATP5B was used as a loading control. Treatment: *p < 0.05, **p < 0.01, ***p < 0.001 and pre- / post-HS ### p < 0.001.
Figure 2
Figure 2
The heat shock response is impaired in the R6/2 mouse model of Huntington’s disease. (A) Heat map showing the basal transcript levels of several heat shock response genes and regulators in cortex, liver, quadriceps femoris (quad. fem.) and tibialis anterior (tib. ant.) muscles at different stages (E14.5 = embryonic day 14.5; p7 = postnatal day 7; wk = weeks). Data are the log2 fold changes of R6/2 vs. wild type mice. Data are mean ± SEM; n = 4; two-tailed homoscedastic Student’s t-test. Genotype: *p < 0.05, **p < 0.01, ***p < 0.001. (B) Transcript induction at 4 hours after heat shock or HSP90 inhibition (HSP990) in quadriceps femoris muscle of R6/2 and wild type mice at 12 week of age. Data are mean ± SEM relative to the levels of control or vehicle treated wild type animals; n ≥ 6; two-way ANOVA with Tukey post hoc test. (C and D) Heat shock protein induction at 24 hours after heat shock (HS) (C) or HSP90 inhibition (HSP990) (D) in quadriceps femoris muscle of R6/2 and wild type mice at 12 week of age. Data are mean ± SEM relative to the levels of control or vehicle treated wild type animals; n ≥ 6; two-way ANOVA with Tukey post hoc test. TUBA1a/b was used as a loading control. (B,C and D) Treatment: *p < 0.05, **p < 0.01, ***p < 0.001 and treatment/genotype # p < 0.05, ## p < 0.01, ### p < 0.001.
Figure 3
Figure 3
The heat shock response is impaired in the HdhQ150 mouse model of Huntington’s disease. (A) Transcript induction at 4 hours after heat shock in quadriceps femoris muscle of homozygous HdhQ150 and wild type mice at 21-22 months of age. Data are mean ± SEM relative to the levels of control wild type animals; n ≥ 5; two-way ANOVA with Tukey post hoc test. (B) Heat shock protein induction at 24 hours after heat shock in quadriceps femoris muscle of homozygous HdhQ150 (Q150/Q150) and wild type (+/+) mice at 21–22 months of age. Data are mean ± SEM relative to the levels of control wild type animals; n ≥ 4; two-way ANOVA with Tukey post hoc test. TUBA1a/b was used as a loading control. Treatment: *p < 0.05, **p < 0.01, ***p < 0.001 and treatment/genotype # p < 0.05, ## p < 0.01, ### p < 0.001.
Figure 4
Figure 4
Differential systemic response to HSP90 inhibition in R6/2 compared to wild type mice. (A) Scatter plot showing the significant log2 fold changes at 4 hours after HSP90 inhibition (HSP990) in quadriceps femoris muscle of R6/2 and wild type mice at 12 week of age. Each dot represents a gene. Lanes 1 and 2 represent the significantly regulated genes through HSP90 inhibition in R6/2 or wild type mice. Lanes 3 to 5 show the common (lane 3) and distinct (lanes 4 and 5) responses to treatment. Lane 6 compares HSP990 treated R6/2 with HSP990 treated wild type mice. Here, we corrected for differences due to the genotype by subtracting the log2 fold changes of significantly different genes (genotype) from their log2 induction value (HSP990). Only genes with a resulting fold change of ≥1.25 were considered for further analysis. (B) Chromatin mark predictions for genes shown in (A). Only significantly enriched chromatin marks (p < 0.001) were considered. We used the combined score, which is the product of the p-value with the z-score of the deviation from the expected rank, as a measure for prediction quality. Together, the average (y-axis) and the sum (circle diameter) of the combined scores are a good indicator of the confidence of the chromatin mark predictions. (C) Venn diagram and transcription factor network of common and distinct responses to HSP90 inhibition in R6/2 and wild type mice. Data correspond to lanes 3, 4 and 5 in (A) and (B). Numbers indicate the number of significantly regulated genes. To predict upstream regulators, we created gene lists for significantly regulated (up and down combined) genes for each condition and used the ENCODE transcription factor ChIP-seq database (2015) to identify the significantly enriched transcription factors (n ≤ 10 with a combined score of ≥ 5). Circle diameter is an indicator of the confidence of the predictions. See also Figures S2, S5 and S6.
Figure 5
Figure 5
Differential systemic response to heat shock in Hsf1 knockout compared to wild type mice. (A) Scatter plot as described in Fig. 4A showing the log2 fold transcriptome wide changes at 4 hours after heat shock (HS) in quadriceps femoris muscle of Hsf1 knockout (Hsf1 −/−) and wild type mice at 10–12 week of age. (B) Chromatin mark predictions for genes shown in (A). Chromatin Marks prediction was as described in Fig. 4B. (C) Venn diagram and transcription factor network of common and distinct responses to heat shock in Hsf1 knockout and wild type mice. Data correspond to lanes 3, 4 and 5 in (A) and (B). Upstream regulator prediction was as described in Fig. 4B.

Similar articles

Cited by

References

    1. Neueder A, Achilli F, Moussaoui S, Bates GP. Novel isoforms of heat shock transcription factor 1, HSF1gammaalpha and HSF1gammabeta, regulate chaperone protein gene transcription. The Journal of biological chemistry. 2014;289:19894–19906. doi: 10.1074/jbc.M114.570739. - DOI - PMC - PubMed
    1. Vihervaara A, Sistonen L. HSF1 at a glance. Journal of cell science. 2014;127:261–266. doi: 10.1242/jcs.132605. - DOI - PubMed
    1. Leak RK. Heat shock proteins in neurodegenerative disorders and aging. Journal of cell communication and signaling. 2014;8:293–310. doi: 10.1007/s12079-014-0243-9. - DOI - PMC - PubMed
    1. Roth DM, et al. Modulation of the maladaptive stress response to manage diseases of protein folding. PLoS biology. 2014;12:e1001998. doi: 10.1371/journal.pbio.1001998. - DOI - PMC - PubMed
    1. Duennwald, M. L. Cellular stress responses in protein misfolding diseases. Future Science OA1, 10.4155/fso.15.42 (2015). - PMC - PubMed

Publication types

Substances