. 2017 Oct 2;7(1):12562.
doi: 10.1038/s41598-017-12952-w.

Development of African swine fever epidemic among wild boar in Estonia - two different areas in the epidemiological focus

Affiliations

Development of African swine fever epidemic among wild boar in Estonia - two different areas in the epidemiological focus

Imbi Nurmoja et al. Sci Rep. .

Abstract

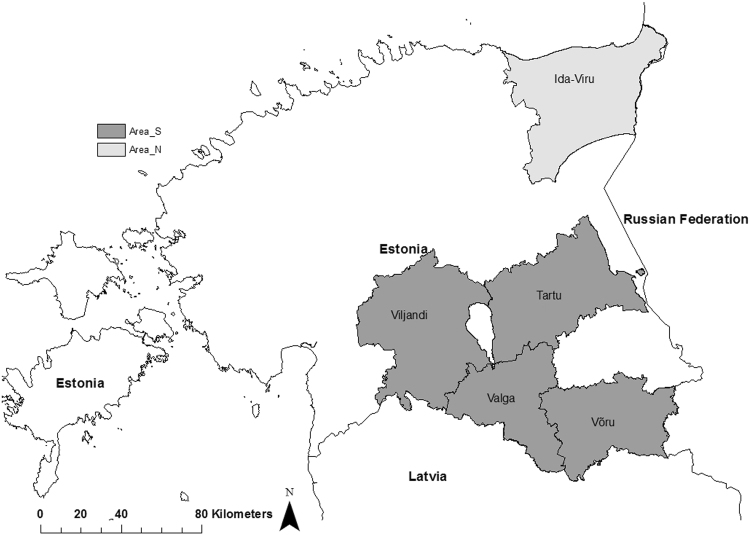
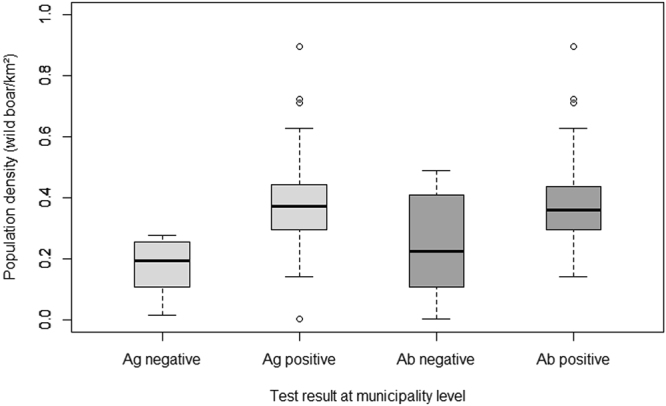
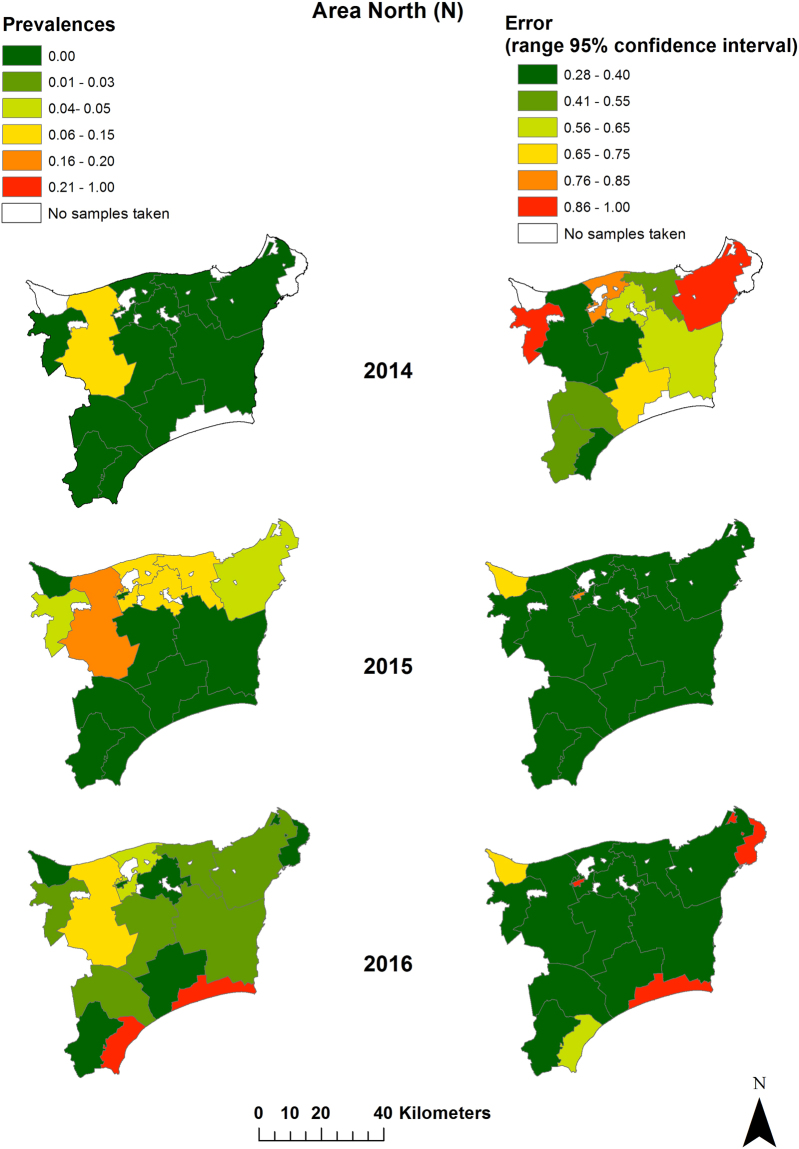
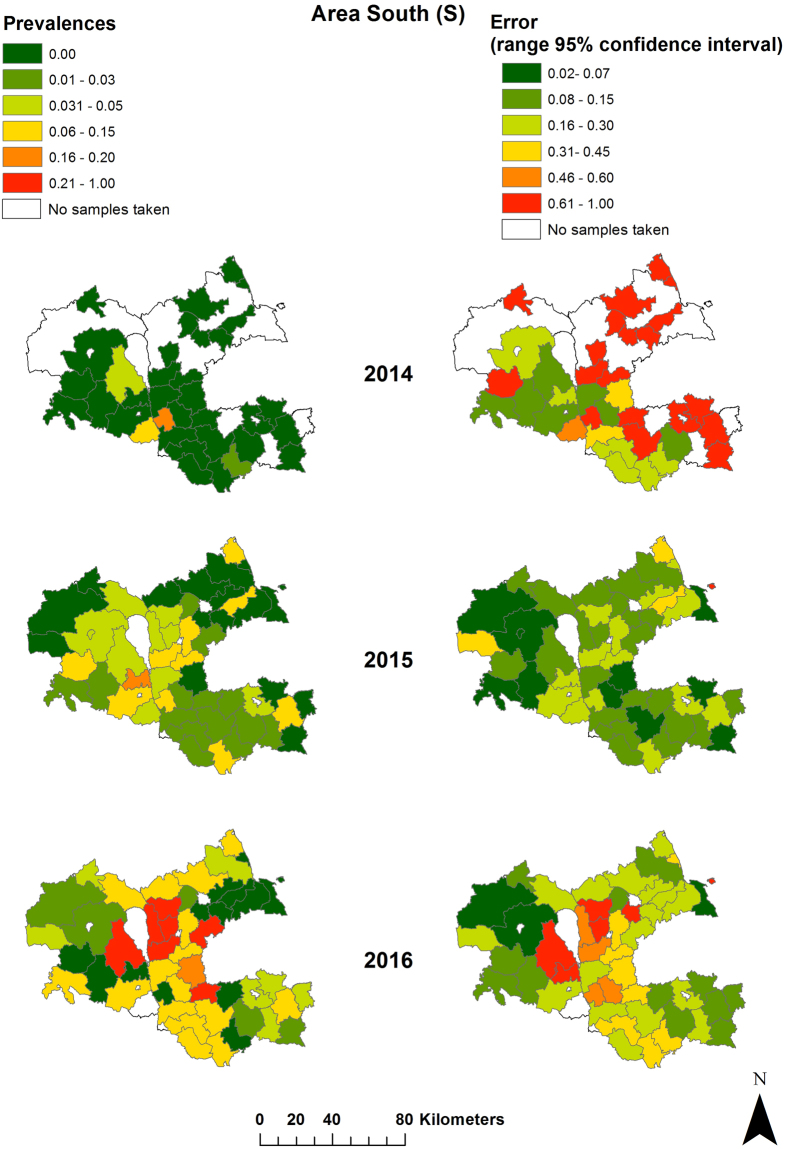
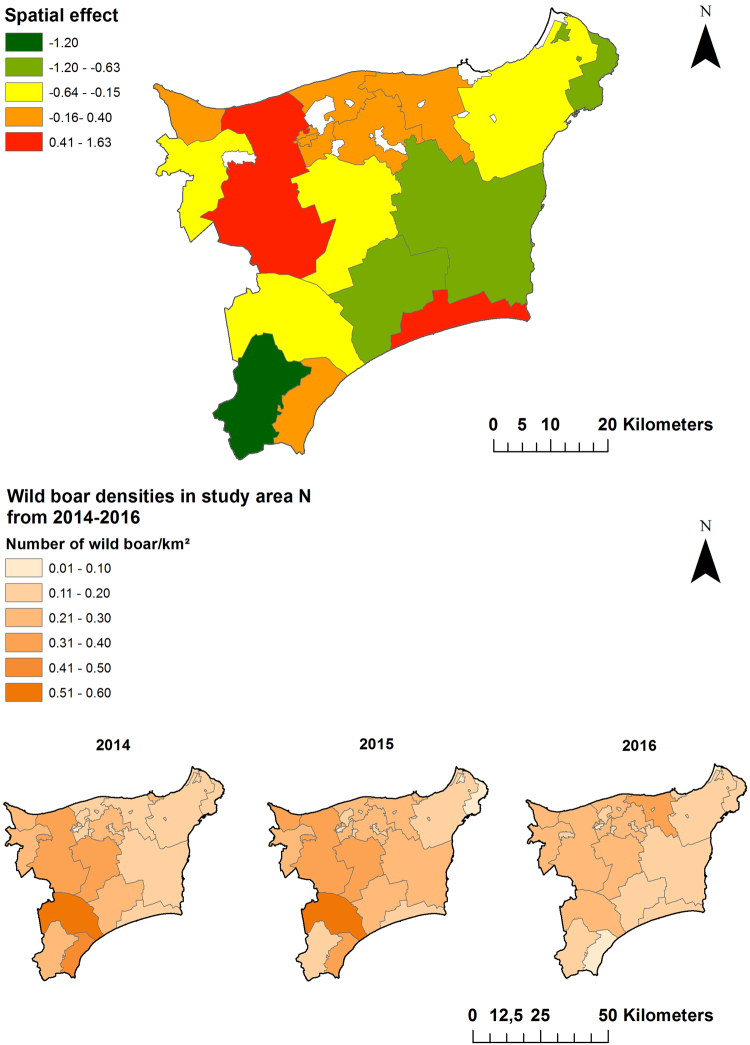
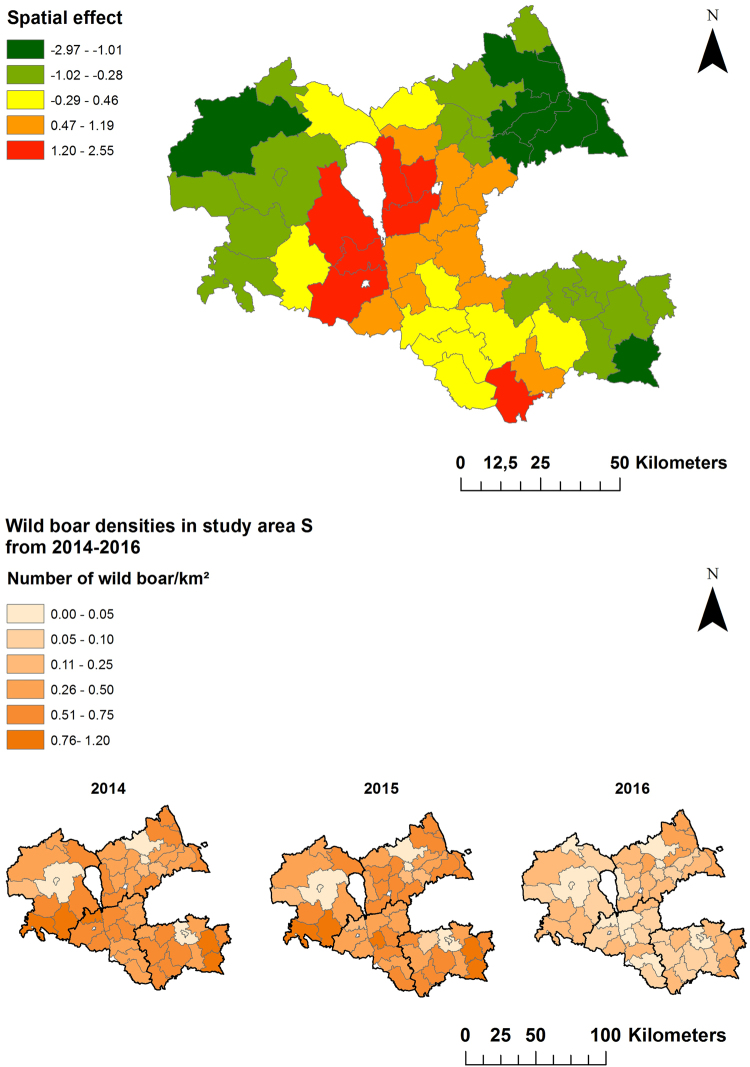
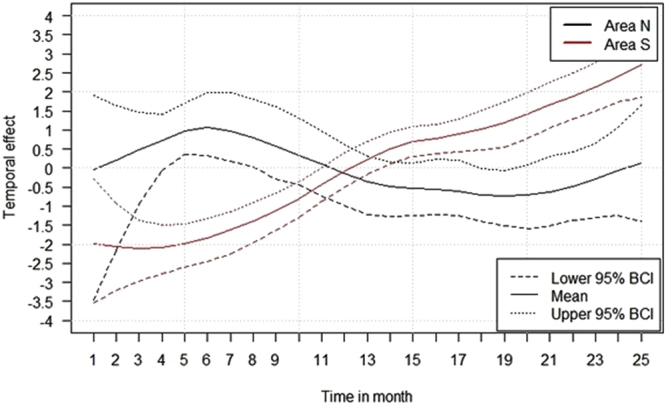
African swine fever (ASF) in wild boar emerged in Estonia for the first time in September 2014. The first affected region was located in the South of Estonia close to the border with Latvia. It was considered to be epidemiologically connected to the outbreaks in the North of Latvia. About two weeks later, cases were detected in the North of Estonia, close to the Russian border. In the present study, we aimed to investigate the epidemiological courses of the disease in the South and in the North of Estonia. Potential associations between risk factors and the laboratory test results for ASF were examined. A hierarchical Bayesian space-time model was used to analyze the temporal trend of the ASF seroprevalence in the two areas. Young wild boar were statistically significant more likely to be ASF-positive by both, serology and virus detection, than older animals. A statistically significant difference between the two areas in the temporal course of the seroprevalence was found. While the seroprevalence clearly increased in the South, it remained relatively constant in the North. These findings led to the hypothesis that ASF might have been introduced earlier into the North of Estonia then into the South of the country.


Conflict of interest statement

The authors declare that they have no competing interests.

Figures

Figure 1
Figure 1
The study areas and the bordering countries in the South and East. Highlighted areas illustrate the four included counties in the South (area S) and the one in the Northeast of Estonia (area N). Map was generated by using ArcGIS ArcMap 10.3.1 (ESRI, Redlands, CA, USA, http://www.esri.com/).
Figure 2
Figure 2
Population density (number of wild boar/km²) in the municipalities of the study areas stratified by the virological and serological test result at the municipality level. Ag: ASFV genome detection, Ab: antibody detection. Figure was generated by using the software package R (http://www.r-project.org).
Figure 3
Figure 3
Seroprevalences and 95% confidence intervals for sampled wild boar per municipality in study area N (Ida-Viru county) in 2014 (Sept. – Dec.), 2015 (Jan. – Dec.) and 2016 (Jan. – Sept.). Maps were generated by using ArcGIS ArcMap 10.3.1 (ESRI, Redlands, CA, USA, http://www.esri.com/).
Figure 4
Figure 4
Seroprevalences and 95% confidence intervals for sampled wild boar per municipality in study area S (Viljandi, Tartu, Valga and Voru county) 2014 (Sept. – Dec.), 2015 (Jan. – Dec.) and 2016 (Jan. – Sept.). Maps were generated by using ArcGIS ArcMap 10.3.1 (ESRI, Redlands, CA, USA, http://www.esri.com/).
Figure 5
Figure 5
Median-structured spatial effect on the logit prevalence per municipality in study area N (Ida-Viru county) for the study period of 25 months. Maps in the lower row show the population density (number of wild boar/km²) for each municipality in study area N. Maps were generated by using ArcGIS ArcMap 10.3.1 (ESRI, Redlands, CA, USA, http://www.esri.com/).
Figure 6
Figure 6
Median-structured spatial effect on the logit prevalence per municipality in study area S (Viljandi, Tartu, Valga and Voru county) for the study period of 25 months. Maps in the lower row show the population density (number of wild boar/km²) for each municipality in area S. Maps were generated by using ArcGIS ArcMap 10.3.1 (ESRI, Redlands, CA, USA, http://www.esri.com/).
Figure 7
Figure 7
Median temporal effect on the logit prevalence in area North (N) and in area South (S) for the study period of 25 months. 95% Bayesian credible intervals (BCI) are included. Figure was generated by using the software package R (http://www.r-project.org).

References

    1. Penrith ML, Vosloo W. Review of African swine fever: transmission, spread and control. Journal of the South African Veterinary Association-Tydskrif Van Die Suid-Afrikaanse Veterinere Vereniging. 2009;80:58–62. - PubMed
    1. Sanchez-Vizcaino JM, Mur L, Martinez-Lopez B. African Swine Fever: An Epidemiological Update. Transboundary and Emerging Diseases. 2012;59:27–35. doi: 10.1111/j.1865-1682.2011.01293.x. - DOI - PubMed
    1. Gogin A, Gerasimov V, Malogolovkin A, Kolbasov D. African swine fever in the North Caucasus region and the Russian Federation in years 2007-2012. Virus Research. 2013;173:198–203. doi: 10.1016/j.virusres.2012.12.007. - DOI - PubMed
    1. Khomenko, S. et al. African Swine Fever in the Russian Federation: Risk Factors for Europe and Beyond. EMPRES Watch, 28 (2013).
    1. Gallardo C, et al. Genetic Variation among African Swine Fever Genotype II Viruses, Eastern and Central Europe. Emerging Infectious Diseases. 2014;20:1544–1547. doi: 10.3201/eid2009.140554. - DOI - PMC - PubMed

LinkOut - more resources