. 2017 Jan 5;27(1):1604281.
doi: 10.1002/adfm.201604281. Epub 2016 Nov 2.

Engineered elastomer substrates for guided assembly of complex 3D mesostructures by spatially nonuniform compressive buckling

Affiliations

Engineered elastomer substrates for guided assembly of complex 3D mesostructures by spatially nonuniform compressive buckling

Kewang Nan et al. Adv Funct Mater. .

Abstract

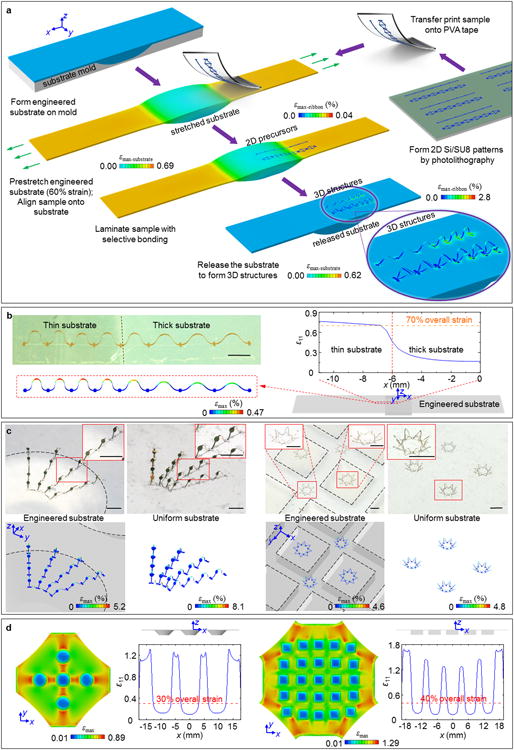
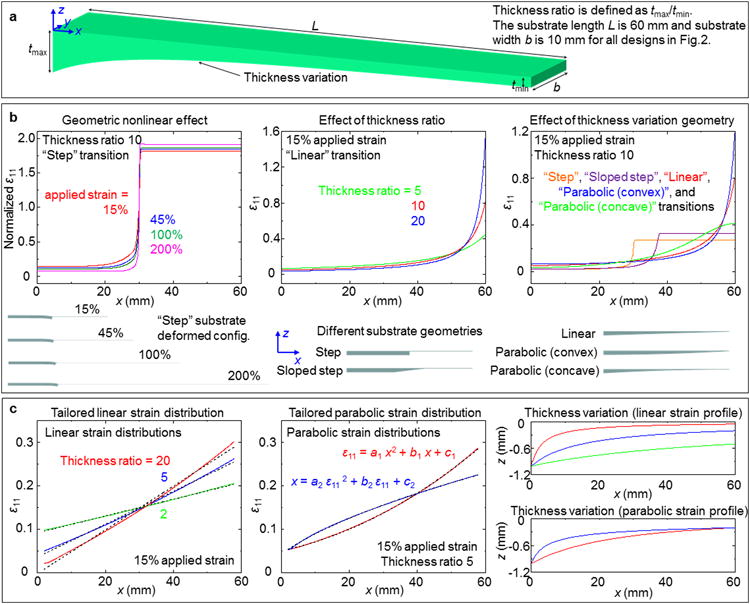
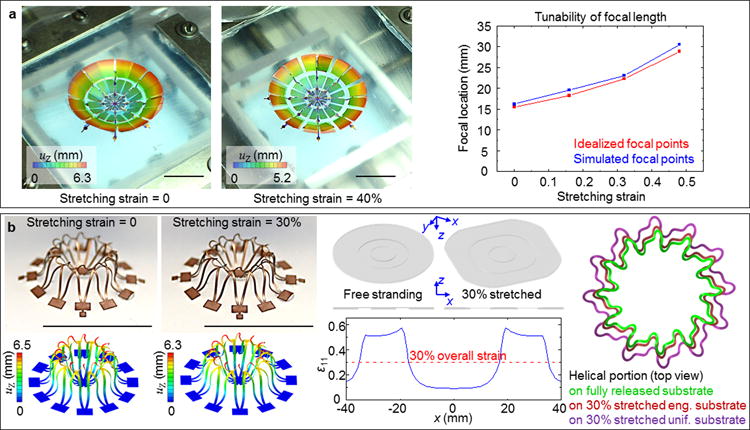
Approaches capable of creating three-dimensional (3D) mesostructures in advanced materials (device-grade semiconductors, electroactive polymers etc.) are of increasing interest in modern materials research. A versatile set of approaches exploits transformation of planar precursors into 3D architectures through the action of compressive forces associated with release of prestrain in a supporting elastomer substrate. Although a diverse set of 3D structures can be realized in nearly any class of material in this way, all previously reported demonstrations lack the ability to vary the degree of compression imparted to different regions of the 2D precursor, thus constraining the diversity of 3D geometries. This paper presents a set of ideas in materials and mechanics in which elastomeric substrates with engineered distributions of thickness yield desired strain distributions for targeted control over resultant 3D mesostructures geometries. This approach is compatible with a broad range of advanced functional materials from device-grade semiconductors to commercially available thin films, over length scales from tens of microns to several millimeters. A wide range of 3D structures can be produced in this way, some of which have direct relevance to applications in tunable optics and stretchable electronics.

Keywords: compressive buckling; soft elastomers; strain engineering; three-dimensional assembly.


Figures

Figure 1
Figure 1. A general illustration of the process for 3D assembly by buckling induced by non-uniform distributions of strain and examples of resulting 3D mesostructures
(a) Finite-element analysis (FEA) illustration of assembly of 3D structures via release of pre-stretched elastomer substrates with engineered variations in thickness. This example involves uniaxial strain in a strip of material with a thick region near the center. The magnified view highlights spatial variations in the amplitudes and periodicities of 3D structures that form as a result of buckling induced geometry transformations from 2D precursors. These variations follow from spatially non-uniform strains associated with thickness differences in elastomer substrate. Detailed fabrication procedures appear in Experimental Sections and Figure S3 and S5 (Supporting Information). (b) Optical image of a 3D strucure in a ribbon of monocrystalline silicon via use of a thickness engineered substrate (top left), corresponding FEA results (bottom left), and magnitude of the x-direction normal strain for an overall applied uniaxial strain of 70% (right). (c) Optical images of a radially-distributed, interconnected array of table structures (left) and a 2-by-2 array of eight-pointed star strucures (right) formed using engineered substrates. The dashed lines indicate outlines of boundaries between regions of different thickness across the substrates. The adjacent optical images show 3D structures formed using the same 2D precursors but using substrates with uniform thicknesses, and their corresponding FEA results (bottom). (d) FEA result showing a top view of the distribution of εmax in each engineered substrate while stretched (with central part shown) in (c), as well as a side view in the unstretched state. Also shown is the magnitude of x-direction normal strain for given overall applied strains. In all cases, the colors in the FEA results indicate maximum principal strain εmax distributions in the 3D structures and/or engineered substrates. Engineered substrates in (b) and (c) are shown with 30% translucency. Scale bars, 1000 μm.
Figure 2
Figure 2. Modeling studies of the influence of various parameters on spatial distributions of strain in engineered substrates
(a) Schematic illustration of engineered substrates with uni-directional variations in thickness. (b) Effect of geometric nonlinearity on strain distributions in a ‘step’ substrate at four different uniaxial levels of strain (left), effect of thickness ratios (5, 10 and 20) on strain distributions in ‘linear transition’ substrates at 15% applied strain (middle), and effect of substrate geometries (step, sloped step, linear, convex parabolic, and concave parabolic) on distributions of strain distributions at 15% applied (overall) strain (right). Side views of the corresponding engineered substrates in their unstrained states appear at the bottom bottom. (c) Inverse design results for linear (left) and parabolic (middle) distributions of strain enabled by optimized variations in thickness, with fitted lines shown in black dashes for comparison, and thickness as a function of position for each inverse design (right).
Figure 3
Figure 3. Experimental and theoretical studies of spatial distributions of strain in several represenative engineered substrates
(a) Schematic illustraiton of a ‘chessboard’ engineered substrate, with a magnified view of a unit cell in the lower right. Schematic top and side view illustrations and FEA results for different types of unit cells at 40% biaxial strain appear on the right. (b) Optical images of strain visualization studies on the ‘chessboard’ substrate shown in the left part of (a), at applied biaxial strains of 0, 40%, 60% and 80%. Magnified views of the regions with displacement markers are in the lower right. (c) Contour plots of different strain components (ε22, ε12, and εmax) for the ‘chessboard’ substrate generated from experiments (left) and FEA (right). Colors in each contour plot display the magnitudes and directions of strain, where negative values in shear strain indicate a change in direction. Applied biaxial strains are 60% for all cases. (d) Optical images of three more substrates (see ‘elliptical’,‘diamond’ and ‘triangular’ arrays in Figure S12, Supporting Information, for details) stretched by 60% biaxial strain (top), and contour plots of ε22 generated from experiments (bottom left) and FEA (bottom right). Scale bars, 2 cm.
Figure 4
Figure 4. Various 3D structures enbabled by compressive buckling induced by spatially non-uniform strains in engineered substrates
(a) Optical image of arrays of 3D ribbon structures made of silicon with a spatial gradient in key geometric features (left), and corresponding FEA results (right). (b) Optical image of related 3D structures made of thin films plastic with an abrupt change in key geometric features (left), and corresponding FEA results (right). (c) FEA results showing the side view of the structure shown in (a), and the magnitude of the x-direction normal strain for a 60% applied uniaxial strain. (d) FEA results showing the side view of the structure shown in (b), and the magnitude of x-direction normal strain for a 22% applied uniaxial strain. (e) Optical images of 3D structures made of bilayers of metal gold and photodefined patterns of epoxy (SU8) (top), and corresponding FEA results, including illustrations of the substrate geometries (bottom; only the central part of substrate is shown). The insets shows magnified SEM views of the regions identified with red boxes in each optical image. Experimental and FEA results of 3D structures formed using the same 2D precursors but with uniform substrates are on the right. (f) FEA results for the engineered substrates (only central part shown) before and after 49% biaxial stretching (left), and magnitude of normal strain ε11 for a 49% applied biaxial strain (right). The colors indicate the maximum principal strains in the structures for (a) and (e), and the magnitude of out-of-plane displacements for (b). Engineered substrates in (a), (b) and (e) are shown with 30% translucency. Scale bars in (a), 500 μm. Scale bars in (b), 1 cm. Scale bars in (e), 1000 μm.
Figure 5
Figure 5. 3D structures with potential utility in tunable optics and stretchable electronics
(a) A 3D concave mirror enabled by assembly using engineered substrates. The left two frames show overlaid experimental and FEA images of structure at 0 and 40% biaxial strain. The right frame shows change of simulated focal locations as a function of stretching levels, and comparison with ideal focal locations for the corresponding fitted concave surfaces. (b) A 3D helical coil elevated from the substrate. The left two frames show the experimental and FEA results of the structure at 0 and 30% strains. The middle frames show 3D and cross-sectional views of the substrate, as well as the magnitude of the x-direction normal strain for 30% applied biaxial strain. The right frame shows a top view of the helical coil upon 30% biaxial stretching, with and without the use of an engineered substrate. The colors in the FEA results indicate the magnitude of out-of-plane displacements. Engineered substrates in (b) are shown with 30% translucency. Scale bars, 1 cm.

Similar articles

Cited by

References

    1. Shenoy VB, Gracias DH. MRS Bull. 2012;37:847.
    1. Damasceno PF, Engel M, Glotzer SC. Science. 2012;337:453. - PubMed
    1. Crane NB, Onen O, Carballo J, Ni Q, Guldiken R. Microfl Nanofl. 2013;14:383.
    1. Noorduin WL, Grinthal A, Mahadevan L, Aizenberg J. Science. 2013;340:832. - PubMed
    1. Huang M, Cavallo F, Liu F, Lagally MG. Nanoscale. 2011;3:96. - PubMed