

A porcine in-vivo model of acute pulmonary embolism
- PMID: 28971735
- PMCID: PMC5798692
- DOI: 10.1177/2045893217738217
A porcine in-vivo model of acute pulmonary embolism
Abstract
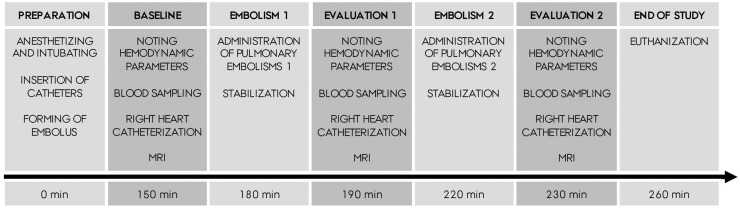
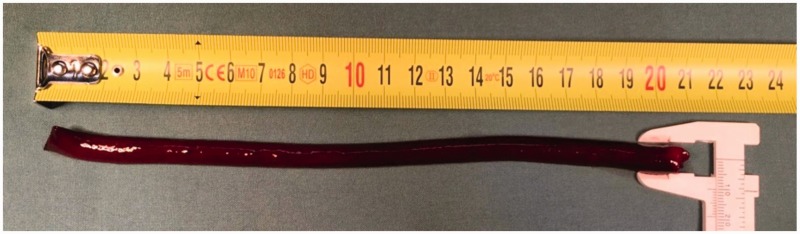
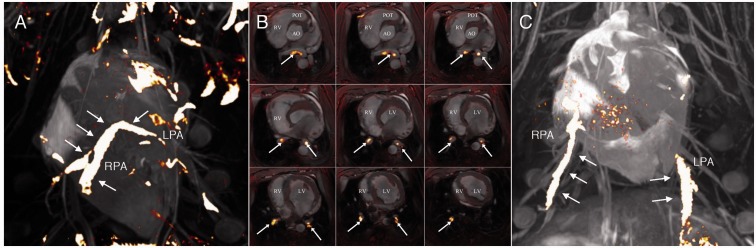
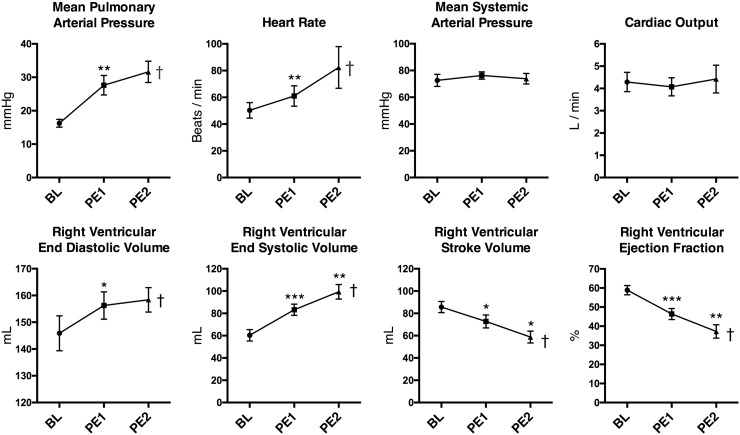
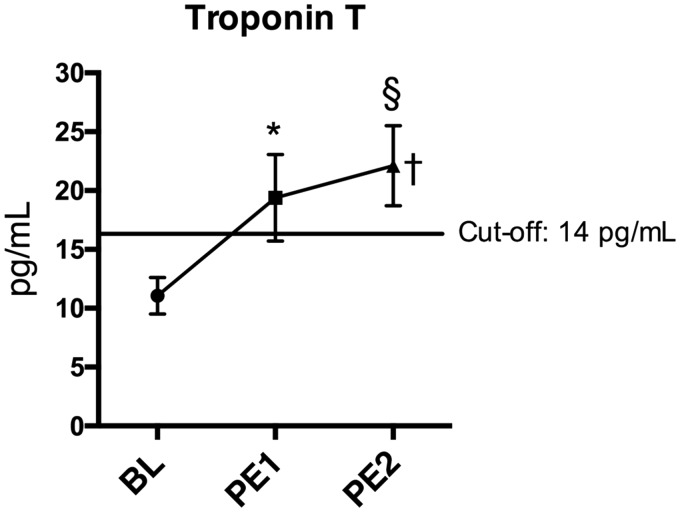
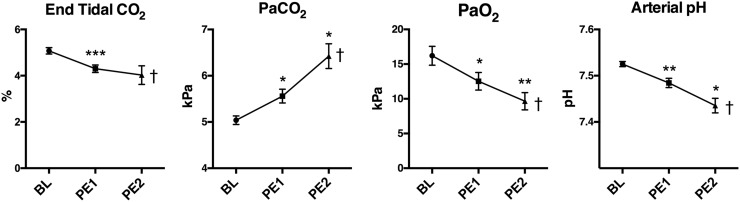
Acute pulmonary embolism (PE) is the third most common cardiovascular cause of death after acute myocardial infarction and stroke. Patients are, however, often under-treated due to the risks associated with systemic thrombolysis and surgical embolectomy. Novel pharmacological and catheter-based treatment strategies show promise, but the data supporting their use in patients are sparse. We therefore aimed to develop an in vivo model of acute PE enabling controlled evaluations of efficacy and safety of novel therapies. Danish Landrace pigs (n = 8) were anaesthetized and mechanically ventilated. Two pre-formed autologous PEs (PE1, PE2, 20 × 1 cm) were administered consecutively via the right external jugular vein. The intact nature and central location were visualized in situ by magnetic resonance imaging (MRI). The hemodynamic and biochemical responses were evaluated at baseline (BL) and after each PE by invasive pressure measurements, MRI, plus arterial and venous blood analysis. Pulmonary arterial pressure increased after administration of the PEs (BL: 16.3 ± 1.2, PE1: 27.6 ± 2.9, PE2: 31.6 ± 3.1 mmHg, BL vs. PE1: P = 0.0027, PE1 vs. PE2: P = 0.22). Animals showed signs of right ventricular strain evident by increased end systolic volume (BL: 60.9 ± 5.1, PE1: 83.3 ± 5.0, PE2: 99.4 ± 6.5 mL, BL vs. PE1: P = 0.0005, PE1 vs. PE2: P = 0.0045) and increased plasma levels of Troponin T. Ejection fraction decreased (BL: 58.9 ± 2.4, PE1: 46.4 ± 2.9, PE2: 37.3 ± 3.5%, BL vs. PE1: p = 0.0008, PE1 vs. PE2: P = 0.009) with a compensatory increase in heart rate preserving cardiac output and systemic blood pressure. The hemodynamic and biochemical responses were comparable to that of patients suffering from intermediate-high-risk PE. This porcine model mirrors the anatomical and physiologic changes seen in human patients with intermediate-high-risk PE, and may enable testing of future therapies for this disease.
Keywords: animal models; catheterization; magnetic resonance imaging; pig.
Figures
References
-
- Cohen AT, Agnelli G, Anderson FA, et al. Venous thromboembolism (VTE) in Europe. The number of VTE events and associated morbidity and mortality. Thromb Haemost 2007; 98: 756–764. - PubMed
-
- Goldhaber SZ, Bounameaux H. Pulmonary embolism and deep vein thrombosis. Lancet 2012; 379: 1835–1846. - PubMed
-
- Konstantinides SV, Agnelli G, et al. Authors/Task Force Members. 2014 ESC Guidelines on the diagnosis and management of acute pulmonary embolism: The Task Force for the Diagnosis and Management of Acute Pulmonary Embolism of the European Society of Cardiology (ESC) * * Endorsed by the European Respiratory Society (ERS). Eur Heart J 2014; 35: 3033–3073. - PubMed
-
- Konstantinides S, Tiede N, Geibel A, et al. Comparison of alteplase versus heparin for resolution of major pulmonary embolism. Am J Cardiol 1998; 82: 966–970. - PubMed
-
- Goldhaber SZ, Haire WD, Feldstein ML, et al. Alteplase versus heparin in acute pulmonary embolism: randomised trial assessing right-ventricular function and pulmonary perfusion. Lancet 1993; 341: 507–511. - PubMed
LinkOut - more resources
Full Text Sources
Other Literature Sources
Molecular Biology Databases
