

Differential localization and anabolic responsiveness of mTOR complexes in human skeletal muscle in response to feeding and exercise
- PMID: 28971834
- PMCID: PMC5814591
- DOI: 10.1152/ajpcell.00176.2017
Differential localization and anabolic responsiveness of mTOR complexes in human skeletal muscle in response to feeding and exercise
Abstract
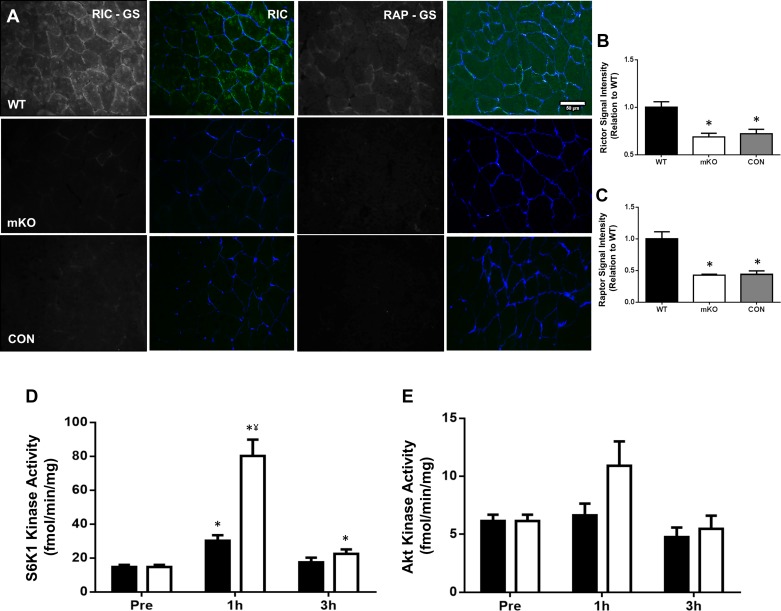
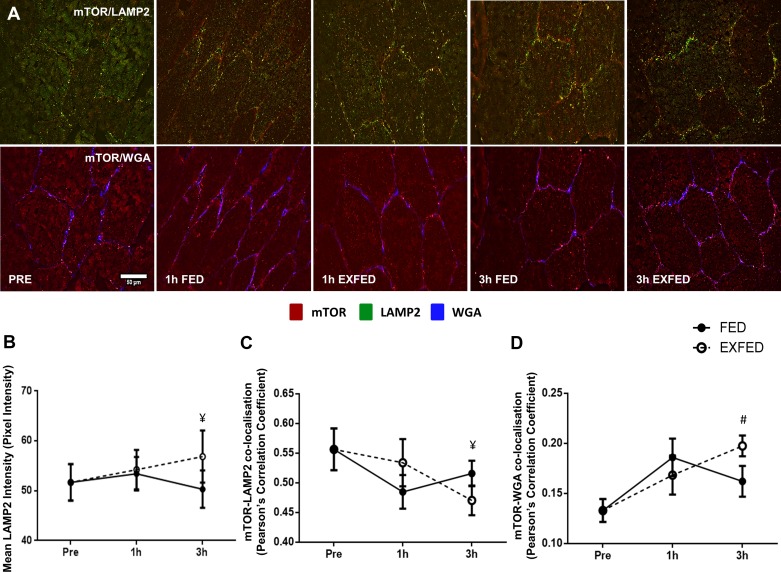
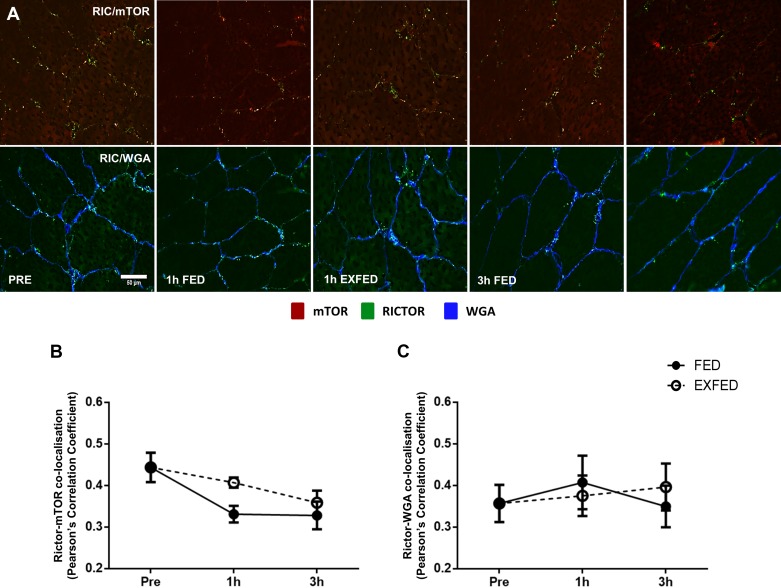
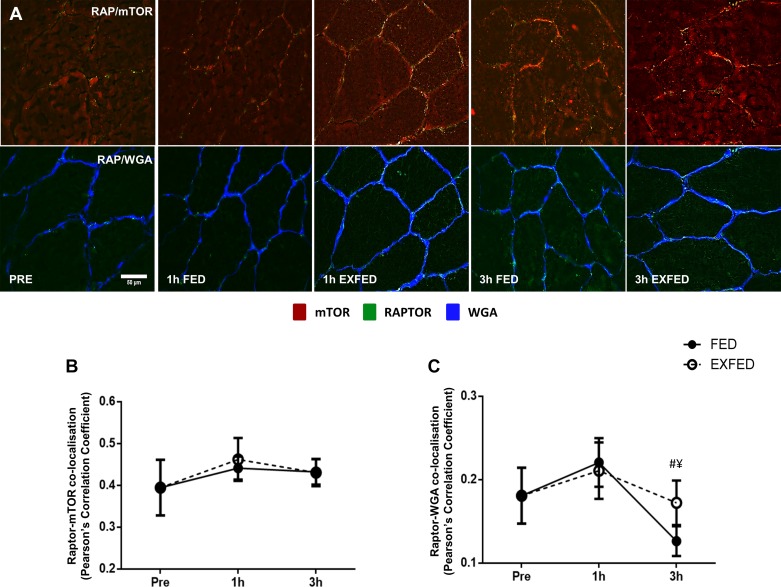
Mechanistic target of rapamycin (mTOR) resides as two complexes within skeletal muscle. mTOR complex 1 [mTORC1-regulatory associated protein of mTOR (Raptor) positive] regulates skeletal muscle growth, whereas mTORC2 [rapamycin-insensitive companion of mTOR (Rictor) positive] regulates insulin sensitivity. To examine the regulation of these complexes in human skeletal muscle, we utilized immunohistochemical analysis to study the localization of mTOR complexes before and following protein-carbohydrate feeding (FED) and resistance exercise plus protein-carbohydrate feeding (EXFED) in a unilateral exercise model. In basal samples, mTOR and the lysosomal marker lysosomal associated membrane protein 2 (LAMP2) were highly colocalized and remained so throughout. In the FED and EXFED states, mTOR/LAMP2 complexes were redistributed to the cell periphery [wheat germ agglutinin (WGA)-positive staining] (time effect; P = 0.025), with 39% (FED) and 26% (EXFED) increases in mTOR/WGA association observed 1 h post-feeding/exercise. mTOR/WGA colocalization continued to increase in EXFED at 3 h (48% above baseline) whereas colocalization decreased in FED (21% above baseline). A significant effect of condition (P = 0.05) was noted suggesting mTOR/WGA colocalization was greater during EXFED. This pattern was replicated in Raptor/WGA association, where a significant difference between EXFED and FED was noted at 3 h post-exercise/feeding (P = 0.014). Rictor/WGA colocalization remained unaltered throughout the trial. Alterations in mTORC1 cellular location coincided with elevated S6K1 kinase activity, which rose to a greater extent in EXFED compared with FED at 1 h post-exercise/feeding (P < 0.001), and only remained elevated in EXFED at the 3 h time point (P = 0.037). Collectively these data suggest that mTORC1 redistribution within the cell is a fundamental response to resistance exercise and feeding, whereas mTORC2 is predominantly situated at the sarcolemma and does not alter localization.
Keywords: Raptor; Rictor; lysosome; mTORC1; mTORC2.
Copyright © 2017 the American Physiological Society.
Figures
References
-
- Baar K, Esser K. Phosphorylation of p70(S6k) correlates with increased skeletal muscle mass following resistance exercise. Am J Physiol Cell Physiol 276: C120–C127, 1999. - PubMed
-
- Beals JW, Sukiennik RA, Nallabelli J, Emmons RS, van Vliet S, Young JR, Ulanov AV, Li Z, Paluska SA, De Lisio M, Burd NA. Anabolic sensitivity of postprandial muscle protein synthesis to the ingestion of a protein-dense food is reduced in overweight and obese young adults. Am J Clin Nutr 104: 1014–1022, 2016. doi: 10.3945/ajcn.116.130385. - DOI - PubMed
-
- Bentzinger CF, Romanino K, Cloëtta D, Lin S, Mascarenhas JB, Oliveri F, Xia J, Casanova E, Costa CF, Brink M, Zorzato F, Hall MN, Rüegg MA. Skeletal muscle-specific ablation of raptor, but not of rictor, causes metabolic changes and results in muscle dystrophy. Cell Metab 8: 411–424, 2008. doi: 10.1016/j.cmet.2008.10.002. - DOI - PubMed
-
- Biolo G, Tipton KD, Klein S, Wolfe RR. An abundant supply of amino acids enhances the metabolic effect of exercise on muscle protein. Am J Physiol Endocrinol Metab 273: E122–E129, 1997. - PubMed
MeSH terms
Substances
LinkOut - more resources
Full Text Sources
Other Literature Sources
Medical
Miscellaneous