. 2017 Dec;23(12):1745-1753.
doi: 10.1261/rna.062026.117. Epub 2017 Sep 28.

Slow molecular recognition by RNA

Affiliations

Slow molecular recognition by RNA

Kristin R Gleitsman et al. RNA. 2017 Dec.

Abstract

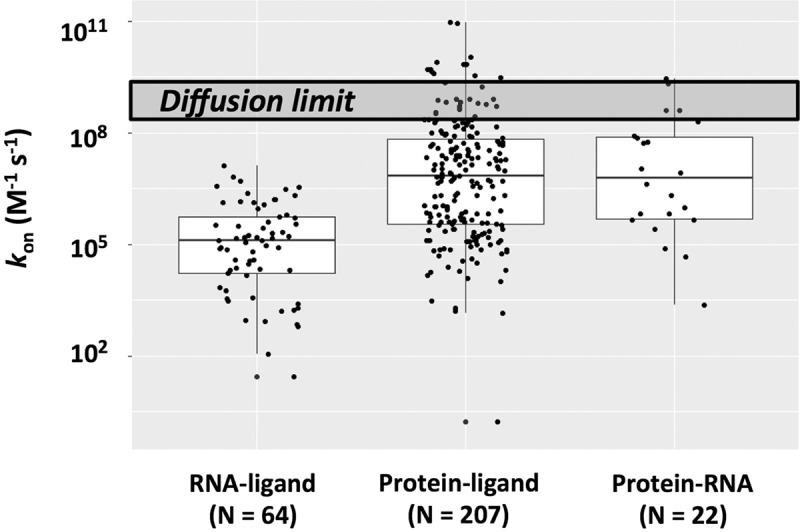
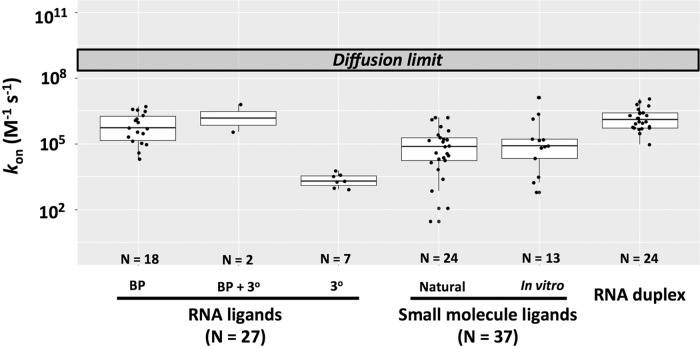
Molecular recognition is central to biological processes, function, and specificity. Proteins associate with ligands with a wide range of association rate constants, with maximal values matching the theoretical limit set by the rate of diffusional collision. As less is known about RNA association, we compiled association rate constants for all RNA/ligand complexes that we could find in the literature. Like proteins, RNAs exhibit a wide range of association rate constants. However, the fastest RNA association rates are considerably slower than those of the fastest protein associations and fall well below the diffusional limit. The apparently general observation of slow association with RNAs has implications for evolution and for modern-day biology. Our compilation highlights a quantitative molecular property that can contribute to biological understanding and underscores our need to develop a deeper physical understanding of molecular recognition events.

Keywords: RNA structure; binding kinetics; molecular recognition.


Figures

FIGURE 1.
FIGURE 1.
Rate constants for ligands binding to structured RNAs (left column) and to proteins (middle column) and for RNA•protein association (right column). Values are presented in Supplemental Tables S1–S3, and “N” is the number of examples in each column. The upper dark gray box represents a generic diffusion limit centered around 109 M−1 sec−1. In the box plot representations, the line inside the rectangle shows the median, the box spans the first quartile to the third quartile (representing the span from 0.25 to 0.75 of the ranked values), and the whiskers are shown as guides. The median values are as follows: RNA–ligand: 1.0 × 10⁵ M−1 sec−1; Protein–ligand: 6.6 × 10⁶ M−1 sec−1; and Protein–RNA: 6.3 × 10⁶ M−1 sec−1.
FIGURE 2.
FIGURE 2.
Rate constants for association involving RNA, separated into RNA/RNA associations (left), RNA/small molecule associations (middle), and RNA duplex formation (right). Rate constants between structured RNAs and RNA ligands are shown in the first three columns, and are further subdivided into interactions that involve formation of base pairs only (BP), formation of base pairs and additional tertiary interactions (BP + 3°), and formation of non-Watson–Crick, tertiary interactions only (3°). For the binding of non-RNA ligands to structured RNAs, association rate constants are broken down into naturally occurring and in vitro–selected RNAs. Values are presented in Supplemental Tables S1–S3 and S5, and “N” is the number of examples in each column. The median values are as follows: RNA-ligand: BP: 3.3 × 10⁵ M−1 sec−1; (BP + 3°): 5.7 × 10⁶ M−1 sec−1; 3°: 2.0 × 10³ M−1 sec−1. The median values for RNA-small molecule ligands are 5.5 × 10⁴ and 8.1 × 10⁴ M−1 sec−1 for natural and in vitro RNAs, respectively. The median value for RNA duplex is 1.3 × 10⁶ M−1 sec−1.
FIGURE 3.
FIGURE 3.
Schematic depiction of the progression from an RNA world to the modern biological world. We use the RNA and protein subunits of RNase P as well as tRNA synthetase to illustrate this progression. RNA's tendency to form long-lived misfolded states is depicted on the far left. (i) Short peptide sequences that nonspecifically bind RNA can act as chaperones and provide a selective advantage for an organism that can escape these traps to yield a higher fraction of RNA molecules in functional conformations. (ii) Once peptides gained a foothold there would be a selective advantage for longer and more accurate peptide production that could lead to specific binding and to structured proteins. (iii) As protein catalytic function emerged and competed with ribozymes, RNA association rates may have limited catalytic efficiency and contributed to the current widespread use of proteins for catalysis. The blue circle corresponds to the amino acid covalently attached to tRNA by tRNA synthetase.
FIGURE 4.
FIGURE 4.
Descriptions of molecular binding events. (A) Simple model of ligand binding. Binding event between receptor (R) and ligand (L) to form receptor-ligand complex (R•L) represented as simple association processes governed by a single set of association and dissociation rates. When association is slower than diffusion-limited collision, additional steps are needed to describe binding. (B) Induced fit and conformational capture models of ligand binding. These models account for slower-than-diffusional binding. The tertiary capture model invokes conformational changes prior to the encounter between R and L, while the induced fit model represents the opposite extreme in which conformational changes occur after the initial encounter. (C) Complex model of ligand binding considering an ensemble of conformational states and series of conformational changes to the receptor during the association process. Even the complex representation in the figure is a vast simplification, as it depicts a linear order of conformation changes (and a limited number of conformational steps) rather than a larger and more realistic multi-dimensional energy landscape that can account for multiple orders for the local conformational changes and multiple possible binding pathways.
FIGURE 5.
FIGURE 5.
Free energy diagram for simple duplex formation zipper model. In the zipper model, nucleation involves the formation of 2–3 bp, after which subsequent base-pair formation is favored over the dissociation of the nucleation complex. The bimolecular association rate between two ssRNA molecules is limited by this nucleation rate (kduplex). Because the formation of these 2–3 bp is uphill in energy from an initial encounter between the two strands, the association rate for duplex formation (kduplex) is slower than diffusional encounter (kdiff).

References

    1. Arya DP. 2011. New approaches toward recognition of nucleic acid triple helices. Accounts Chem Res 44: 134–146. - PMC - PubMed
    1. Berg OG, von Hippel PH. 1985. Diffusion-controlled macromolecular interactions. Annu Rev Biophys Biophys Chem 14: 131–160. - PubMed
    1. Bloom JD, Labthavikul ST, Otey CR, Arnold FH. 2006. Protein stability promotes evolvability. Proc Natl Acad Sci 103: 5869–5874. - PMC - PubMed
    1. Bloomfield VA, Crothers DM, Tinoco I. 2000. Nucleic acids: structure, properties, and functions. University Science Books, Sausalito, CA.
    1. Boehr DD, Nussinov R, Wright PE. 2009. The role of dynamic conformational ensembles in biomolecular recognition. Nat Chem Biol 5: 789–796. - PMC - PubMed

Publication types

LinkOut - more resources