. 2017 Oct 20;358(6361):eaan6619.
doi: 10.1126/science.aan6619. Epub 2017 Sep 28.

Natural polyreactive IgA antibodies coat the intestinal microbiota

Affiliations

Natural polyreactive IgA antibodies coat the intestinal microbiota

Jeffrey J Bunker et al. Science. .

Abstract

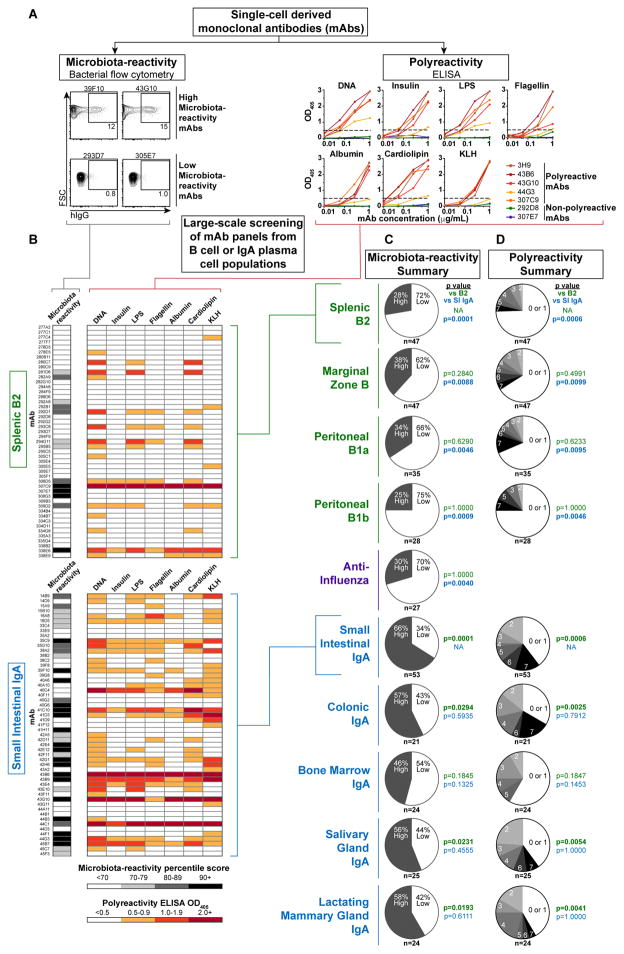
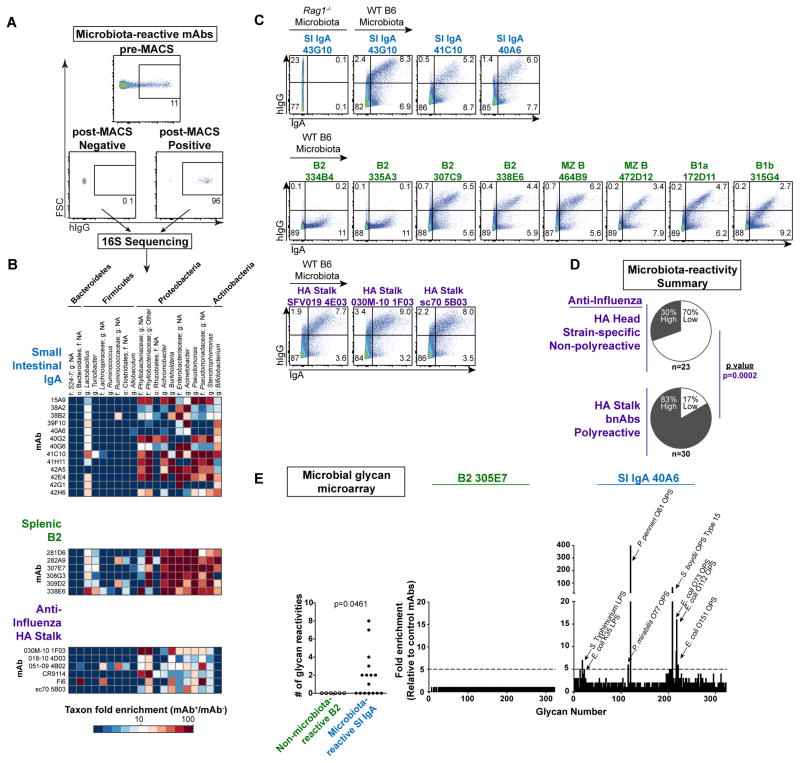
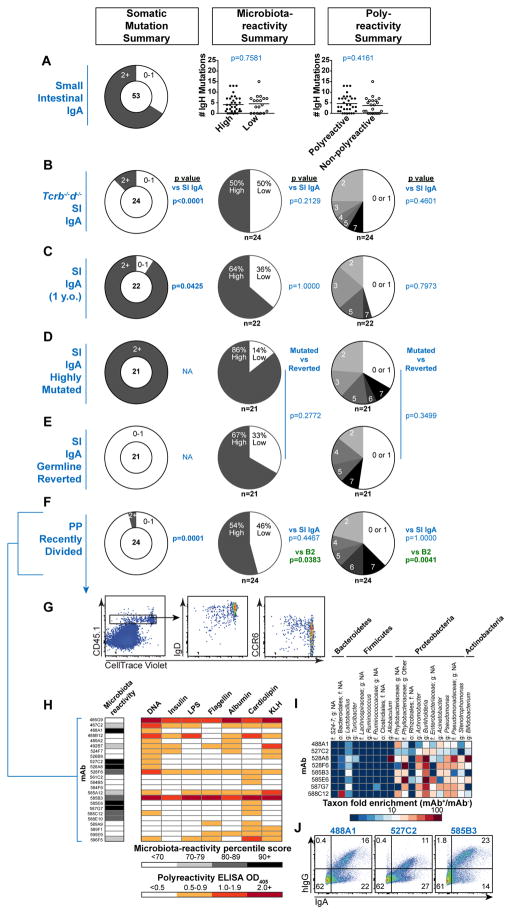
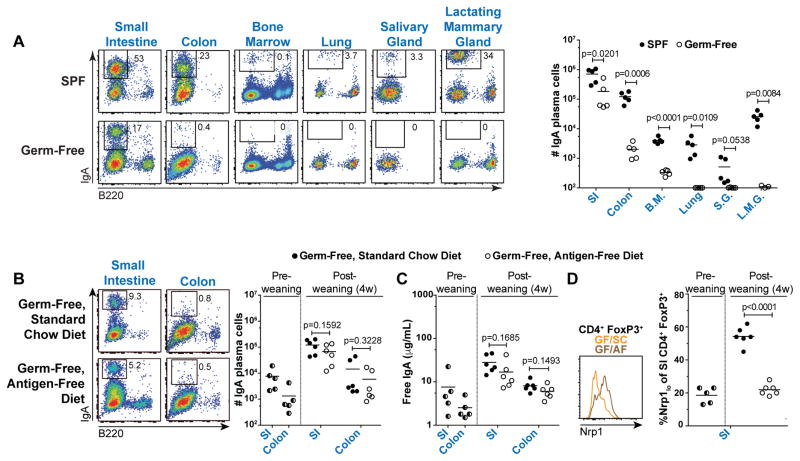
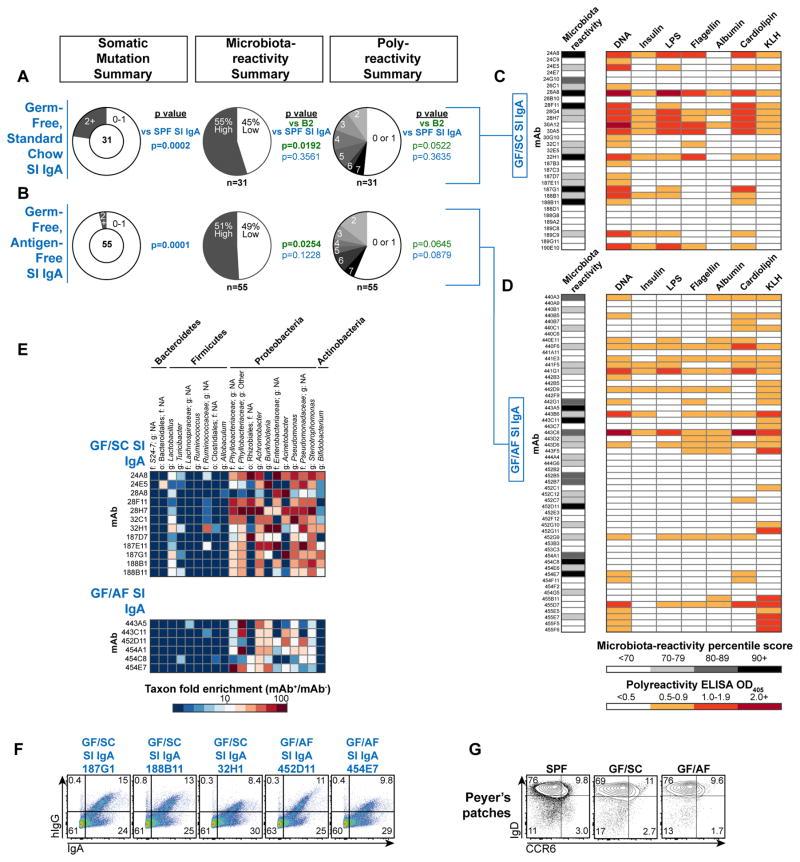
Large quantities of immunoglobulin A (IgA) are constitutively secreted by intestinal plasma cells to coat and contain the commensal microbiota, yet the specificity of these antibodies remains elusive. Here we profiled the reactivities of single murine IgA plasma cells by cloning and characterizing large numbers of monoclonal antibodies. IgAs were not specific to individual bacterial taxa but rather polyreactive, with broad reactivity to a diverse, but defined, subset of microbiota. These antibodies arose at low frequencies among naïve B cells and were selected into the IgA repertoire upon recirculation in Peyer's patches. This selection process occurred independent of microbiota or dietary antigens. Furthermore, although some IgAs acquired somatic mutations, these did not substantially influence their reactivity. These findings reveal an endogenous mechanism driving homeostatic production of polyreactive IgAs with innate specificity to microbiota.


Figures

Figure 1
Figure 1. Microbiota-reactivity and polyreactivity of monoclonal antibodies from IgA plasma cell populations and naïve B cell subsets
(A) Workflow for characterizing monoclonal antibodies (mAbs) cloned from sorted single cells. All mAbs were expressed as monomers with murine variable regions and human IgG1/Igκ constant regions except anti-influenza mAbs, which had fully human variable regions. mAbs were scored for microbiota-reactivity by bacterial flow cytometry against Rag1−/− SI microbiota or polyreactivity by ELISA against indicated antigens. (B) Microbiota-reactivity percentile scores and polyreactivity ELISA OD405 values for individual mAbs from indicated panels. (C) Summaries of indicated panels scored for microbiota-reactivity, indicating percent of mAbs that scored either high or low microbiota-reactivity; or (D) Polyreactivity summaries, indicating percent of mAbs with indicated number of positive reactivities. Numbers of mAbs analyzed in each panel are indicated below each chart. P values calculated by Fisher’s exact test against B2 (green) or SI IgA (blue) panels. Data compiled from >30 independent experiments.
Figure 2
Figure 2. Microbiota-reactive antibodies bind a broad but defined subset of commensal bacteria
(A) Representative plots depicting pre-MACS and post-MACS positive or negative fractions used for 16S sequencing analysis of mAb-bound or –unbound bacteria purified from Rag1−/− SI microbiota. (B) Microbial taxa bound by individual mAbs from indicated panels; enrichment in 16S sequencing data calculated by relative abundance in mAb+/mAb fractions. All mAbs in a given panel were co-purified in the same experiment. Data compiled from three independent experiments. Taxonomy abbreviations: o= order; f=family; g=genus. (C) Flow cytometry of Rag1−/− or WT B6 colonic microbiota comparing bacteria stained by indicated mAbs with those endogenously coated by polyclonal IgA. Data compiled from three independent experiments. (D) Summary of microbiota-reactivity for panels of non-polyreactive strain-specific mAbs against the HA head or polyreactive bnAbs against the HA stalk. Numbers of mAbs analyzed in each panel are indicated below each chart. P value calculated by Fisher’s exact test. (E) Summary of microbial glycan microarray reactivities for microbiota-reactive IgA mAbs or non-microbiota-reactive B2 mAbs (left), and representative reactivities of individual mAbs (right). P value calculated by Fisher’s exact test. Data expressed as enrichment over average background of six B2 negative control mAbs. Annotated peaks showed >5-fold enrichment. Data compiled from two independent experiments.
Figure 3
Figure 3. Mechanisms of IgA selection
Summary of somatic mutations, microbiota-reactivity, and polyreactivity of mAb panels derived from (A) SI IgA PCs from 8–15 week old WT B6 mice, (B) Tcrb−/−d−/− SI IgA PCs, or (C) SI IgA PCs from one-year-old WT B6 mice. Data compiled from >5 independent experiments. (D–E) Summary of 21 highly mutated SI IgAs and their engineered germline revertants, or (F) recently divided CD45.1+ donor-derived cells in PPs 7d after transfer to MD4Tg recipients, isolated as indicated in (G). (H) Microbiota-reactivity percentile scores and polyreactivity ELISA OD405 values of individual mAbs from recently divided cells in PPs, compiled from three independent experiments, (I) Microbial taxa binding patterns of individual mAbs as determined by 16S sequencing, or (J) double staining of colonic microbiota comparing individual mAbs with endogenously IgA-coated bacteria. Numbers of mAbs analyzed in each panel are indicated below each chart. P values calculated by unpaired t test in panel A and Fisher’s exact test in panels B–F.
Figure 4
Figure 4. Small intestinal IgA plasma cell differentiation does not require exogenous microbiota or dietary antigens
(A) Representative flow cytometry plots and cell number summary of IgA PCs in SPF or GF B6 mice. Plots gated on lineage lymphocytes. L.M.G. were obtained from females 3–7d post-partum; all other tissues were from males. P values calculated by unpaired t test. (B) Representative flow cytometry plots and cell number summary of IgA PCs or (C) Luminal free IgA titers determined by ELISA in indicated mice, and (D) Representative flow cytometry of SI CD4+ FoxP3+ cells and summary of percent Nrp1lo among CD4+ FoxP3+ cells in indicated mice. P values calculated by unpaired t test. Data compiled from four independent experiments.
Figure 5
Figure 5. Natural IgA selection
Summary of somatic mutations, microbiota-reactivity, and polyreactivity of mAb panels derived from (A) GF/SC SI IgA PCs or (B) GF/AF SI IgA PCs. Numbers of mAbs analyzed in each panel are indicated below each chart. P values calculated by Fisher’s exact test. (C–D) Microbiota-reactivity percentile scores and polyreactivity ELISA OD405 values of individual mAbs from GF/SC and GF/AF SI IgA panels. Data compiled from >6 independent experiments. (E) Microbial taxa binding patterns of individual mAbs as determined by 16S sequencing, or (F) double staining of colonic microbiota comparing individual mAbs with endogenously IgA-coated bacteria. (G) Flow cytometry of CD19+IgD+CCR6+ cells in PPs of SPF, GF/SC, or GF/AF mice. Representative of two independent experiments.

References

    1. Honda K, Littman DR. The microbiota in adaptive immune homeostasis and disease. Nature. 2016;535:75–84. - PubMed
    1. Macpherson AJ, Uhr T. Induction of protective IgA by intestinal dendritic cells carrying commensal bacteria. Science. 2004;303:1662–1665. - PubMed
    1. Slack E, et al. Innate and adaptive immunity cooperate flexibly to maintain host-microbiota mutualism. Science. 2009;325:617–620. - PMC - PubMed
    1. Bunker JJ, et al. Innate and Adaptive Humoral Responses Coat Distinct Commensal Bacteria with Immunoglobulin A. Immunity. 2015;43:541–553. - PMC - PubMed
    1. Macpherson AJ, et al. A primitive T cell-independent mechanism of intestinal mucosal IgA responses to commensal bacteria. Science. 2000;288:2222–2226. - PubMed

Publication types