. 2018 Mar 1;314(3):F343-F355.
doi: 10.1152/ajprenal.00590.2016. Epub 2017 Sep 27.

Early life stress induces immune priming in kidneys of adult male rats

Affiliations

Early life stress induces immune priming in kidneys of adult male rats

Carmen De Miguel et al. Am J Physiol Renal Physiol. .

Abstract

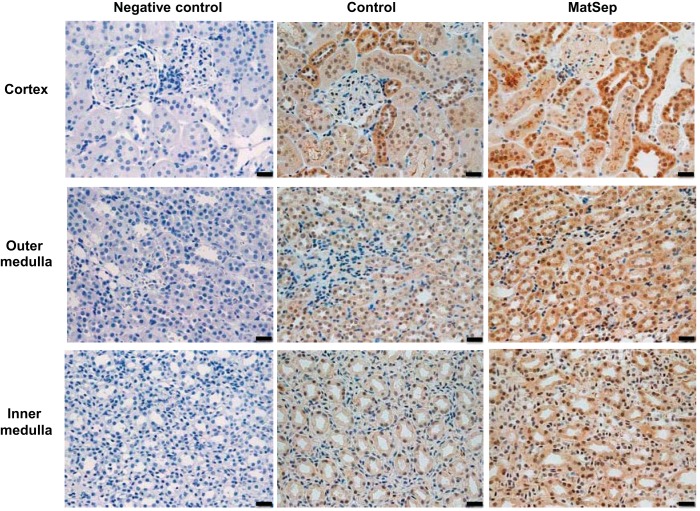
Early life stress (ELS) in humans is associated with elevated proinflammatory markers. We hypothesized that ELS induces activation of the immune response in a rat model of ELS, maternal separation (MatSep), in adulthood. MatSep involves separating pups from the dam from postnatal day 2 to postnatal day 14 for 3 h/day. Control rats are nonseparated littermates. We determined circulating and renal immune cell numbers, renal immune cell activation markers, renal cytokine levels, and the renal inflammatory gene expression response to low-dose lipopolysaccharide (LPS) in male MatSep and control rats. We observed that MatSep did not change the percentage of gated events for circulating CD3+, CD4+, CD8+, and CD4+/Foxp3+ cells or absolute numbers of mononuclear and T cells in the circulation and kidneys; however, MatSep led to an increase in activation of renal neutrophils as well as CD44+ cells. Renal toll-like receptor 4 (TLR4) and interleukin 1 beta (IL-1β) was significantly increased in MatSep rats, specifically in the outer and inner medulla and distal nephron, respectively. Evaluation of renal inflammatory genes showed that in response to a low-dose LPS challenge (2 mg/kg iv) a total of 20 genes were significantly altered in kidneys from MatSep rats (17 genes were upregulated and 3 were downregulated), as opposed to no significant differences in gene expression in control vs. control + LPS groups. Taken together, these findings indicate that MatSep induces priming of the immune response in the kidney.

Keywords: cytokines; early life stress; immune response; kidney; lipopolysaccharide; maternal separation.


Figures

Fig. 1.
Fig. 1.
A: percent gated events of circulating immune cells. B: absolute numbers of mononuclear and T cells in blood and kidney of control and maternal separation (MatSep) rats. Results are expressed as means ± SE. *P < 0.05 vs. control; n = 4–6/group.
Fig. 2.
Fig. 2.
Representative images of IL-1β protein expression in the renal cortex, outer medulla, and inner medulla of control and MatSep rats. n = 6–8/group. Scale bar, 20 μm.
Fig. 3.
Fig. 3.
A: representative images of TLR4 in the renal cortex, outer medulla, and inner medulla of control and MatSep rats. B: percentage of cortex, outer medulla, and inner medulla stained positive for TLR4. C: numbers of TLR4-positive cells in the outer medulla and inner medulla of control and MatSep rats. *P < 0.05 vs. control. n = 5–7/group. Black scale bar, 50 μm; white scale bar, 20 μm; inset scale bar, 2 mm.
Fig. 4.
Fig. 4.
Left: representative images of proliferating cells (Ki-67-positive cells) in the renal cortex, outer medulla, and inner medulla of control and MatSep rats. Right: quantification of Ki-67-positive cells in cortex, outer medulla, and inner medulla of control and MatSep rats. *P < 0.05 vs. control; n = 6–8/group. Scale bar, 20 μm. Arrows denote Ki-67-positive cells.
Fig. 5.
Fig. 5.
Left: representative images of activated neutrophils (MPO-positive cells) in the renal cortex, outer medulla, and inner medulla of control and MatSep rats. Right: quantification of MPO-positive cells in cortex, outer medulla, and inner medulla of control and MatSep rats. *P < 0.05 vs. control; n = 6–8/group. Scale bar, 20 μm. Arrows denote MPO positive cells.
Fig. 6.
Fig. 6.
A: percentage of renal cortex or renal outer medulla stained positive for CD44; n = 5–8/group. B: representative images of CD44+ protein expression in renal outer medulla of control and MatSep rats. Scale bar, 50 μm. C: representative images of CD44 staining in cortex from control and MatSep rats. Yellow circles and arrows indicate glomeruli containing CD44+ cells, and purple circles and arrows indicate glomeruli with no CD44+ cells. Black arrows in the inset photos designate CD44+ cells within the glomerulus. Black scale bar, 100 μm; white scale bar, 20 μm. D: percentage of glomeruli containing CD44+ cells and average number of CD44+ cells/glomerulus in control and MatSep rat renal cortex. n = 5–8/group.
Fig. 7.
Fig. 7.
Absolute number of mononuclear and T cells in blood and kidney of control and MatSep rats after low-dose LPS treatment. n = 5–7/group.

References

    1. Akdis M, Burgler S, Crameri R, Eiwegger T, Fujita H, Gomez E, Klunker S, Meyer N, O'Mahony L, Palomares O, Rhyner C, Ouaked N, Schaffartzik A, Van De Veen W, Zeller S, Zimmermann M, Akdis CA. Interleukins, from 1 to 37, and interferon-gamma: receptors, functions, and roles in diseases. J Allergy Clin Immunol 127: 701–721.e701-770, 2011. doi: 10.1016/j.jaci.2010.11.050. - DOI - PubMed
    1. Alastalo H, Räikkönen K, Pesonen AK, Osmond C, Barker DJ, Heinonen K, Kajantie E, Eriksson JG. Cardiovascular morbidity and mortality in Finnish men and women separated temporarily from their parents in childhood–a life course study. Psychosom Med 74: 583–587, 2012. doi: 10.1097/PSY.0b013e31825b3d76. - DOI - PubMed
    1. Alastalo H, Raikkonen K, Pesonen AK, Osmond C, Barker DJ, Kajantie E, Heinonen K, Forsen TJ, Eriksson JG. Cardiovascular health of Finnish war evacuees 60 years later. Ann Med 41: 66–72, 2009. doi: 10.1080/07853890802301983. - DOI - PubMed
    1. Alastalo H, Räikkönen K, Pesonen AK, Osmond C, Barker DJP, Heinonen K, Kajantie E, Eriksson JG. Early life stress and blood pressure levels in late adulthood. J Hum Hypertens 27: 90–94, 2013. doi: 10.1038/jhh.2012.6. - DOI - PubMed
    1. Bellavance MA, Rivest S. The HPA-immune axis and the immunomodulatory actions of glucocorticoids in the brain. Front Immunol 5: 136, 2014. doi: 10.3389/fimmu.2014.00136. - DOI - PMC - PubMed

Publication types

MeSH terms